My temperature forecasts for the next 15 days
Jump to the forecasts or to the verification
Analysis of these maximum and minimum temperature forecasts for 18th June to 17th July 2008 for Hurn provided by Martin Rowley.
Brief outline of the method
- The starting point for the forecasts are NCEP ensemble forecasts (available at a resolution of 1x1 (latitude-longitude) degrees); I use the control run and 10 ensemble members - 11 forecasts in all.
- The forecasts cover the period 6-384 hours after the analysis time - providing 15 days of daily forecasts.
- For a given location (at which daily maximum and minimum temperatures must also be available), the average maximum and minimum forecast temperatures at each forecast time are determined from the model output.
- Analysis of previous forecasts for each of the 15 forecast lengths (1 day, 2 days, etc) against the subsequent verifying observations for a period of up to 30 days before the start time of the current forecasts, produces a bias correction which is applied to the model-derived forecast to generate my station forecast (the 'issued' forecast). This allows the bias to vary with time of year, etc.
- The issued forecasts relate to the period 0600-1800UTC for maximum temperatures and 1800-0600UTC for minimum temperatures.
- Once the observations become available, they are compared against the issued forecasts in order to analyse the error in the issued forecast, both as a function of forecast length (0-day, 1-day, 2-day, etc.) and calendar date (by combining all forecasts made for that date).
- More details of these validation results will be posted once sufficient forecasts have been created.
Guide to the forecasts
The forecasts contain:
- Recent observations of minimum, maximum and mean (i.e. the average of minimum and maximum) temperature for up to 10 days. Note that observations from Reading and Maidenhead are currently added manually to the database (observations from other sites are extracted automatically from SYNOP reports) and may contain several missing values if I have been unable to update them recently.
- Forecasts for 15 days ahead of
- minimum (1800-0600UTC) temperature,
- maximum (0600-1800UTC) temperature and
- mean temperature.
- An indication of the forecast confidence based on the standard deviation of the value of the error (equal to the issued forecast minus the observation) of the past 30 forecasts - for each of the forecast lengths (0 days, 1 day, 2 days, etc.). In general the confidence will get less as the forecast length increases.
- 'Hi' denotes a standard deviation in the error of under 1.5C (a 'high' accuracy forecast)
- '-' denotes a standard deviation in the error of 1.5-3.0C (mid-range accuracy), while
- 'Lo' denotes a standard deviation in the error of over 3.0C.
- Note that no account has been yet taken of the forecast uncertainty implied by the spread of the individual ensemble forecast values, as it is considered that interpolation from the gridded data to the observation location probably creates a larger uncertainty.
The latest observations
The latest forecasts
- London Heathrow, SE England
- Reading, SE England
- Maidenhead, SE England
- Herstmonceux, SE England
- Bournemouth Hurn, Cent S England
- Bristol Filton, SW England
- Camborne, SW England
- Coleshill, Midlands
- Shawbury, Midlands
- Marham, East Anglia (forecasts began 20.09.2008)
- Wattisham, East Anglia
- Waddington, E England
- Leeming, NE England
- Manchester Rostherne, NW England (forecasts began 16.09.2013)
- Carlisle, NW England
- St. Athan, S Wales
- Aberporth, W Wales
- Valley, N Wales
- Ronaldsway, Isle of Man
- Glasgow, SW Scotland
- Edinburgh, E Scotland
- Aberdeen Dyce, E Scotland
- Kinloss, N Scotland
- Lerwick, N Scotland
- Belfast, Northern Ireland
- Dublin, E Ireland
- Belmullet, W Ireland
- Valentia, SW Ireland
Verification
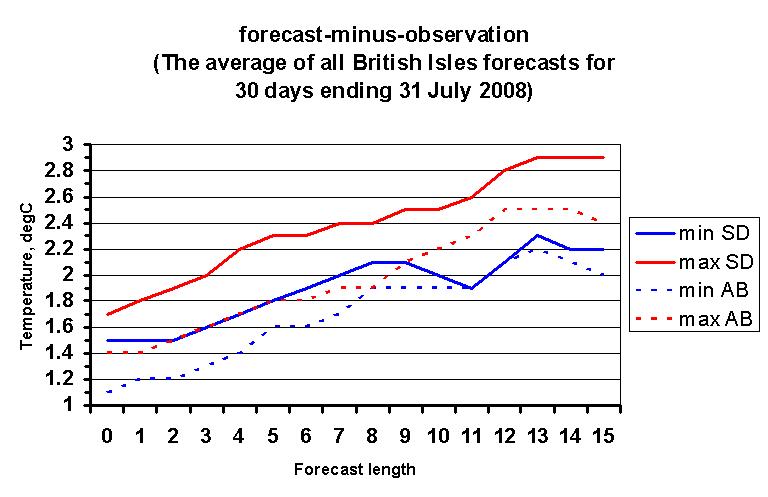
To see how good (or bad) recent forecasts actually were, see these comparisons of observations for yesterday against previous forecasts valid for yesterday:
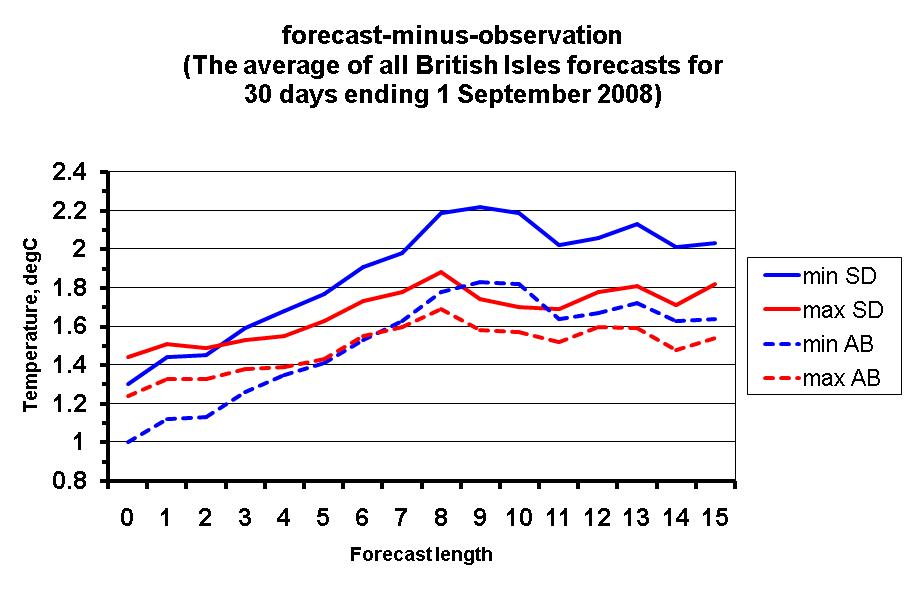
 The images above show the standard deviation (SD) and the absolute value (AB) of the forecast error (where the error is the difference between the forecast and the subsequent observation), averaged across all sites for the 30-day periods indicated.
- In general the forecast quality reduces with increasing forecast length with maximum temperature forecasts prone to a larger error than those for minimum temperatures.
- Forecasts for coastal locations have a slightly smaller error - presumably due to the smaller diurnal ranges caused by oceanic influence.
Comments?
Your comments are welcome, and can be posted to me.
Disclaimer
The forecasts listed above use model data that are kindly provided by NCEP and a computer algorithm of my own devising. Neither my employers nor myself are professional weather forecasters and, while these forecasts may give an indication of conditions to come, we cannot accept any responsibility for the accuracy of this forecast.The weather over the British Isles is part of an ever-changing system. The data on these pages should be used as a guide only and there are times when any forecast beyond about 2-3 days is likely to prove unreliable. In addition, it it unwise to make inferences about other weather elements, e.g. rainfall, from temperature forecasts alone.
Always check the latest forecast from the UK Met Office before undertaking any weather-dependant activity.
You are visitor number 10437 to this page since 4 June 2008.
Other useful links
- My homepage/surface charts
- Local weather:
- Maidenhead's recent weather and climate
- Reading's climate, 1991-2020
- Current UK/Ireland weather information:
- Maps:
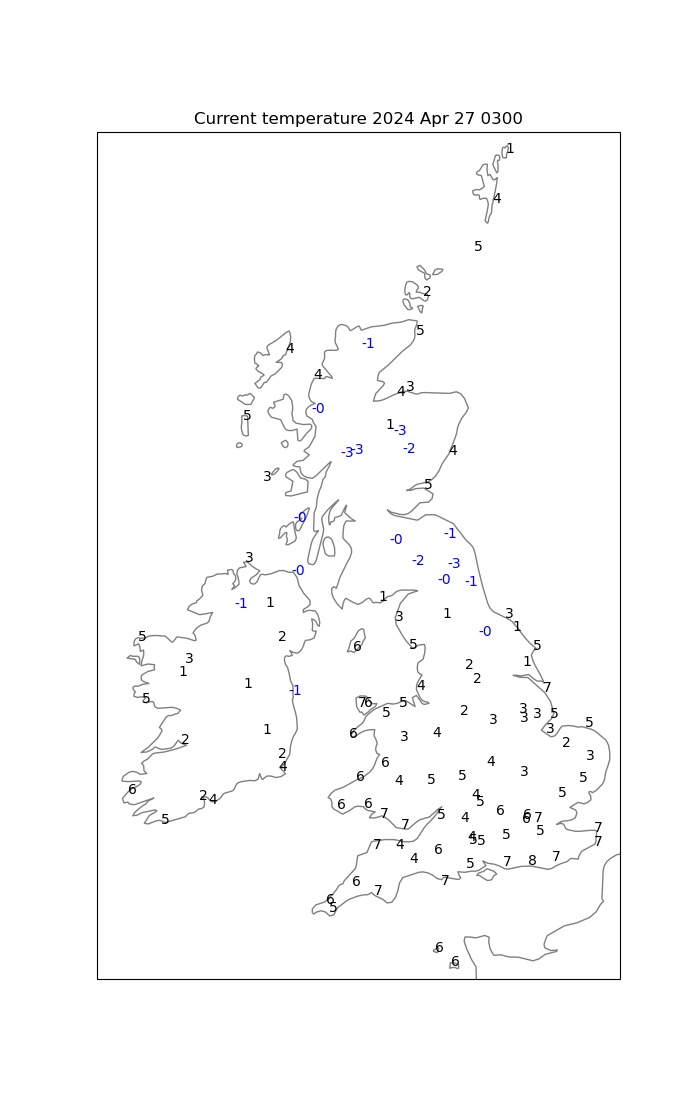
- Current temperature
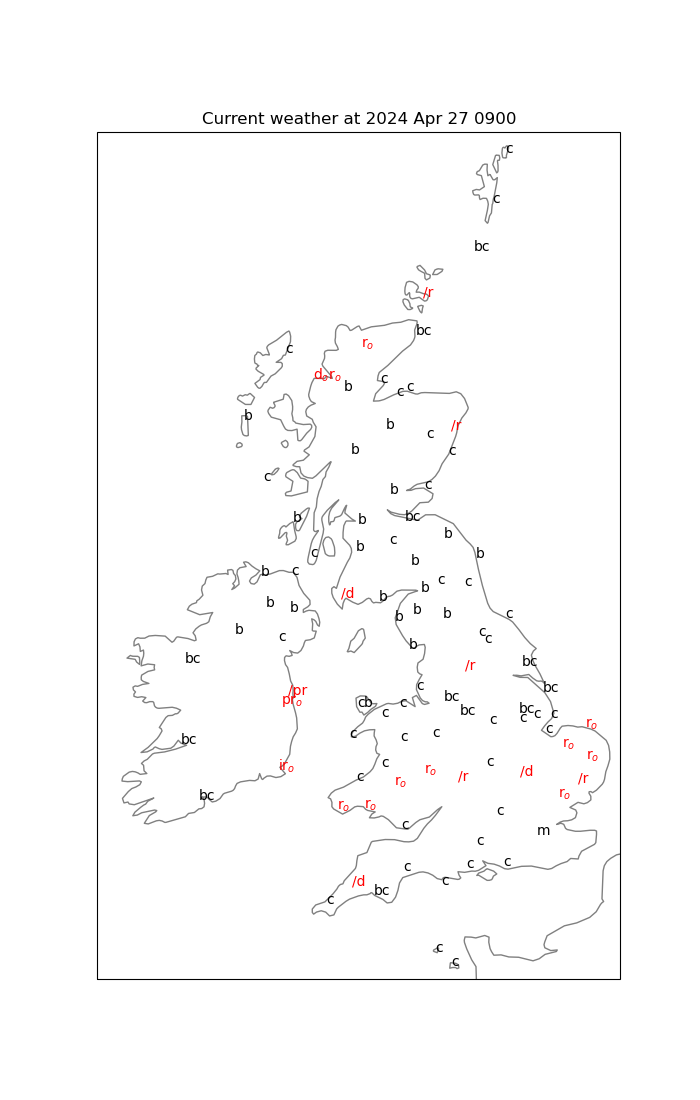
- Current weather
- Plotted daily extremes
- Current weather
- Monthly summaries:
- The month so far - text
- Last month - text
- The month so far - charts
- Last month - text
 August 2016: Details
and order form for this new book about weather observing.
August 2016: Details
and order form for this new book about weather observing.
 Details
and order form for this limited edition publication.
Details
and order form for this limited edition publication.
Met Dept Home
- My publications
- Maidenhead weather
- Current, recent and historical weather in Reading, Berkshire
- East Berkshire temperatures
- Maidenhead (Berkshire) rainfall
- UK weather diary
- Reading weather 'on this day in ...'
- World weather news stories
- Met-Jobs mailing list
 Read about and order this NEW book about the weather of Reading.
See also
Make your own weather observations? Then see the Climatological Observers Link
The Tornado and Storm Research Organisation
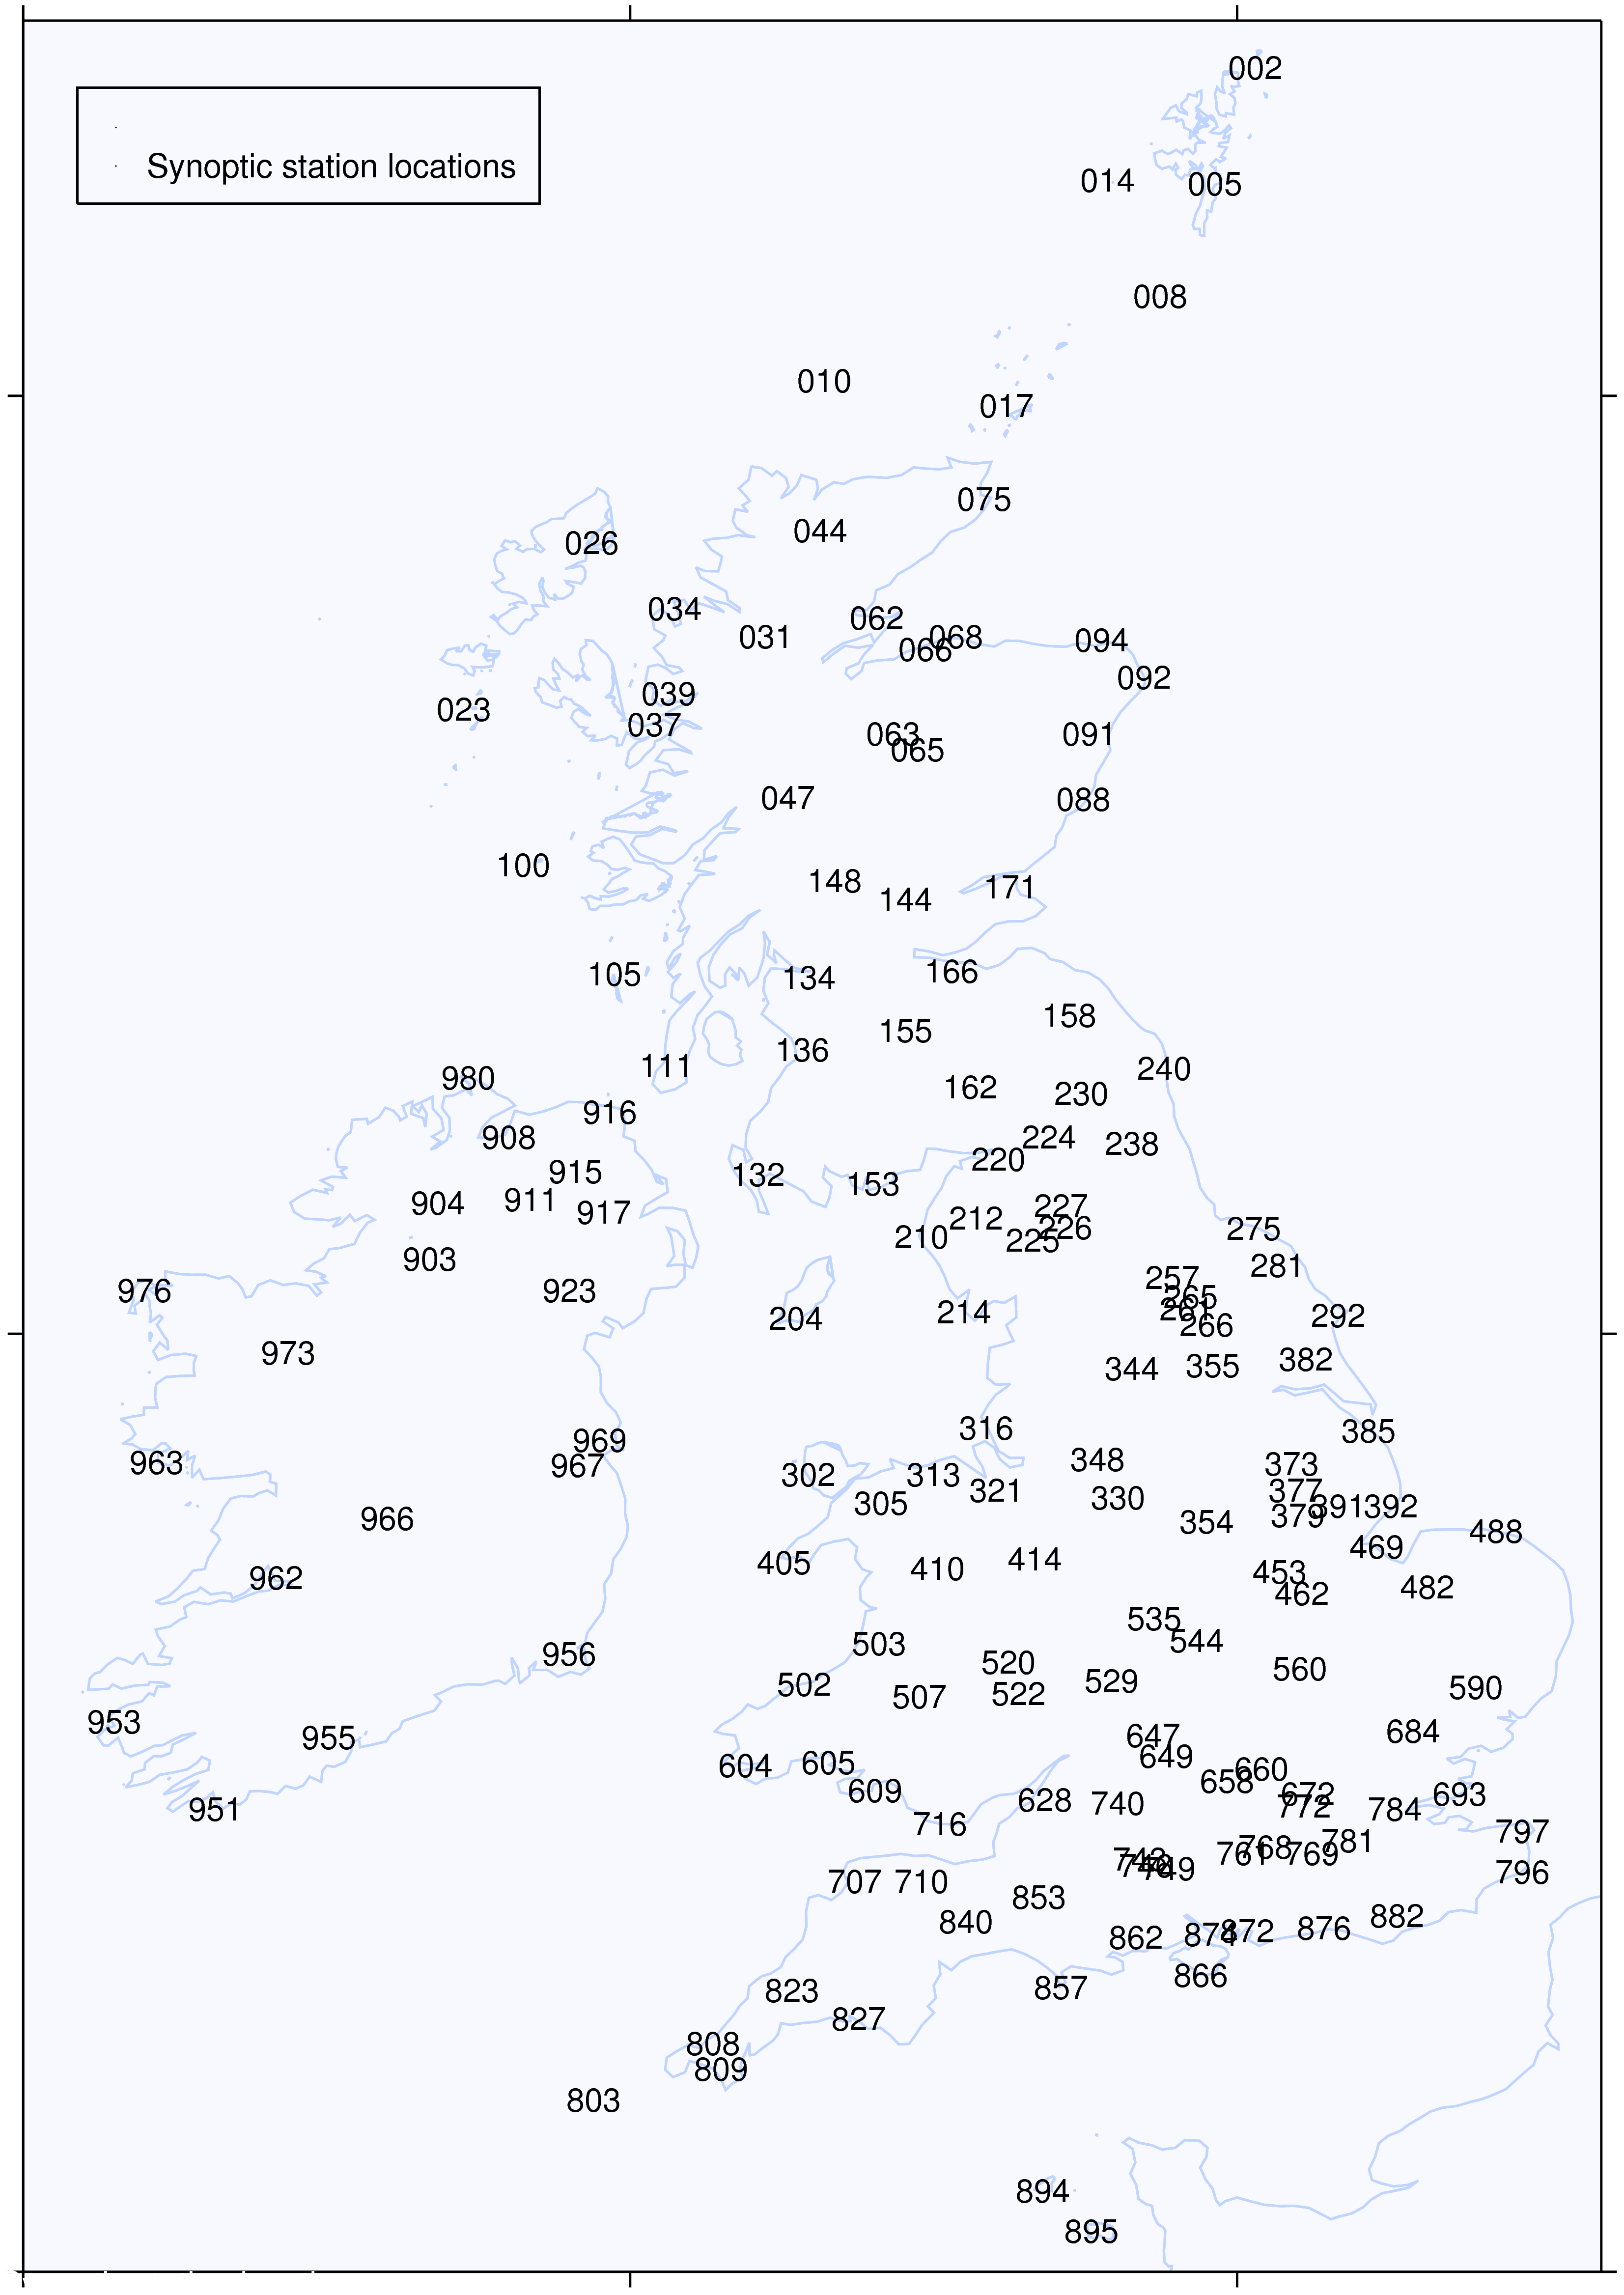
UK/Ireland synoptic station locations:
- Maidenhead weather