|
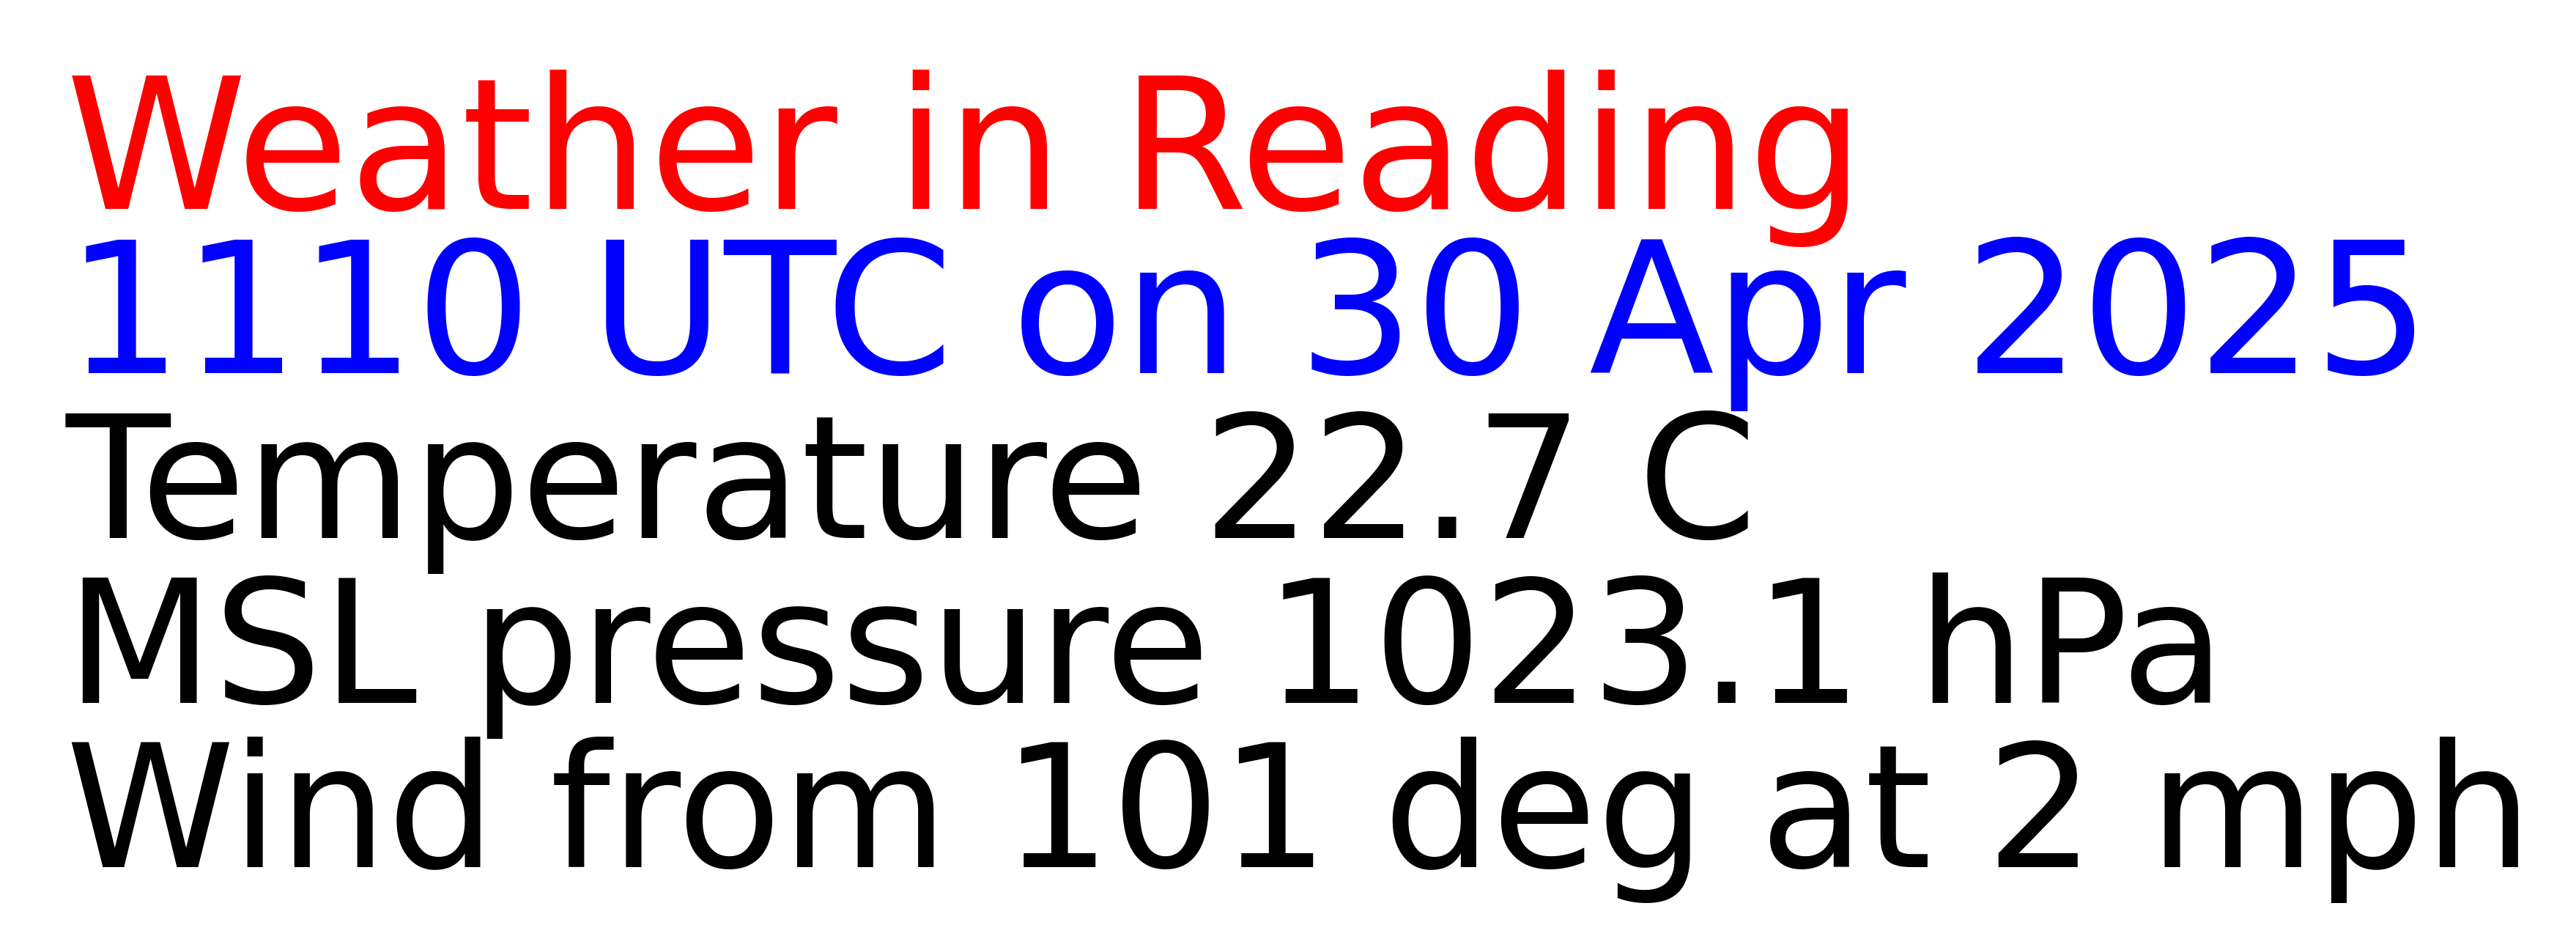
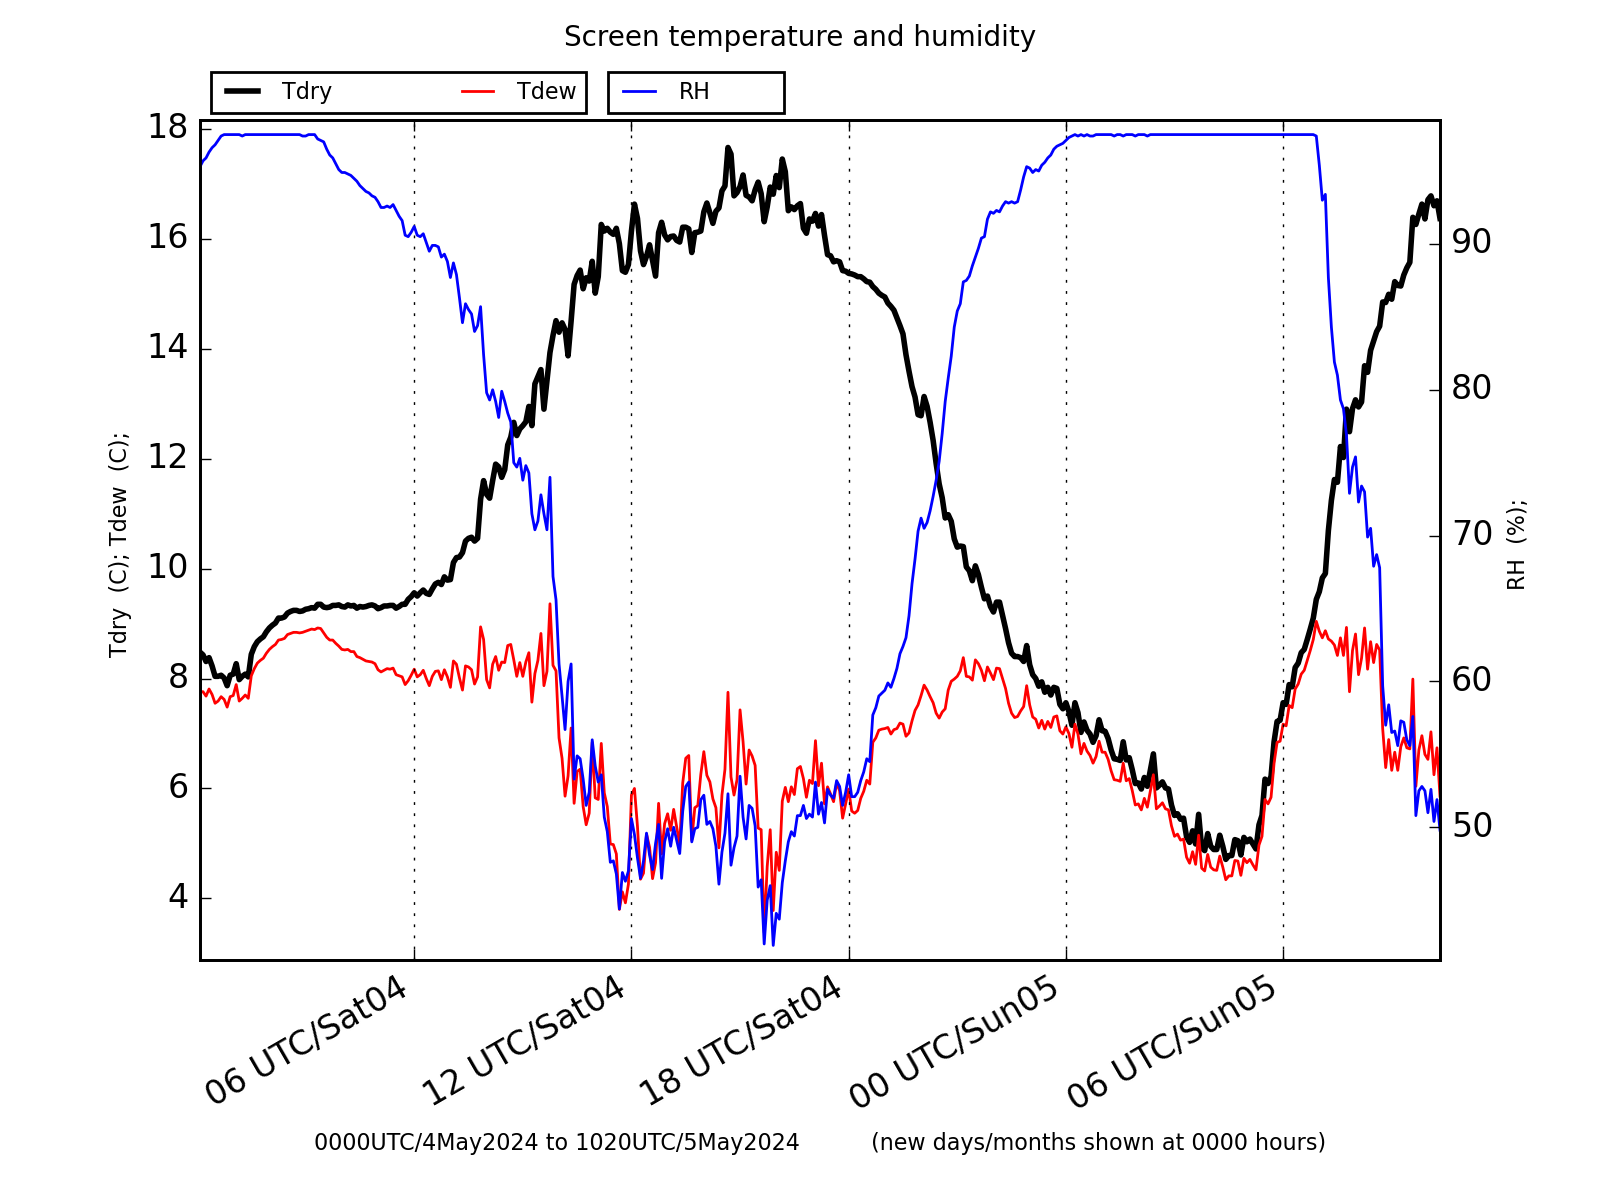
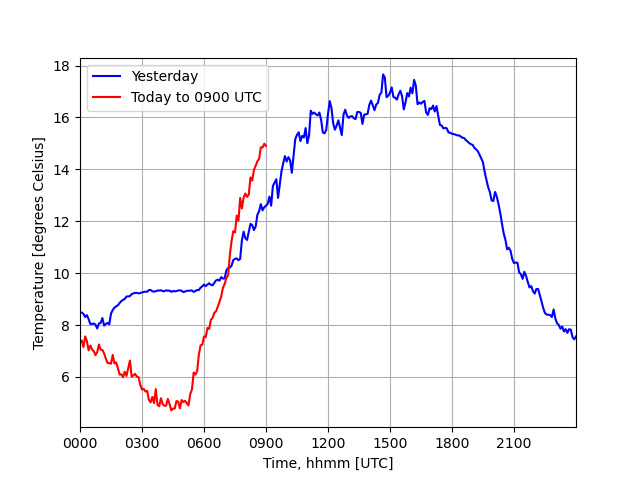
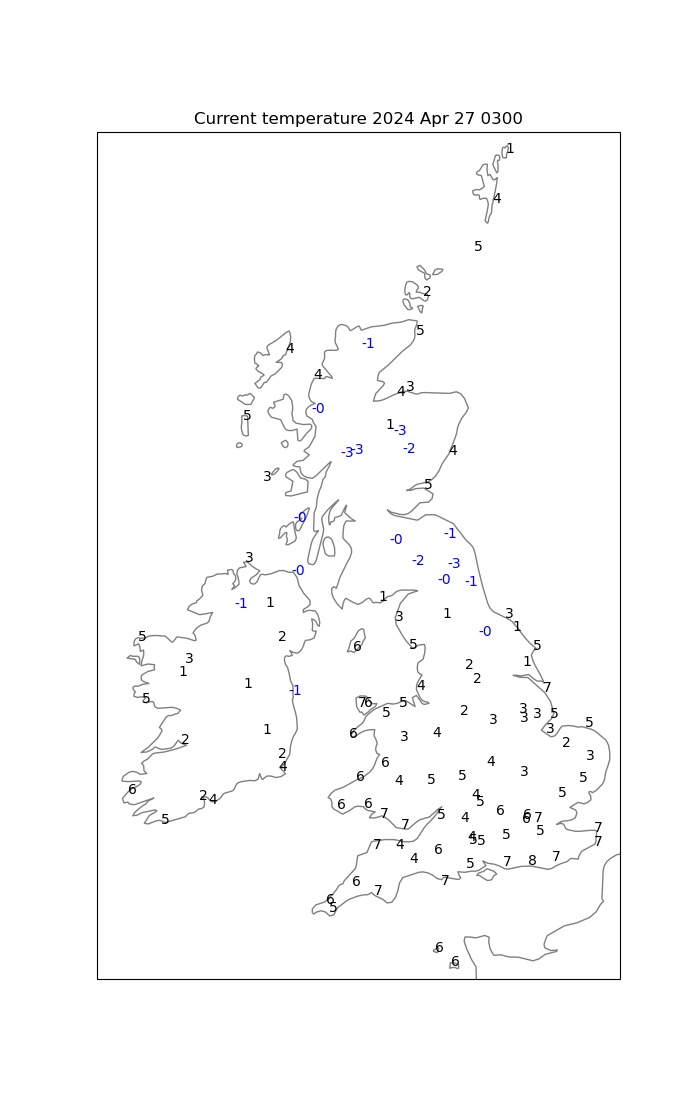
| Air temperature (time shown UTC)
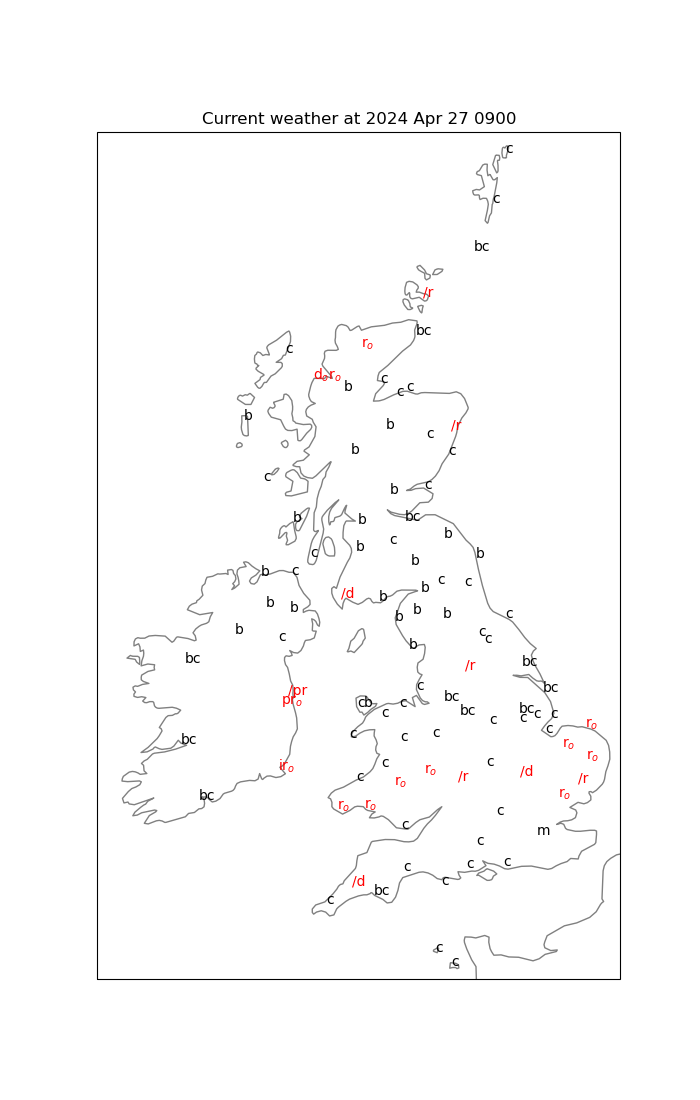
| Weather (time shown UTC)
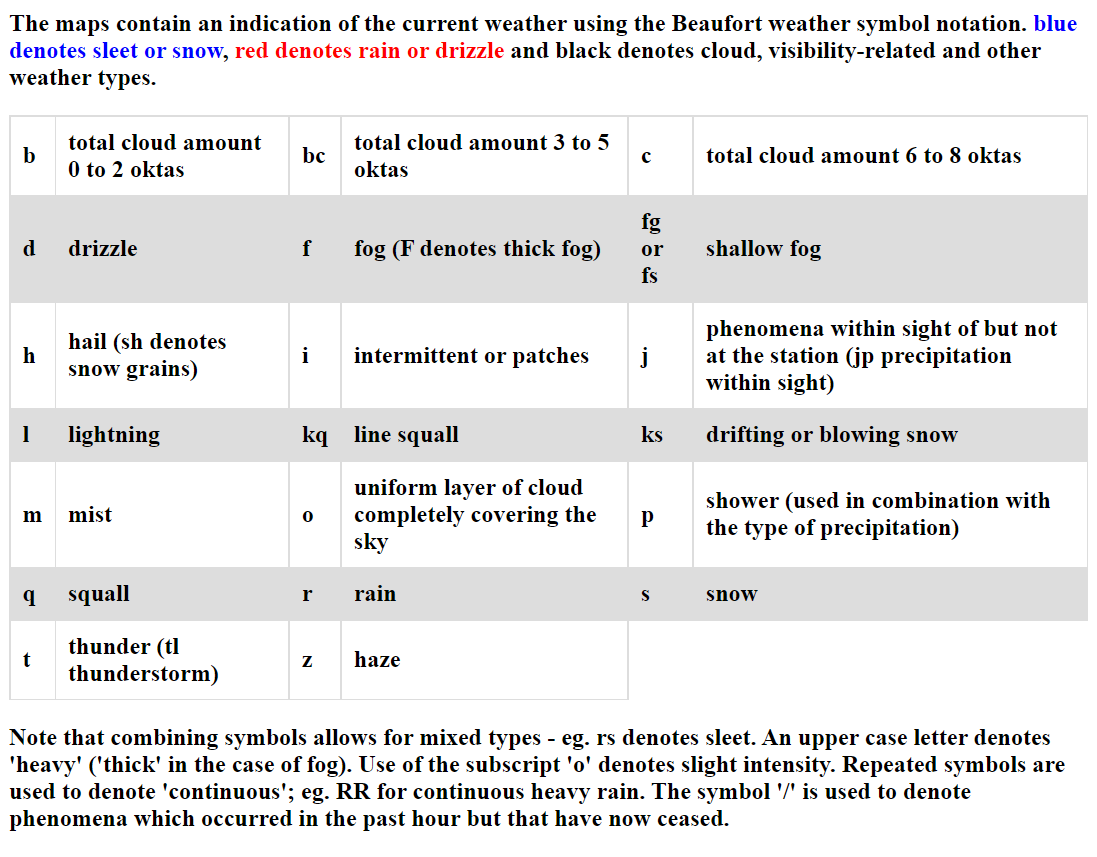
| Weather decoder
|
|
|
|
| |
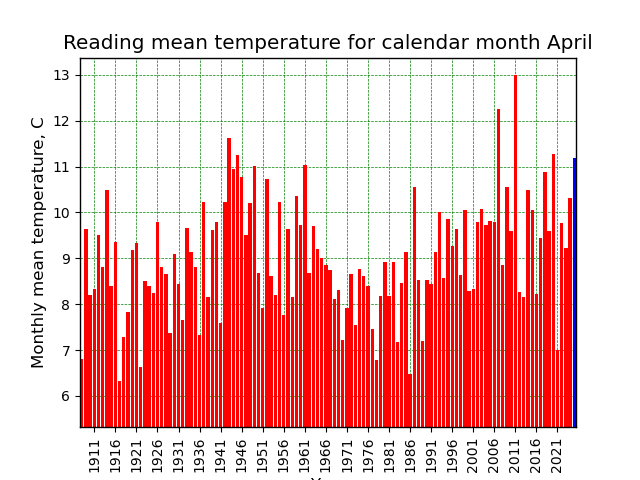
Some past statistics for this calendar month and season can be seen
here.
|
| Monthly mean air temperature
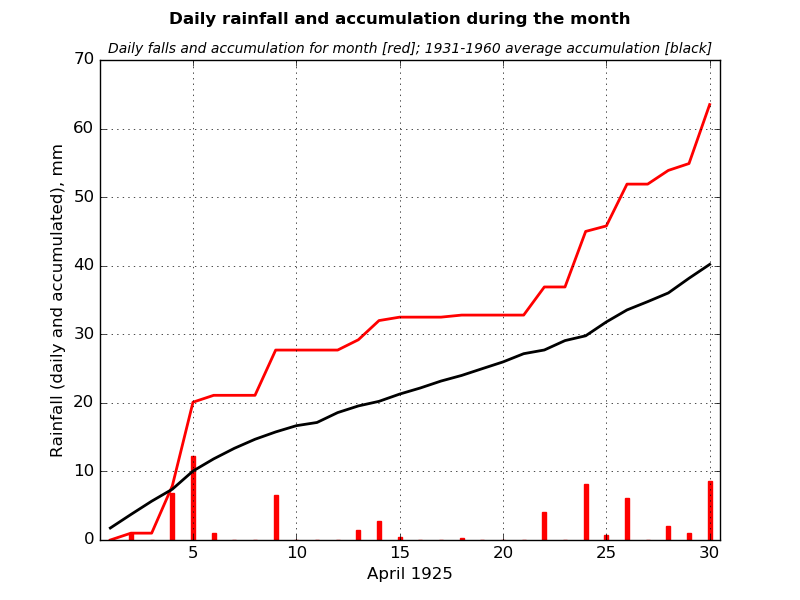
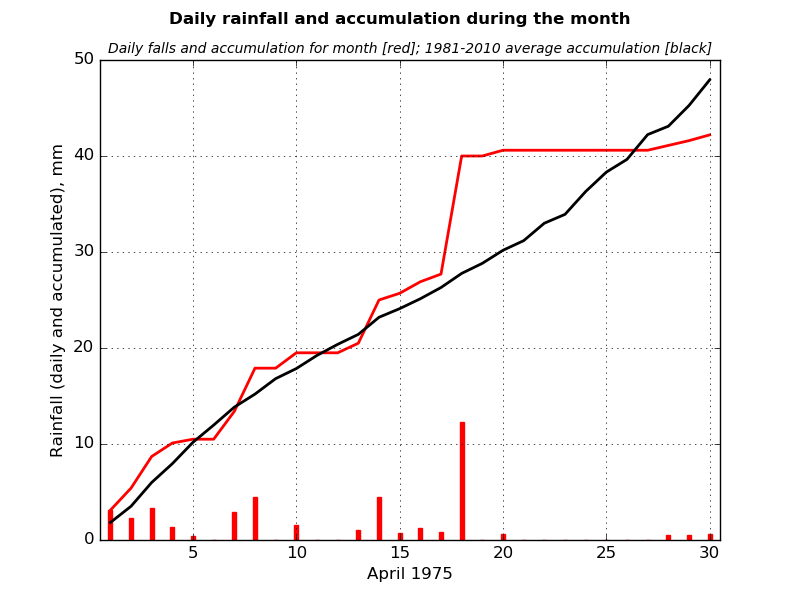
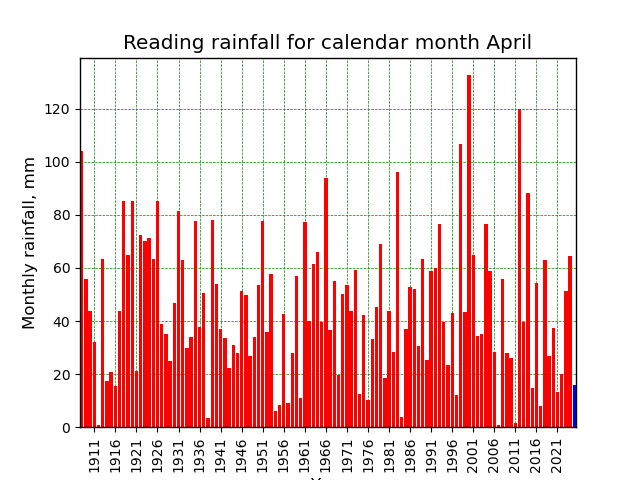
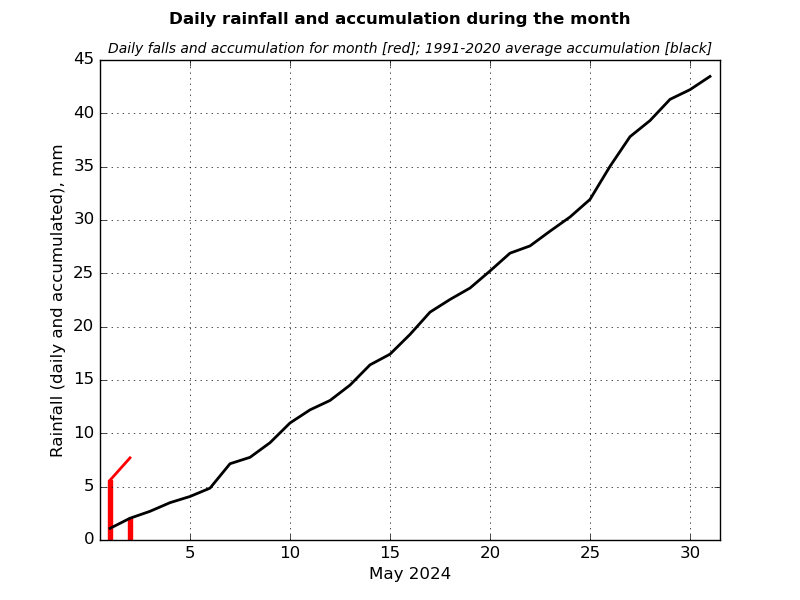
| Rainfall totals
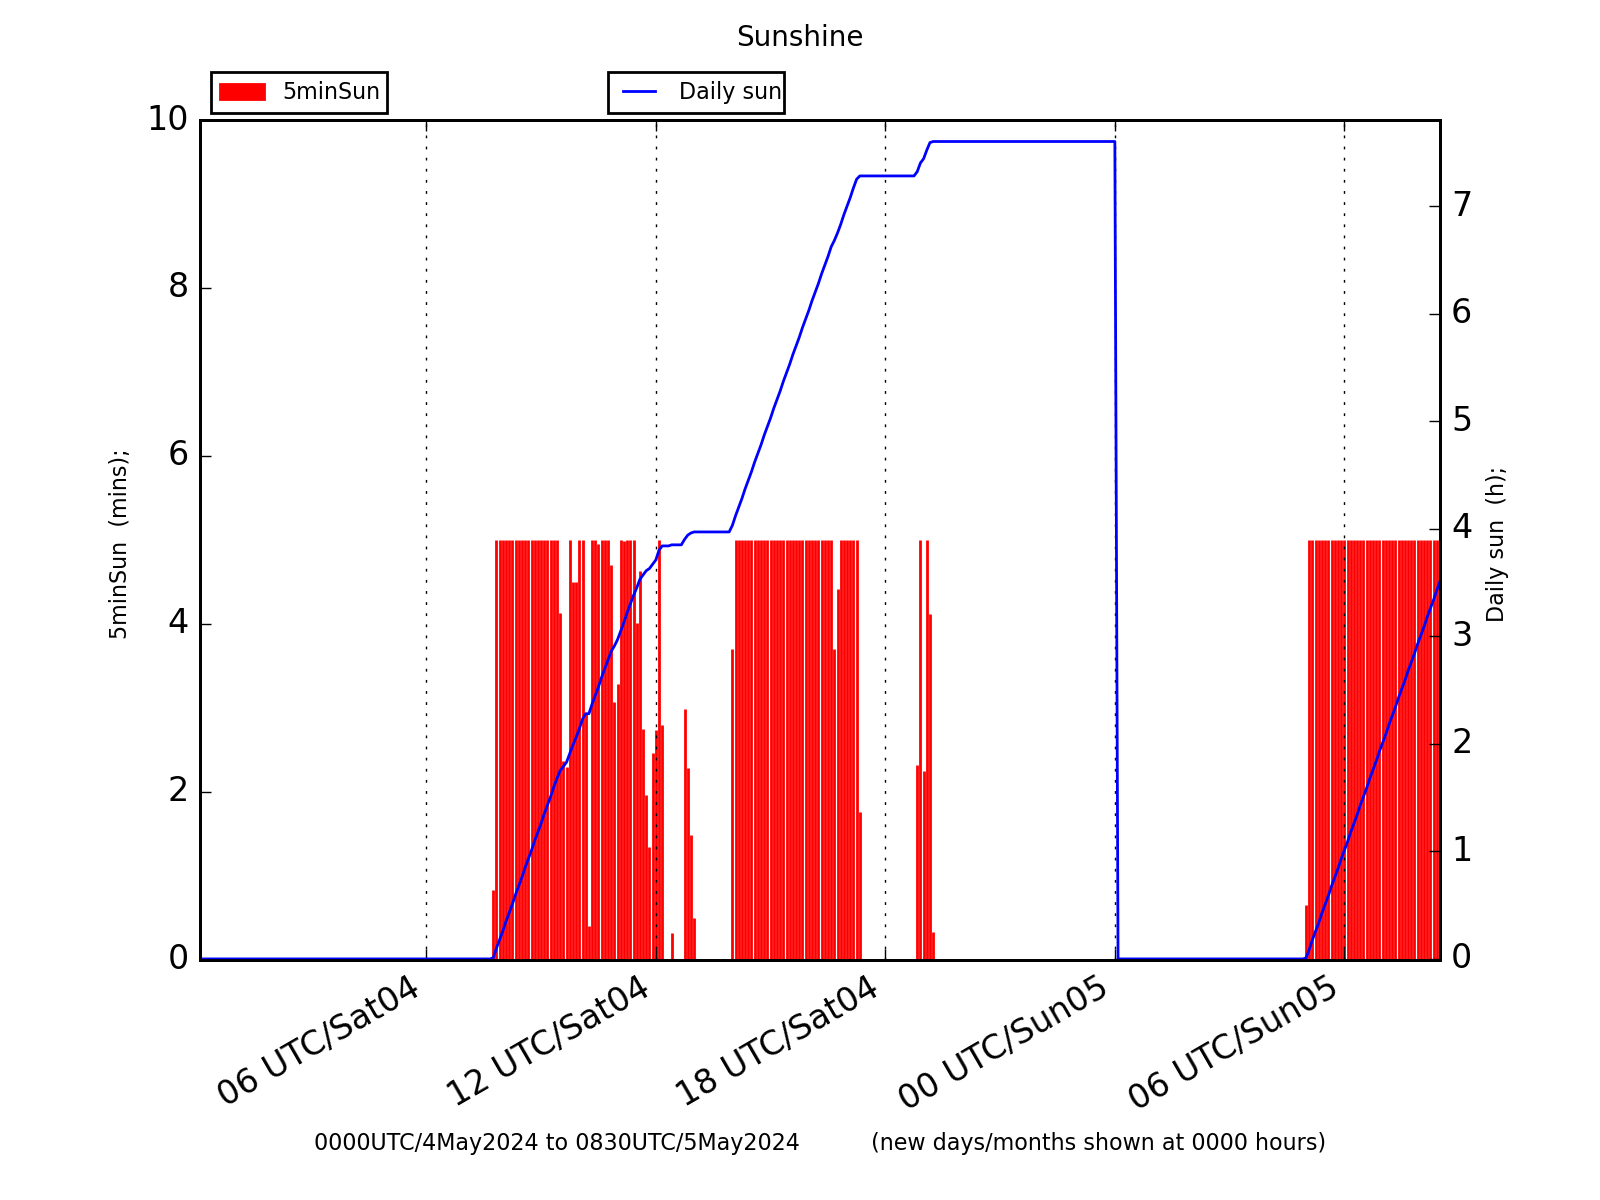
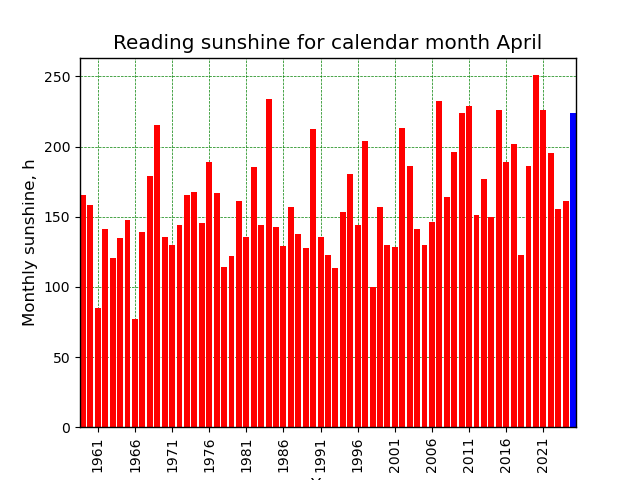
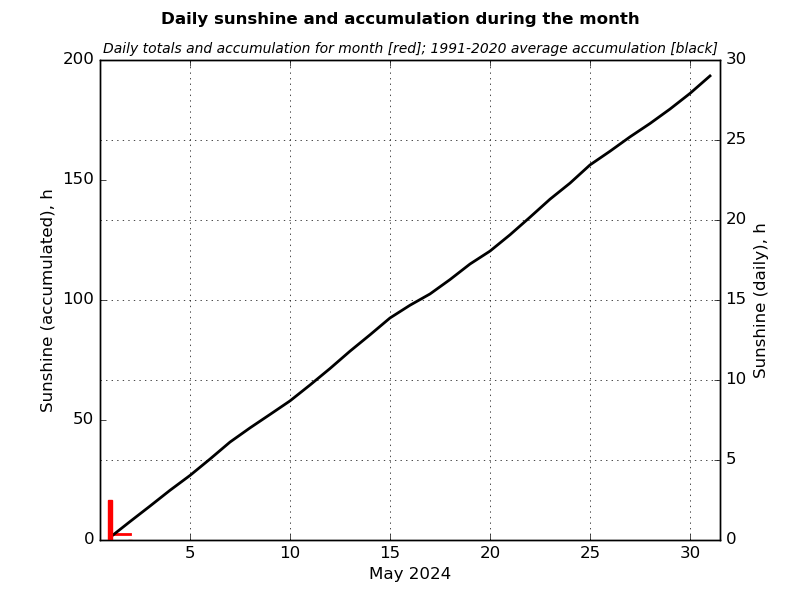
| Sunshine totals
|
|
|
|
| |
Note that in 1968 the site moved away from the slightly warmer town centre; blue denotes the current month so far
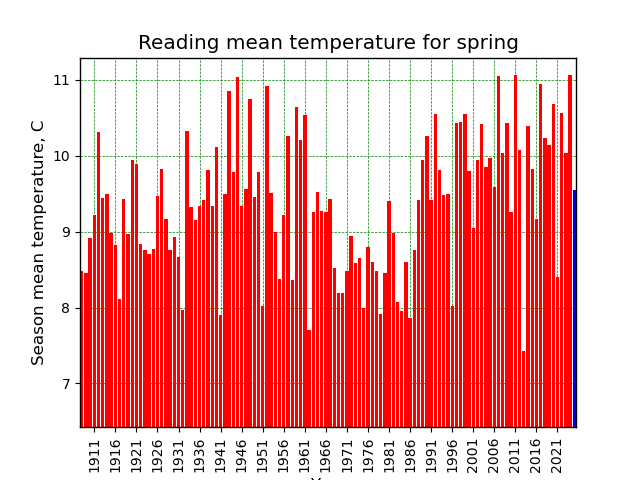
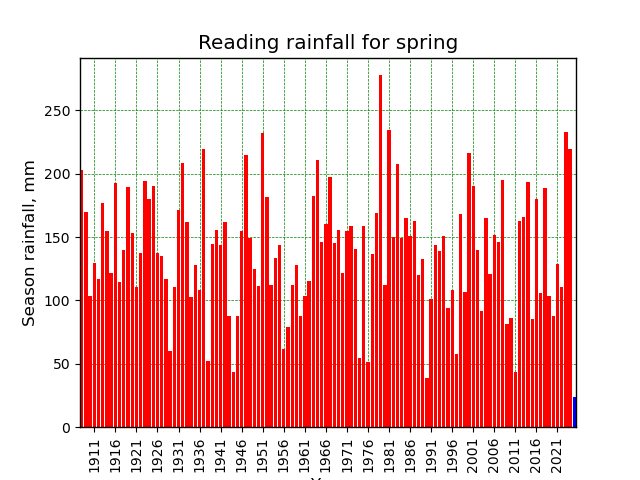
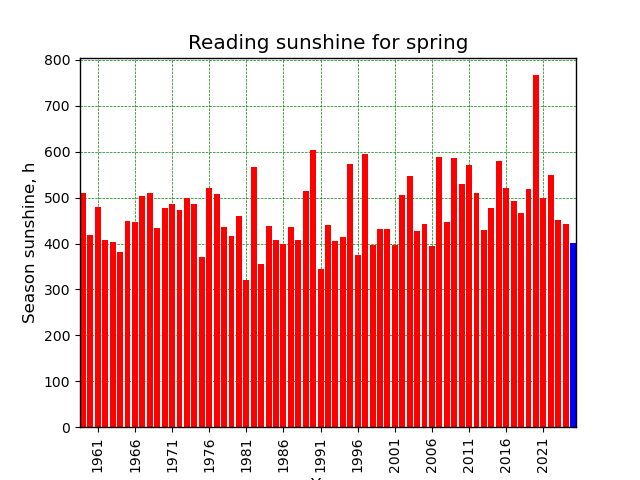
How does this season compare with past seasons?
|
| Seasonal mean air temperature
| Rainfall totals
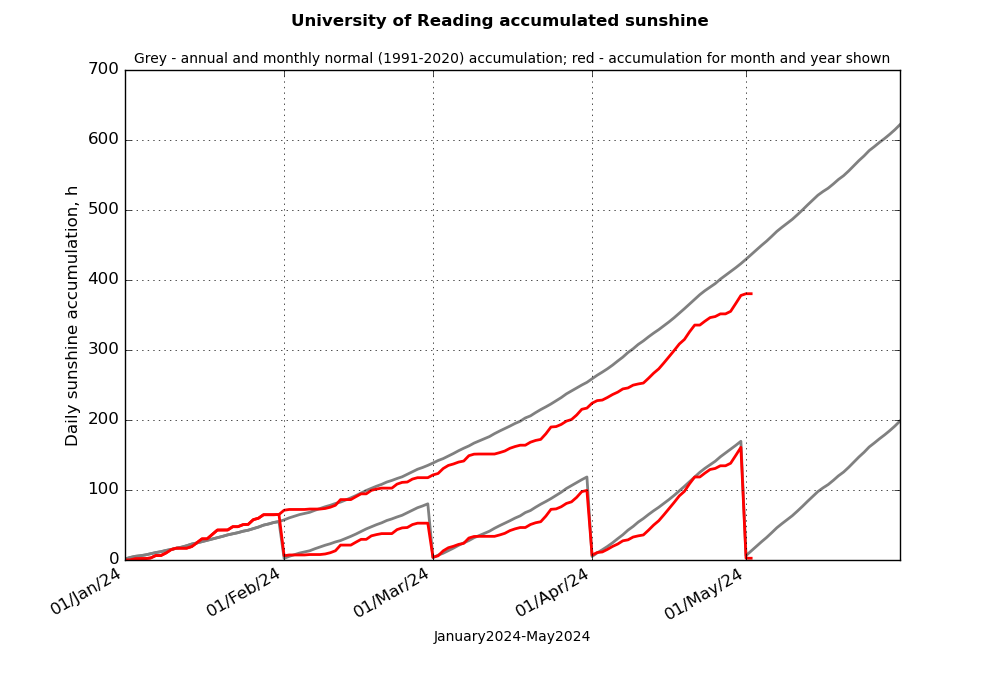
| Sunshine totals
|
|
|
|
| |
Note that in 1968 the site moved away from the slightly warmer town centre; blue denotes the current season so far
|
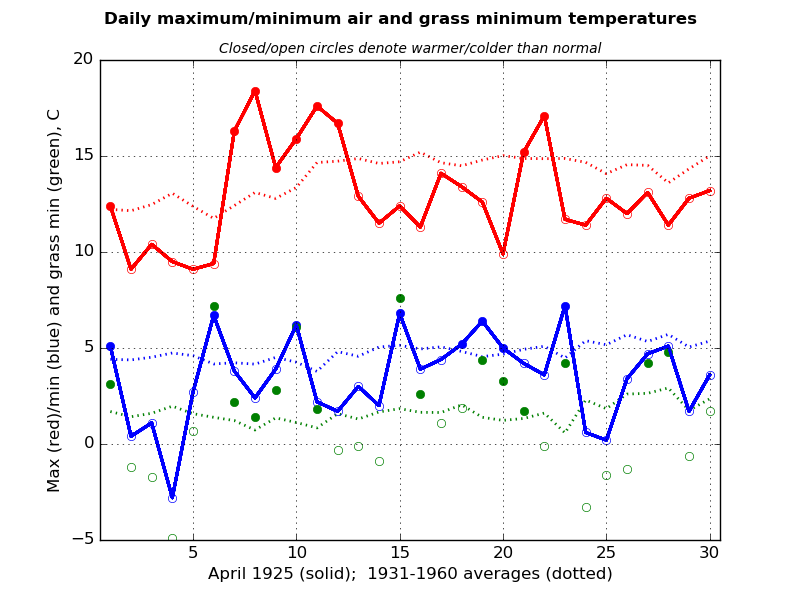
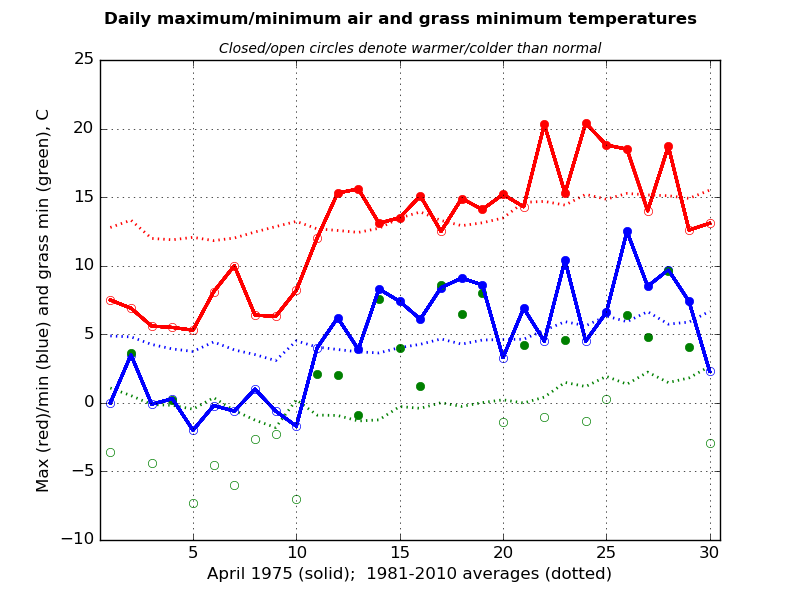
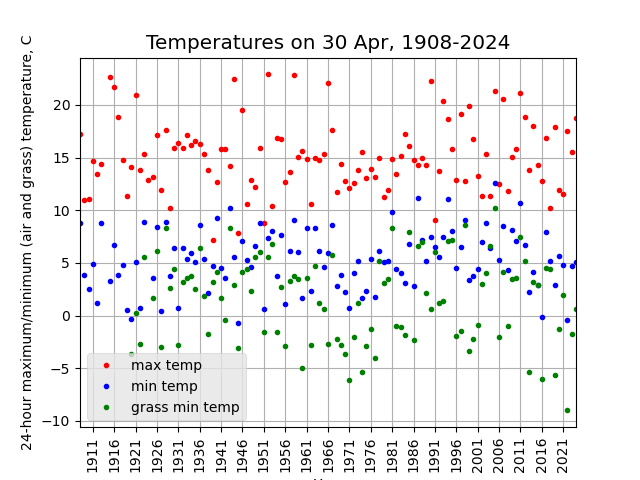
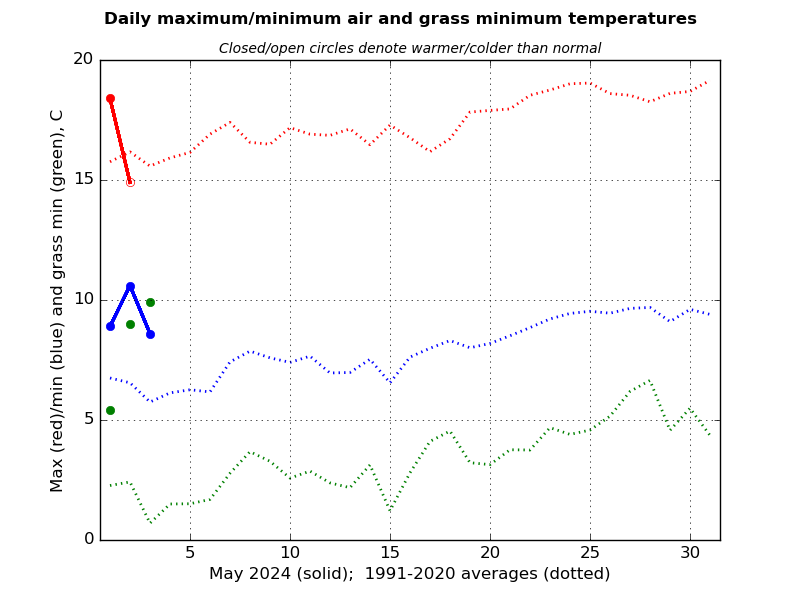
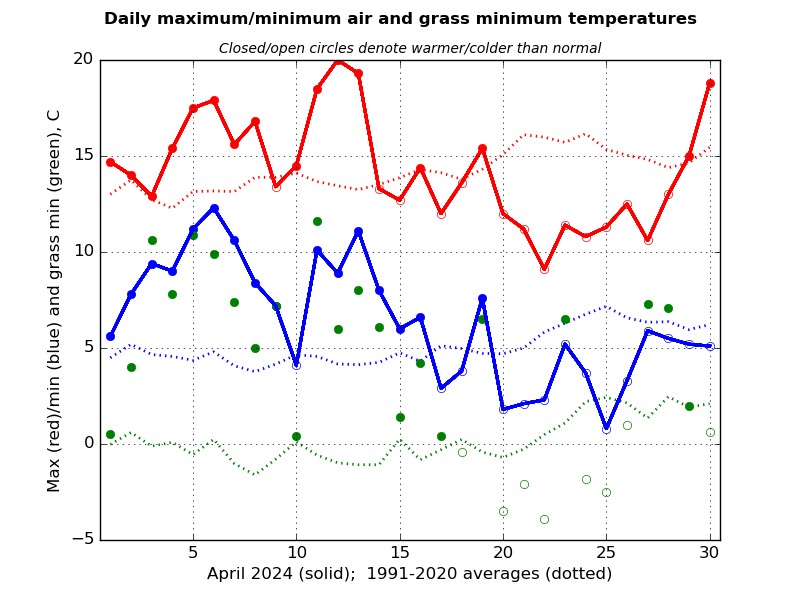
| Air/grass temperature extremes
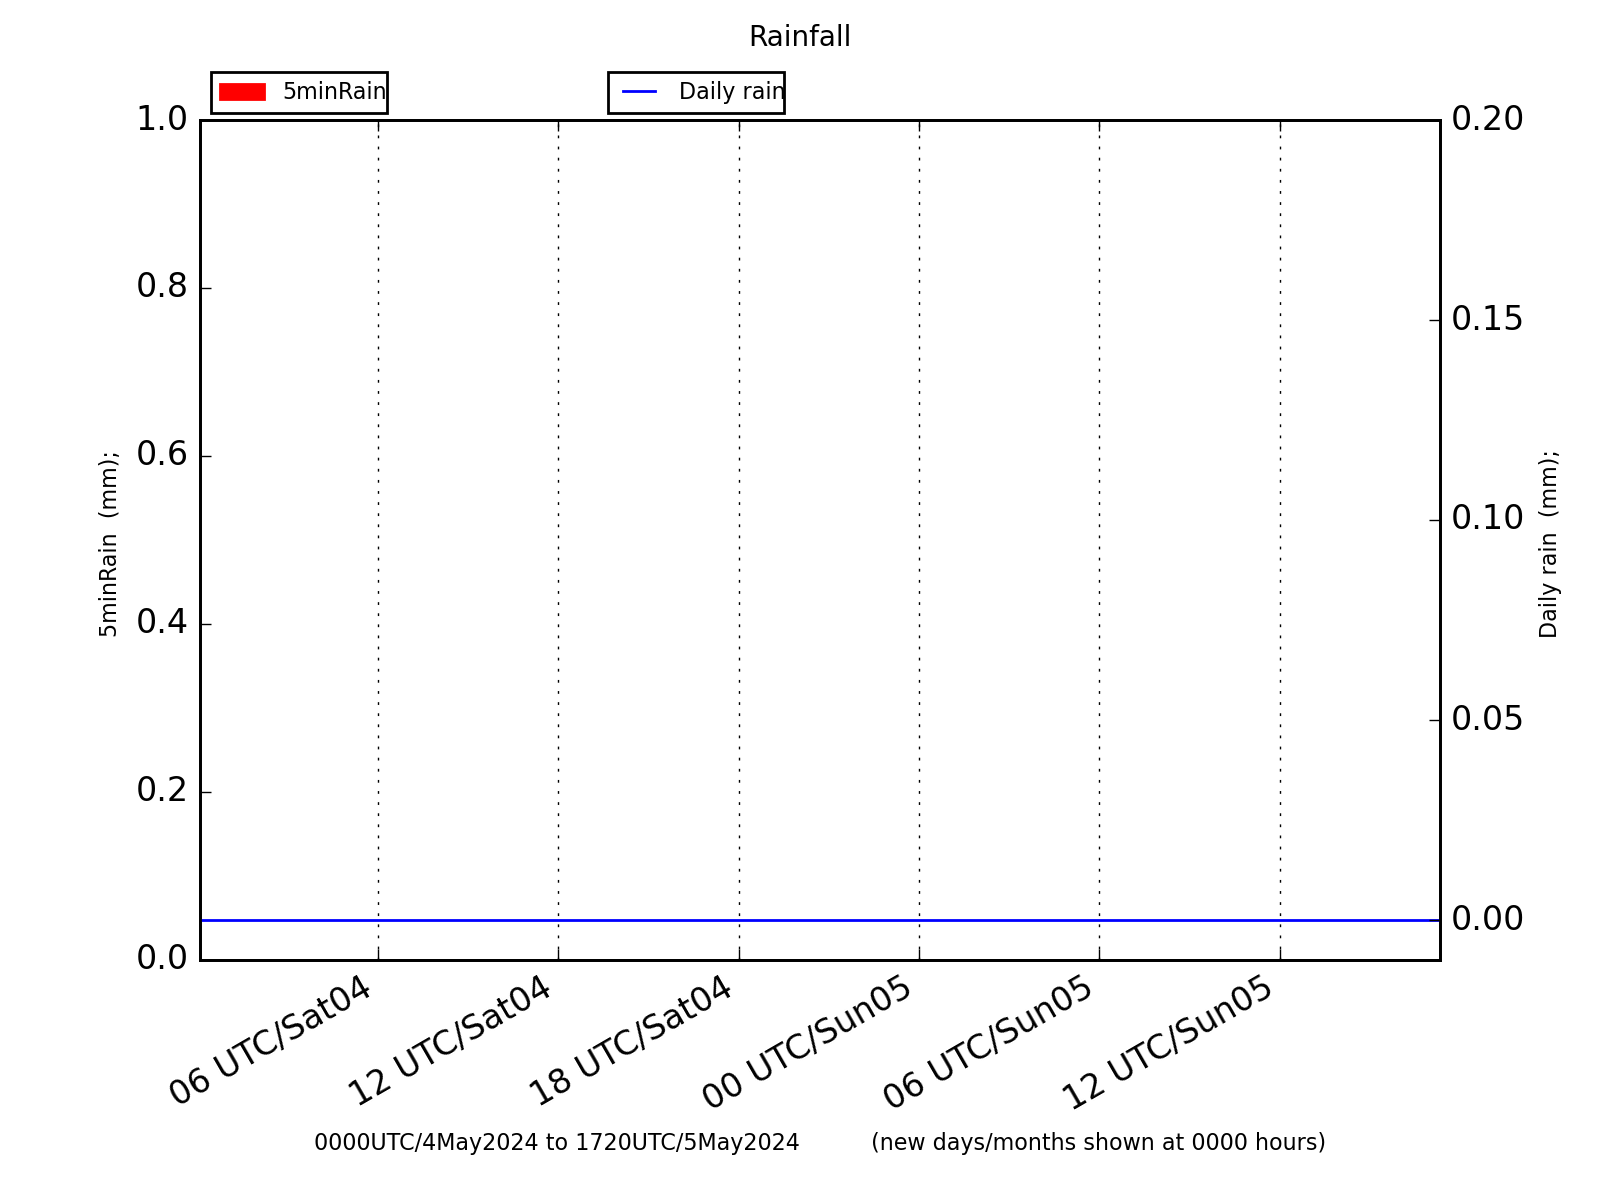
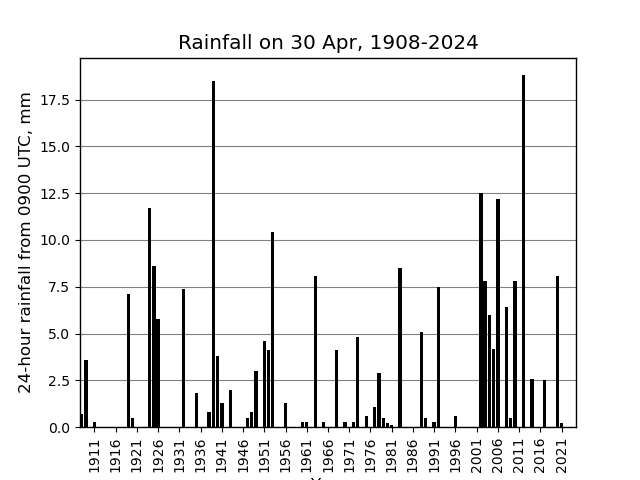
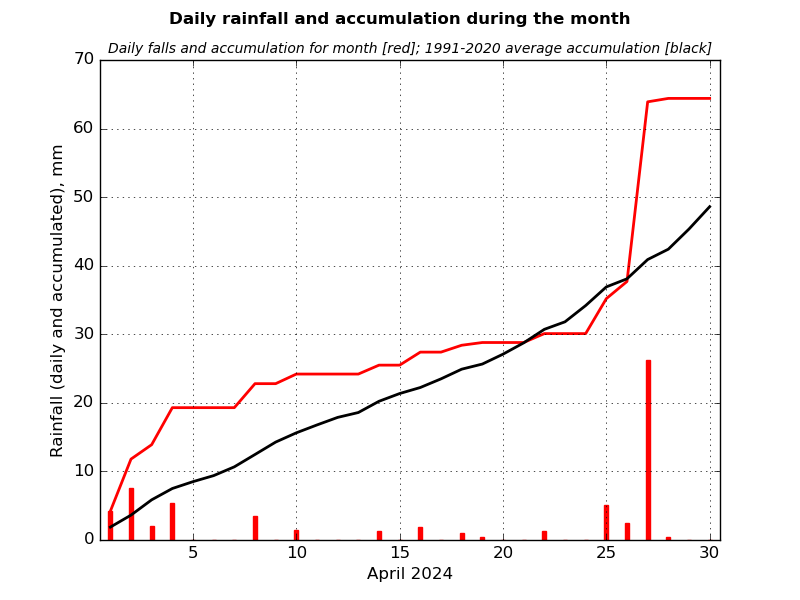
| Rainfall
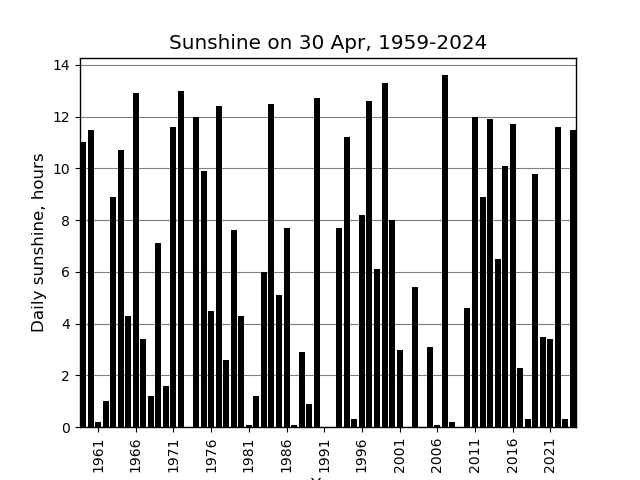
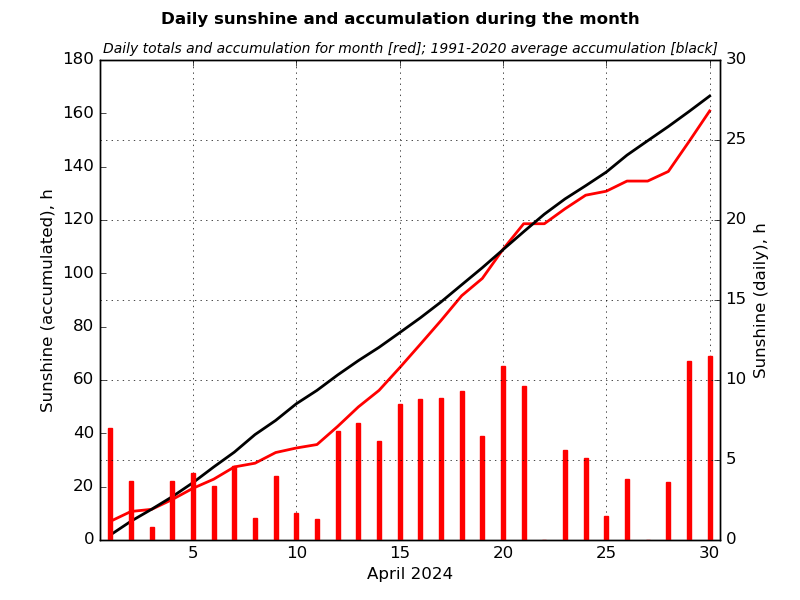
| Sunshine
|
|
|
|
| |
Note that in 1968 the site moved away from the town centre, so slightly lower grass minima tended to occur thereafter
|
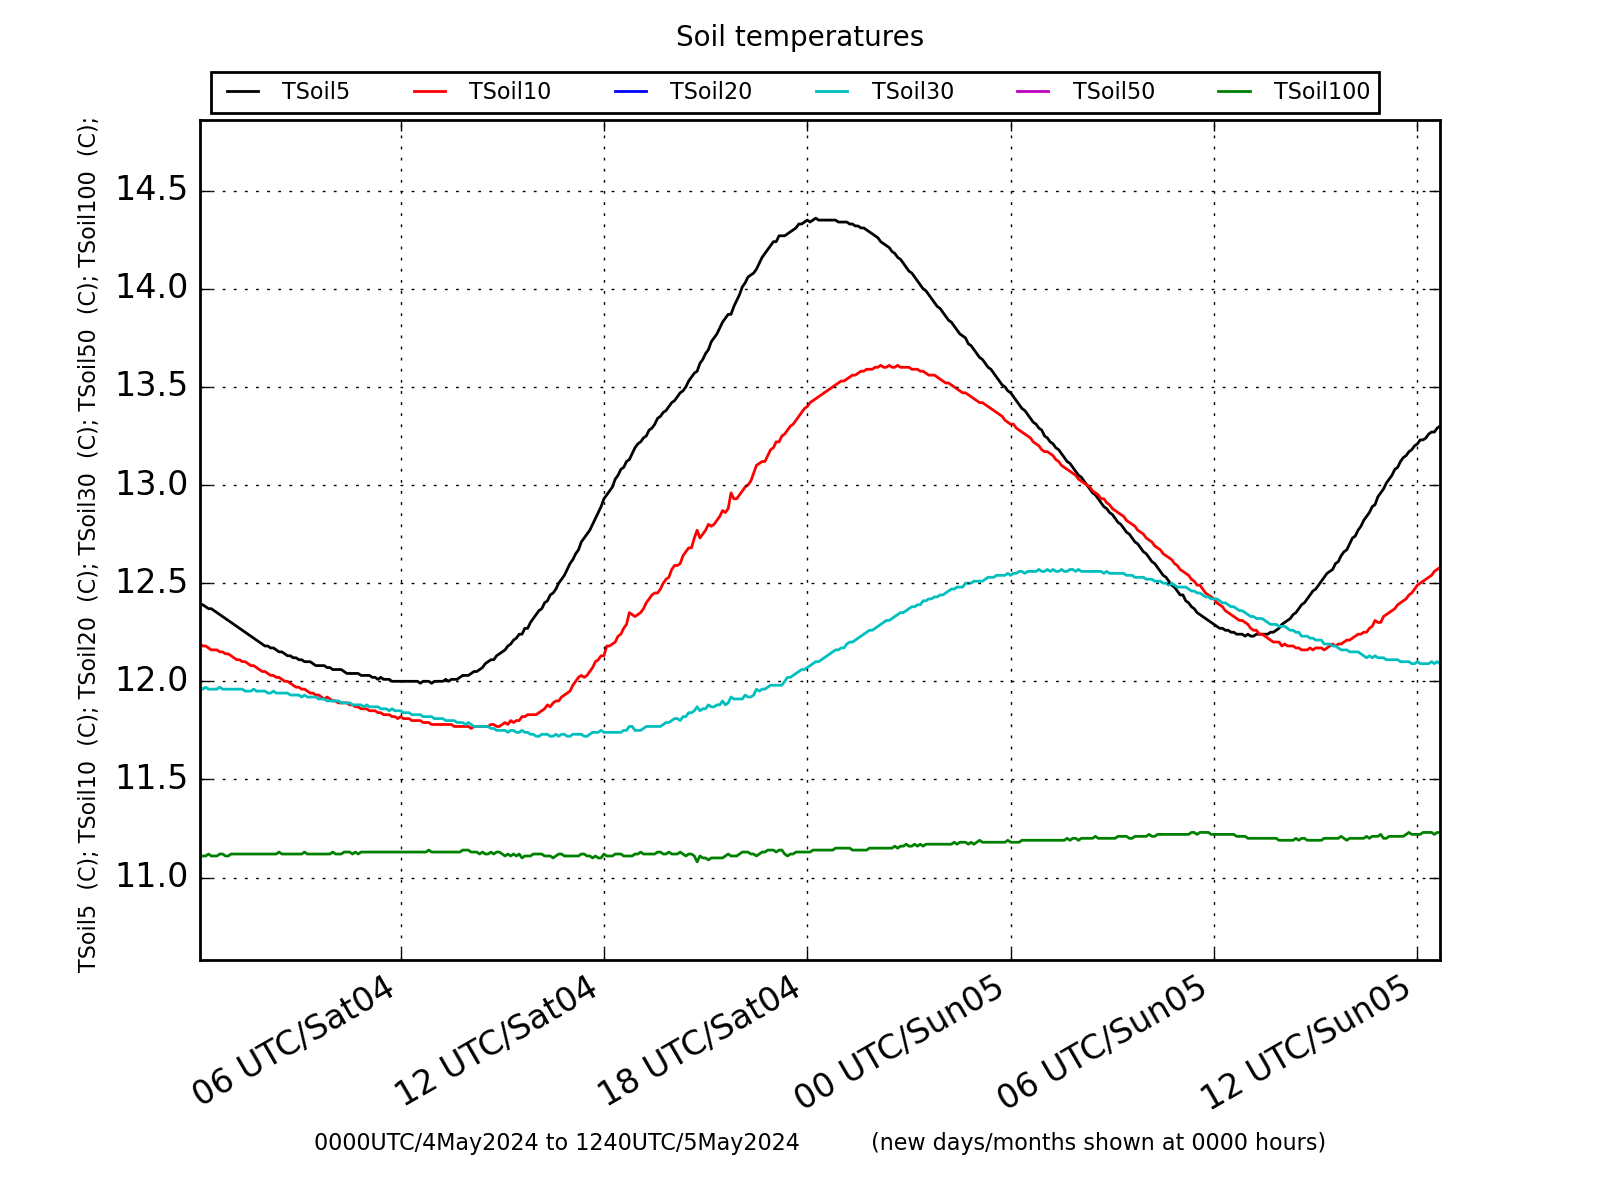
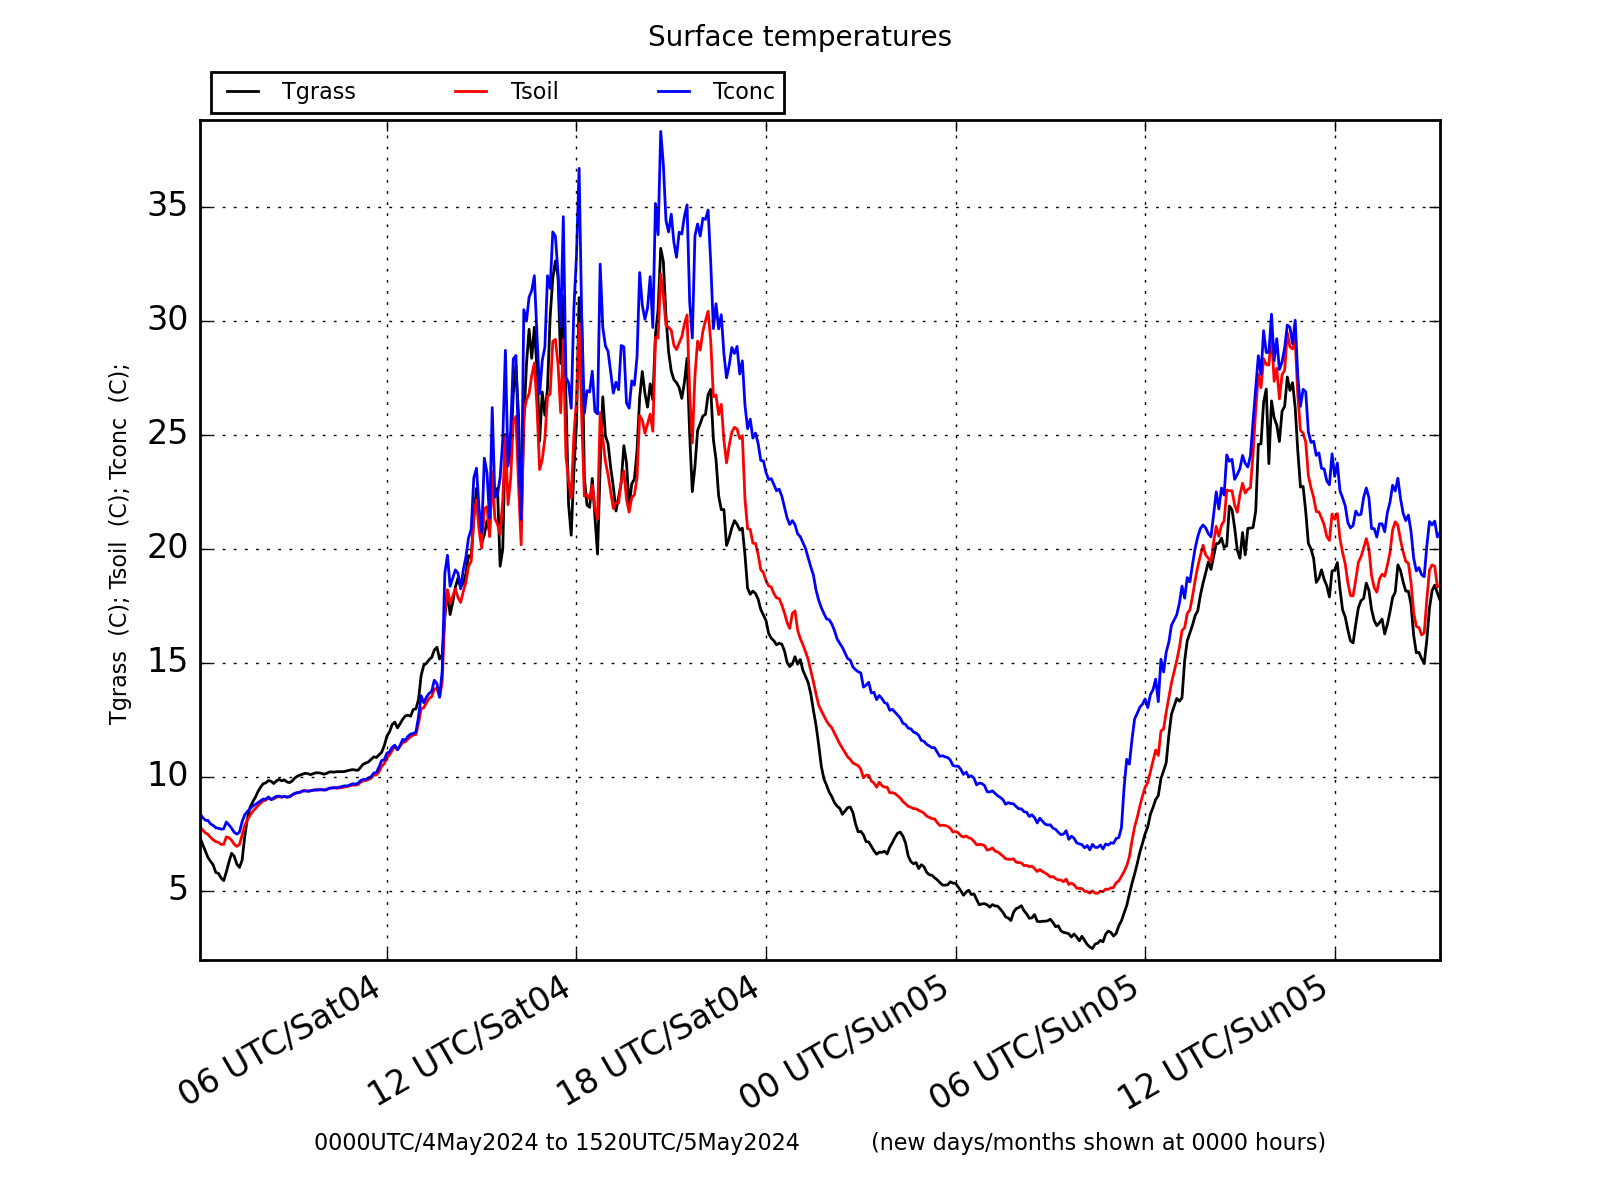
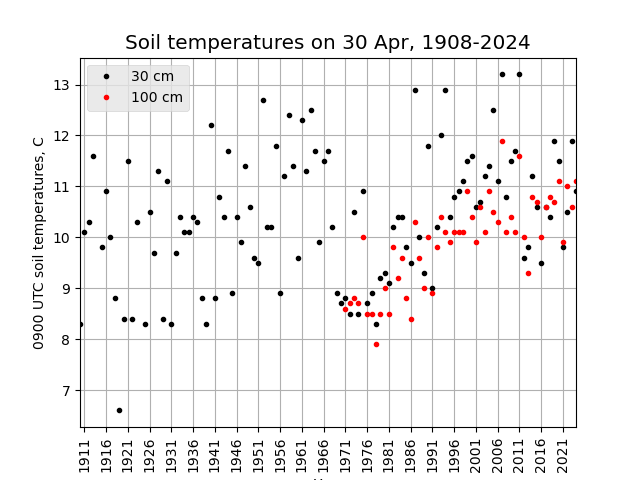
| Soil temperatures
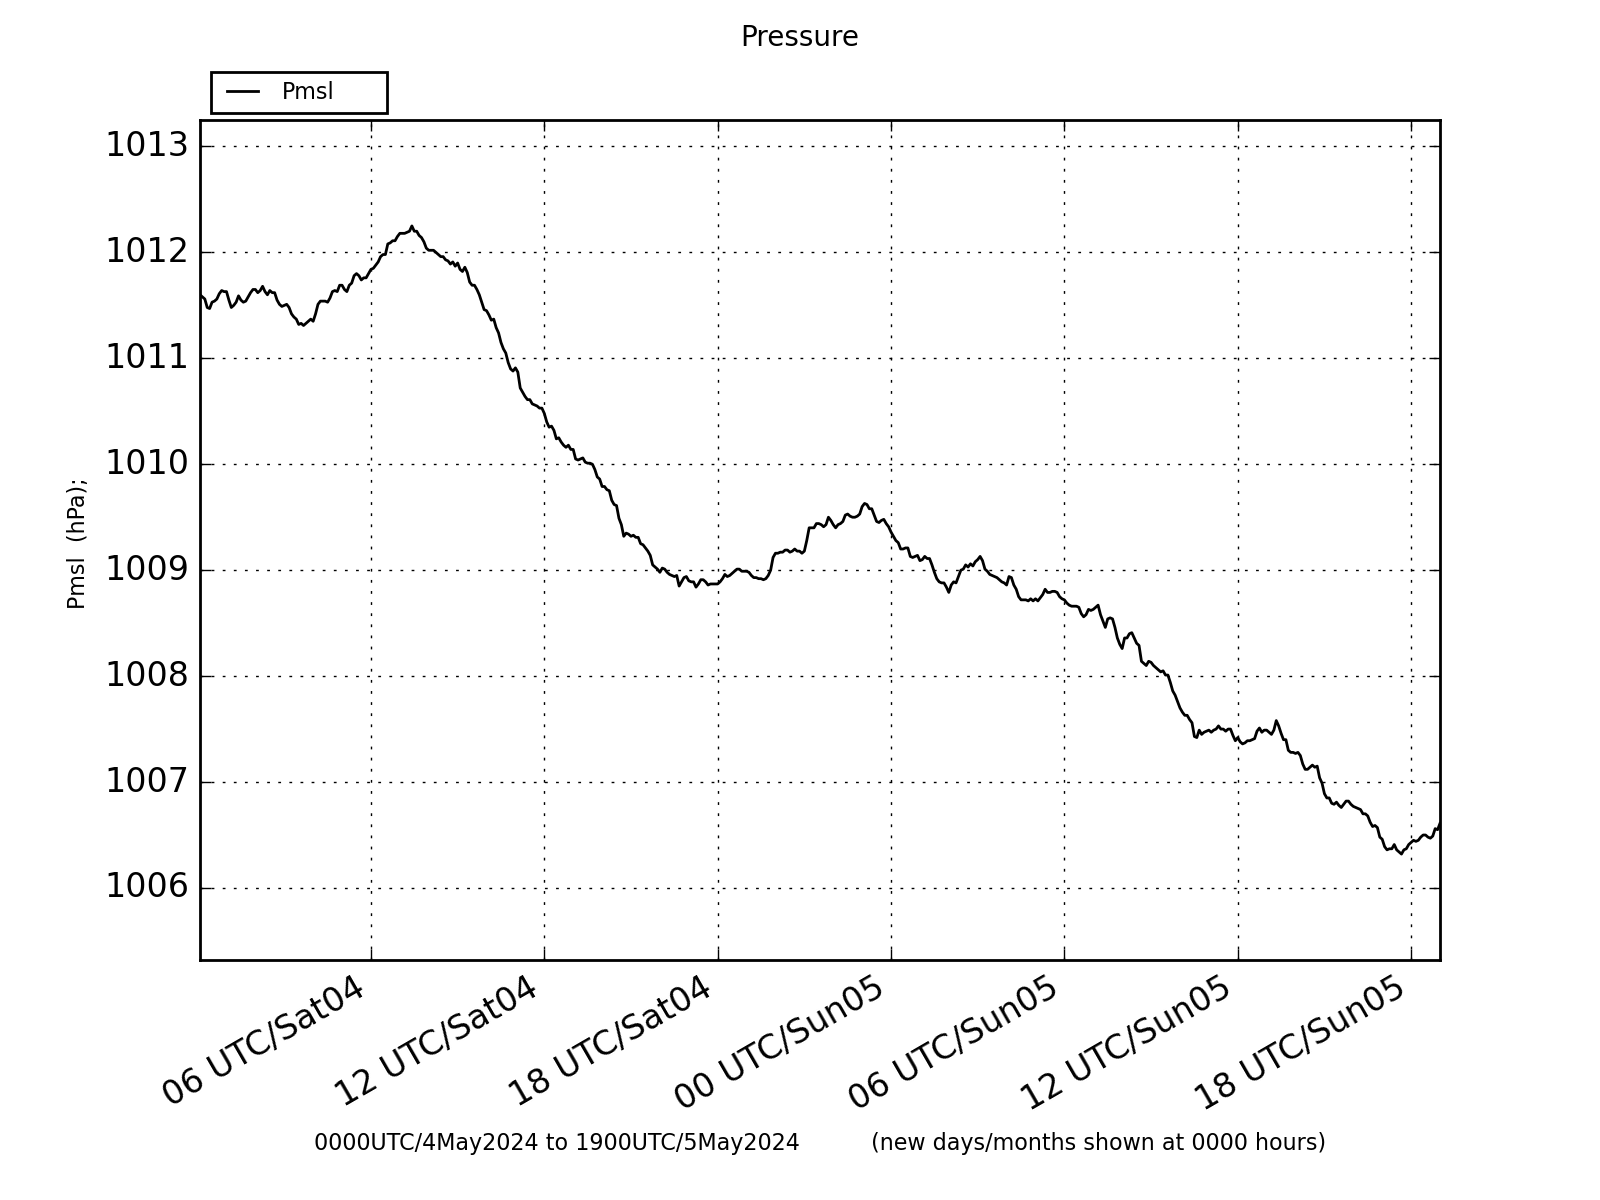
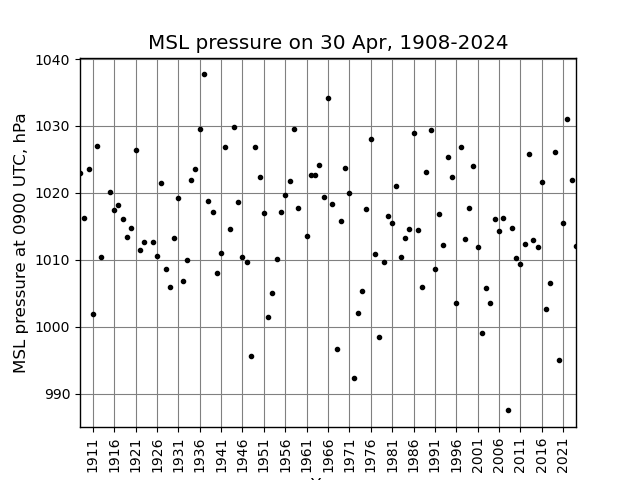
| Air pressure
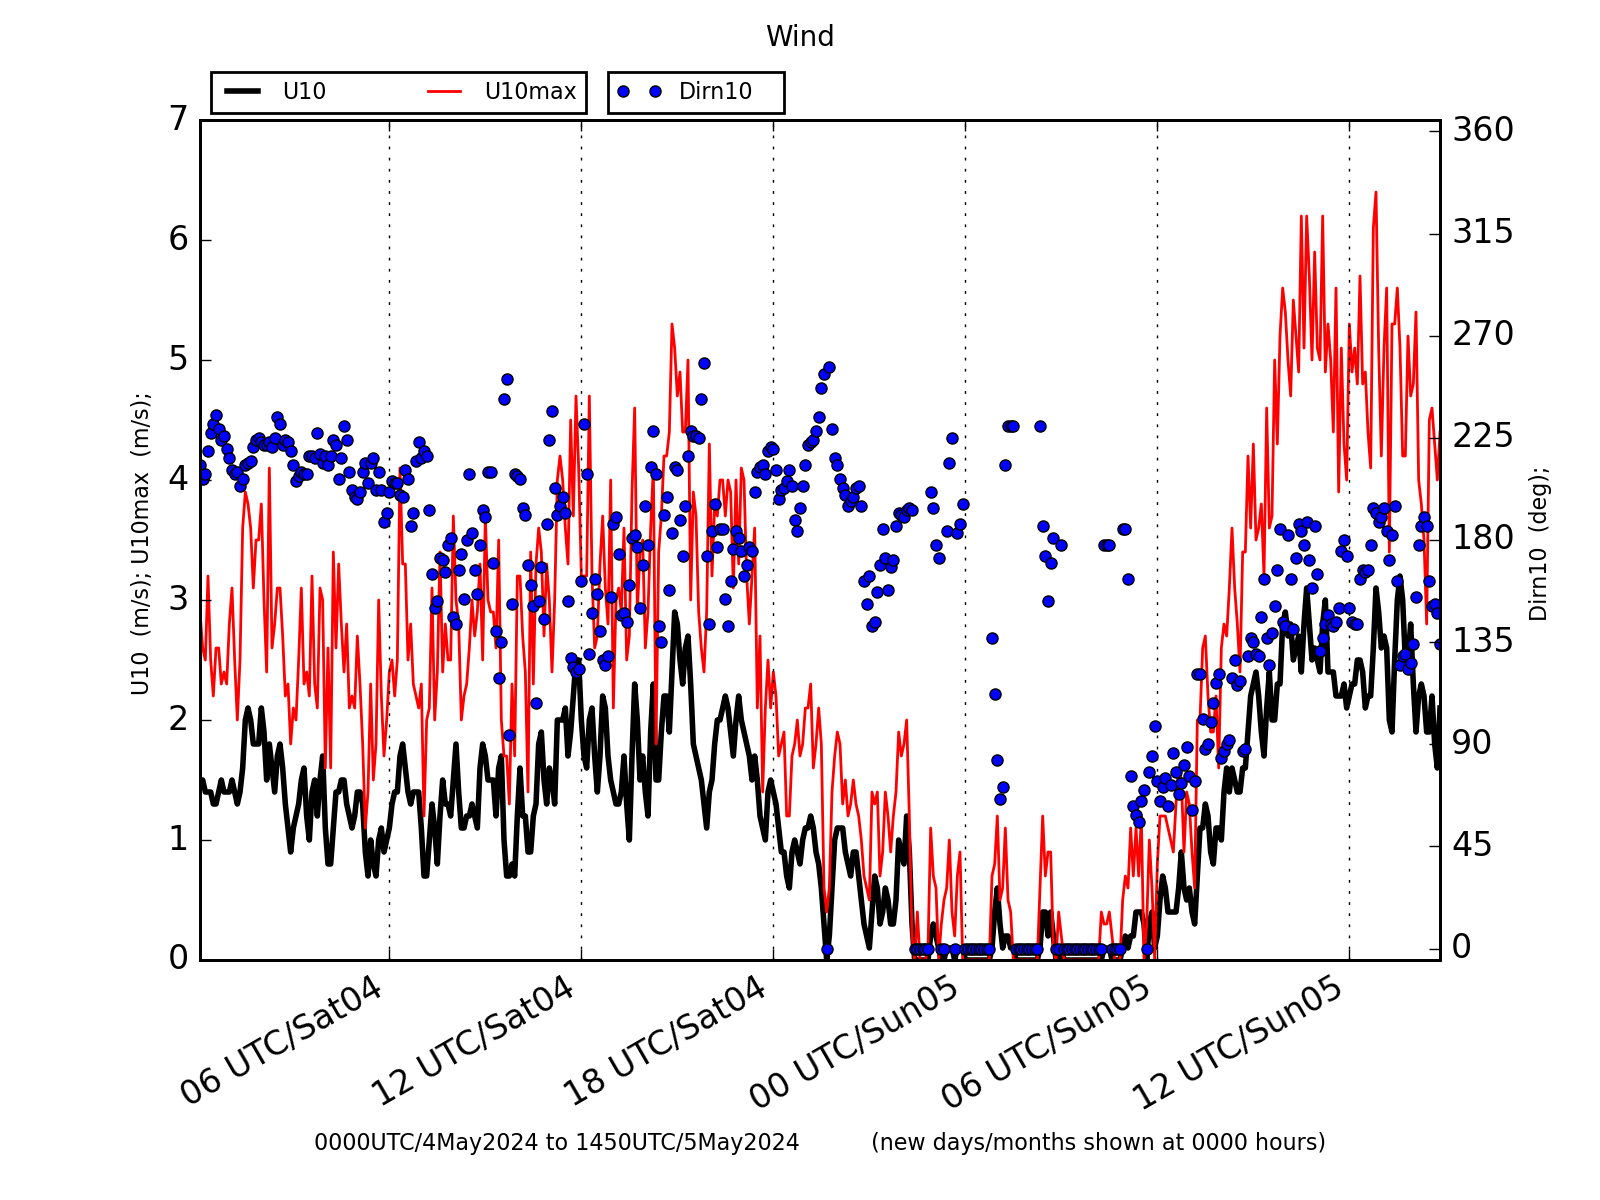
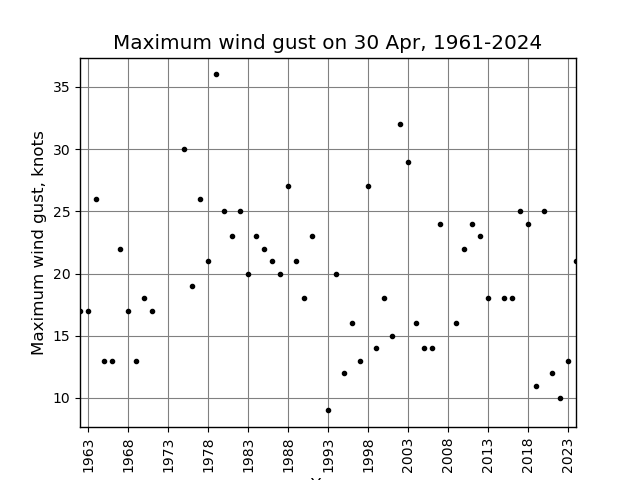
| Wind gust
|
|
|
|
| |
|
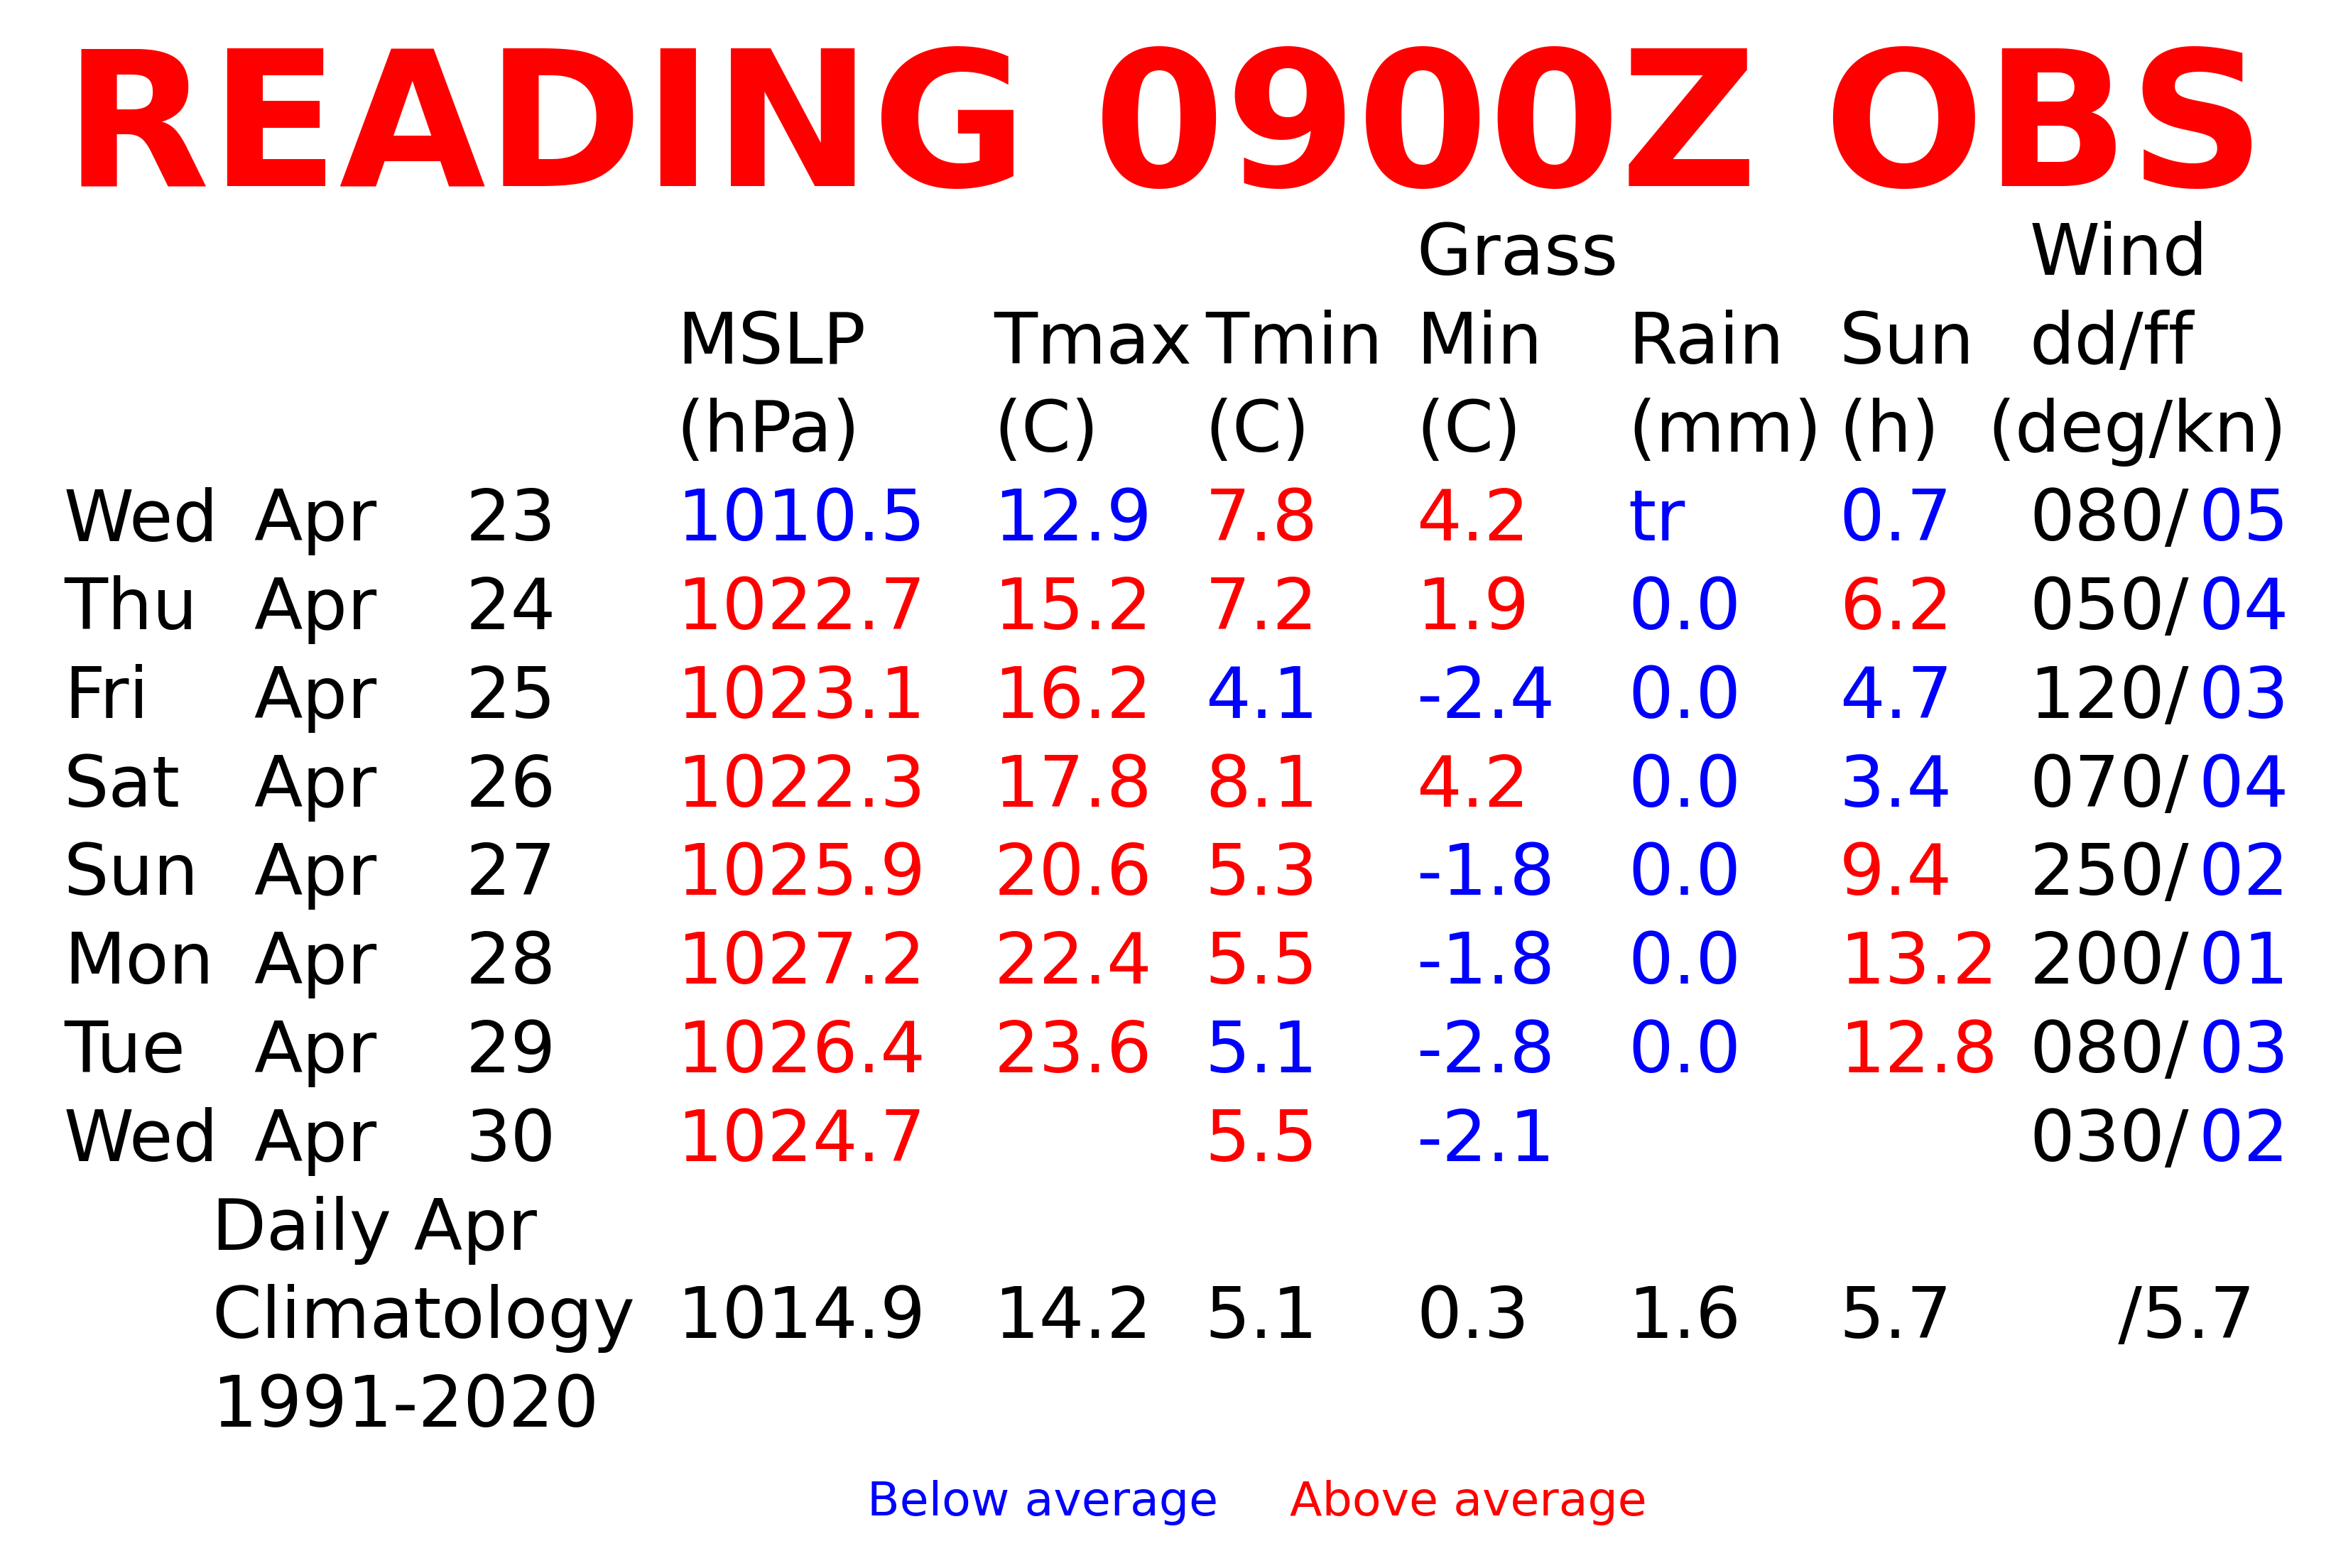
| The 'traditional' one
|
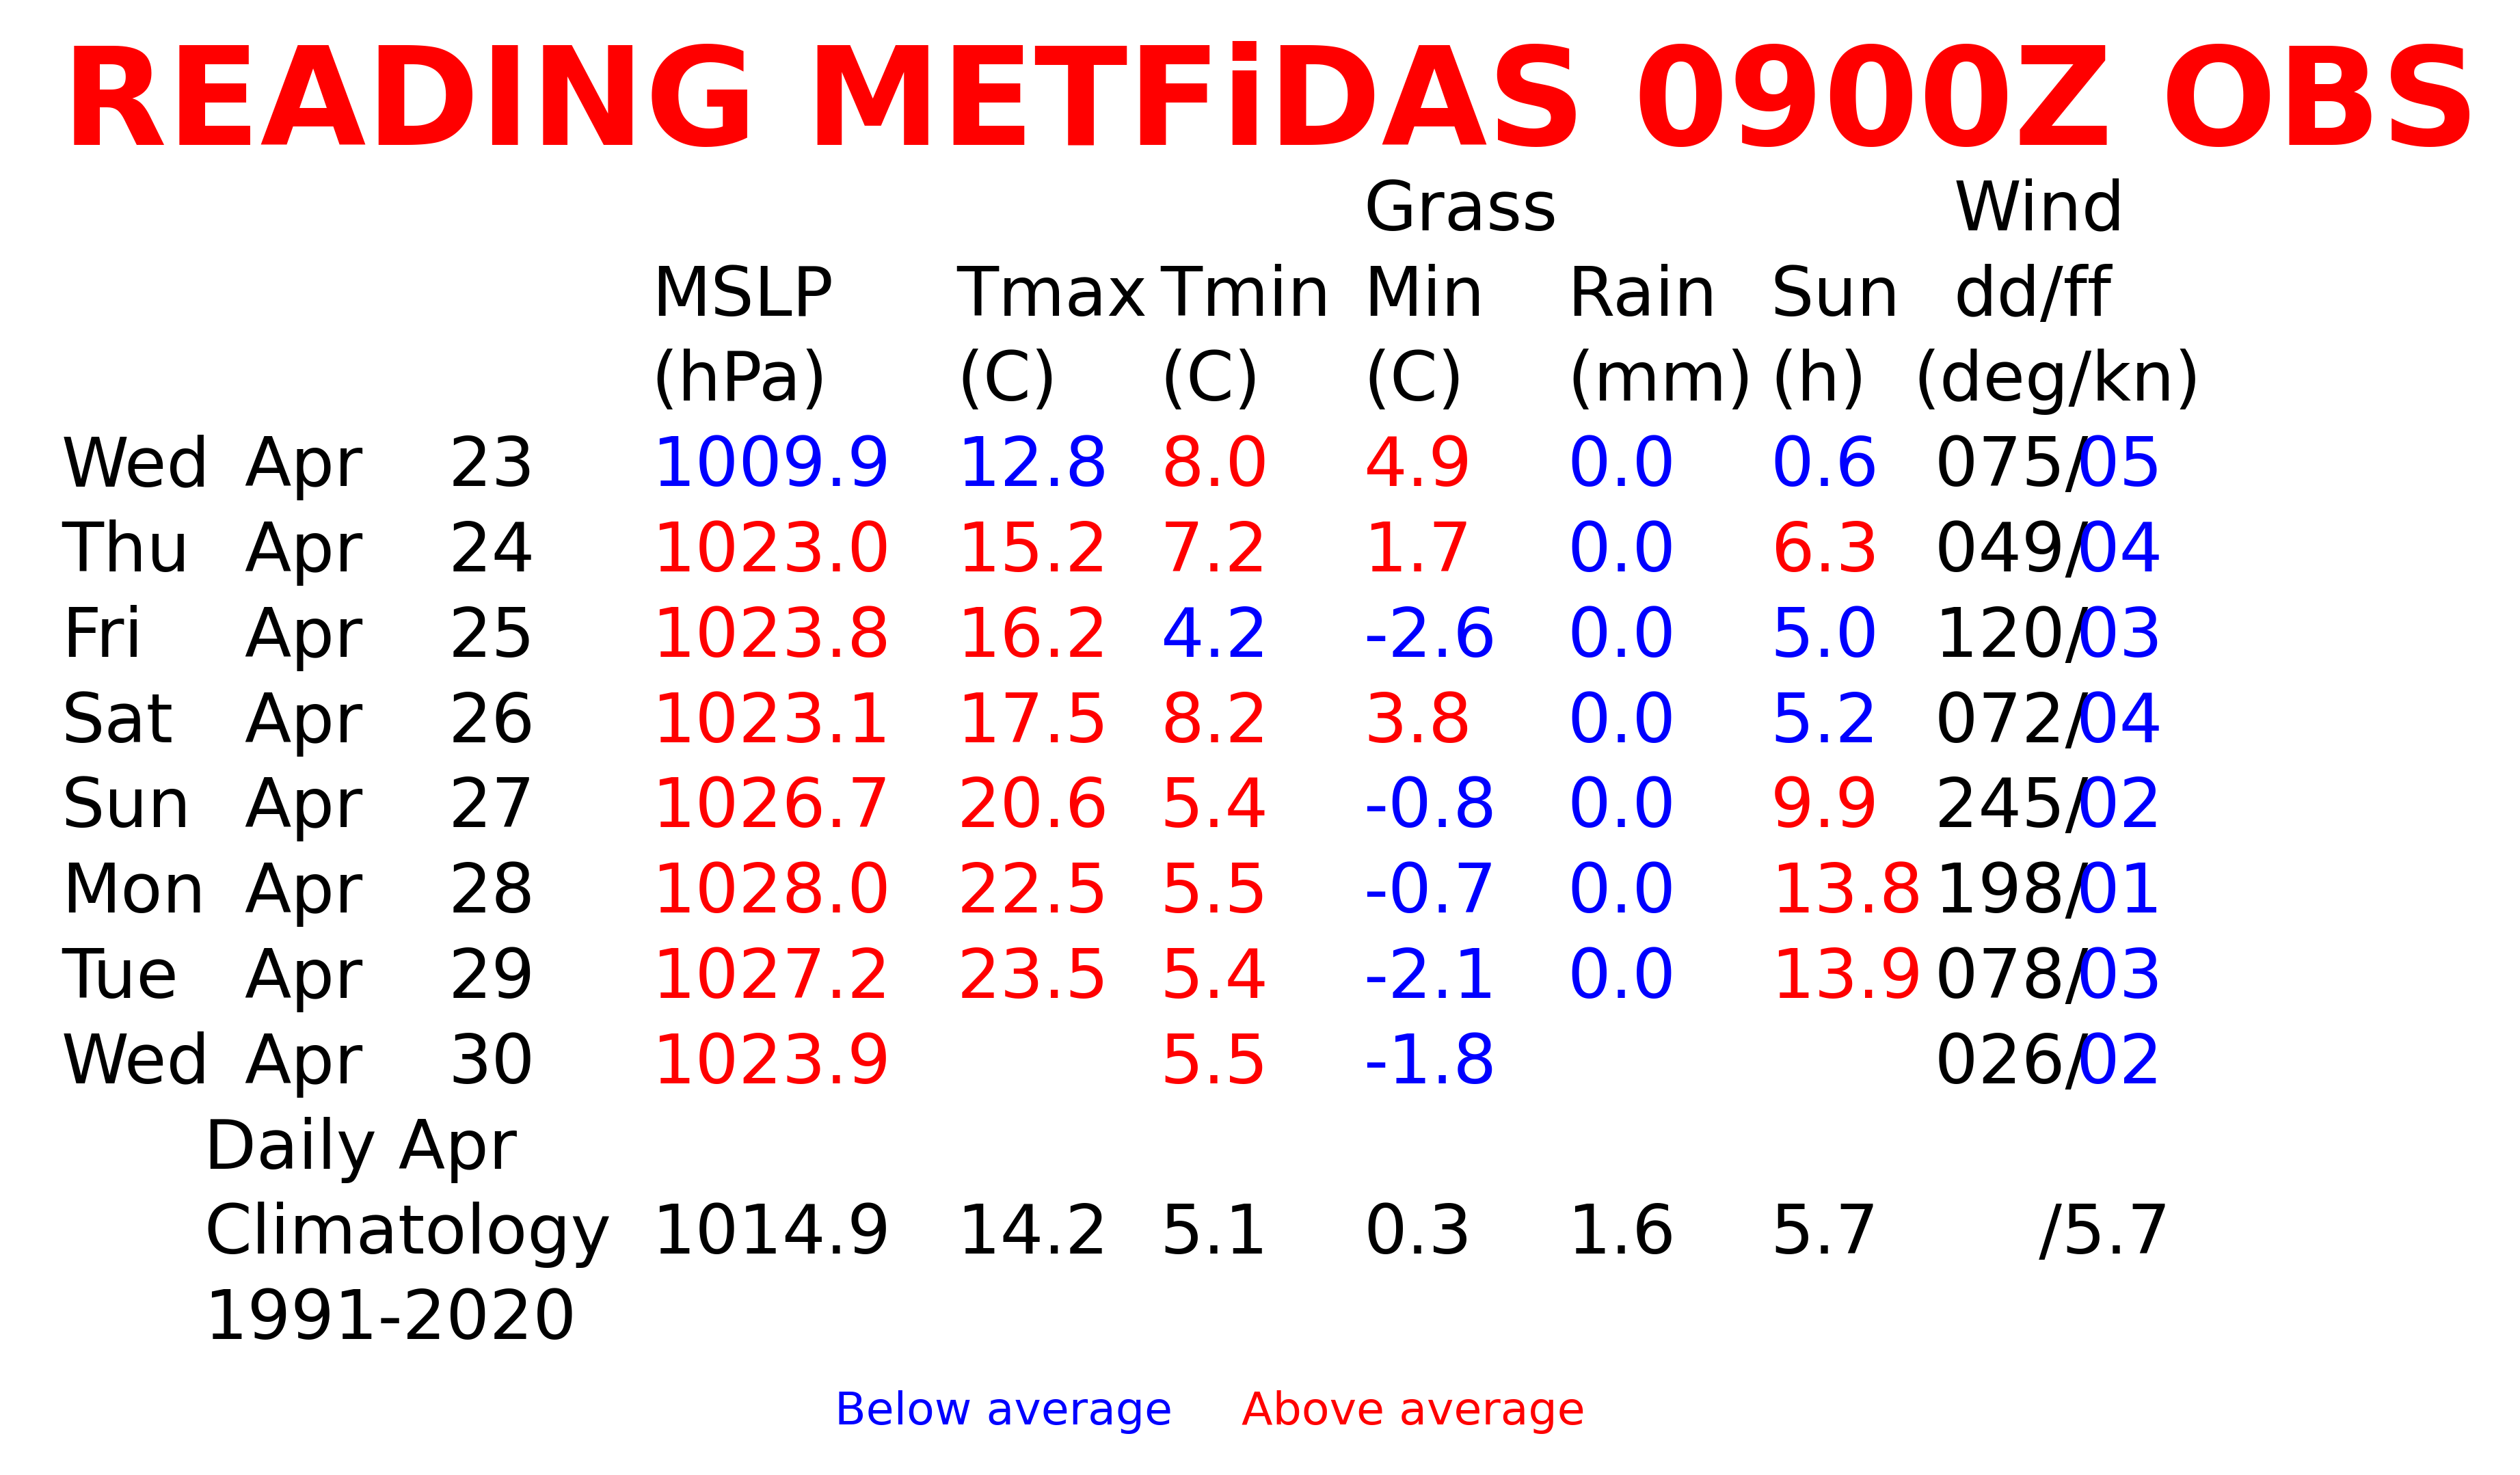
| The METFiDAS version
|
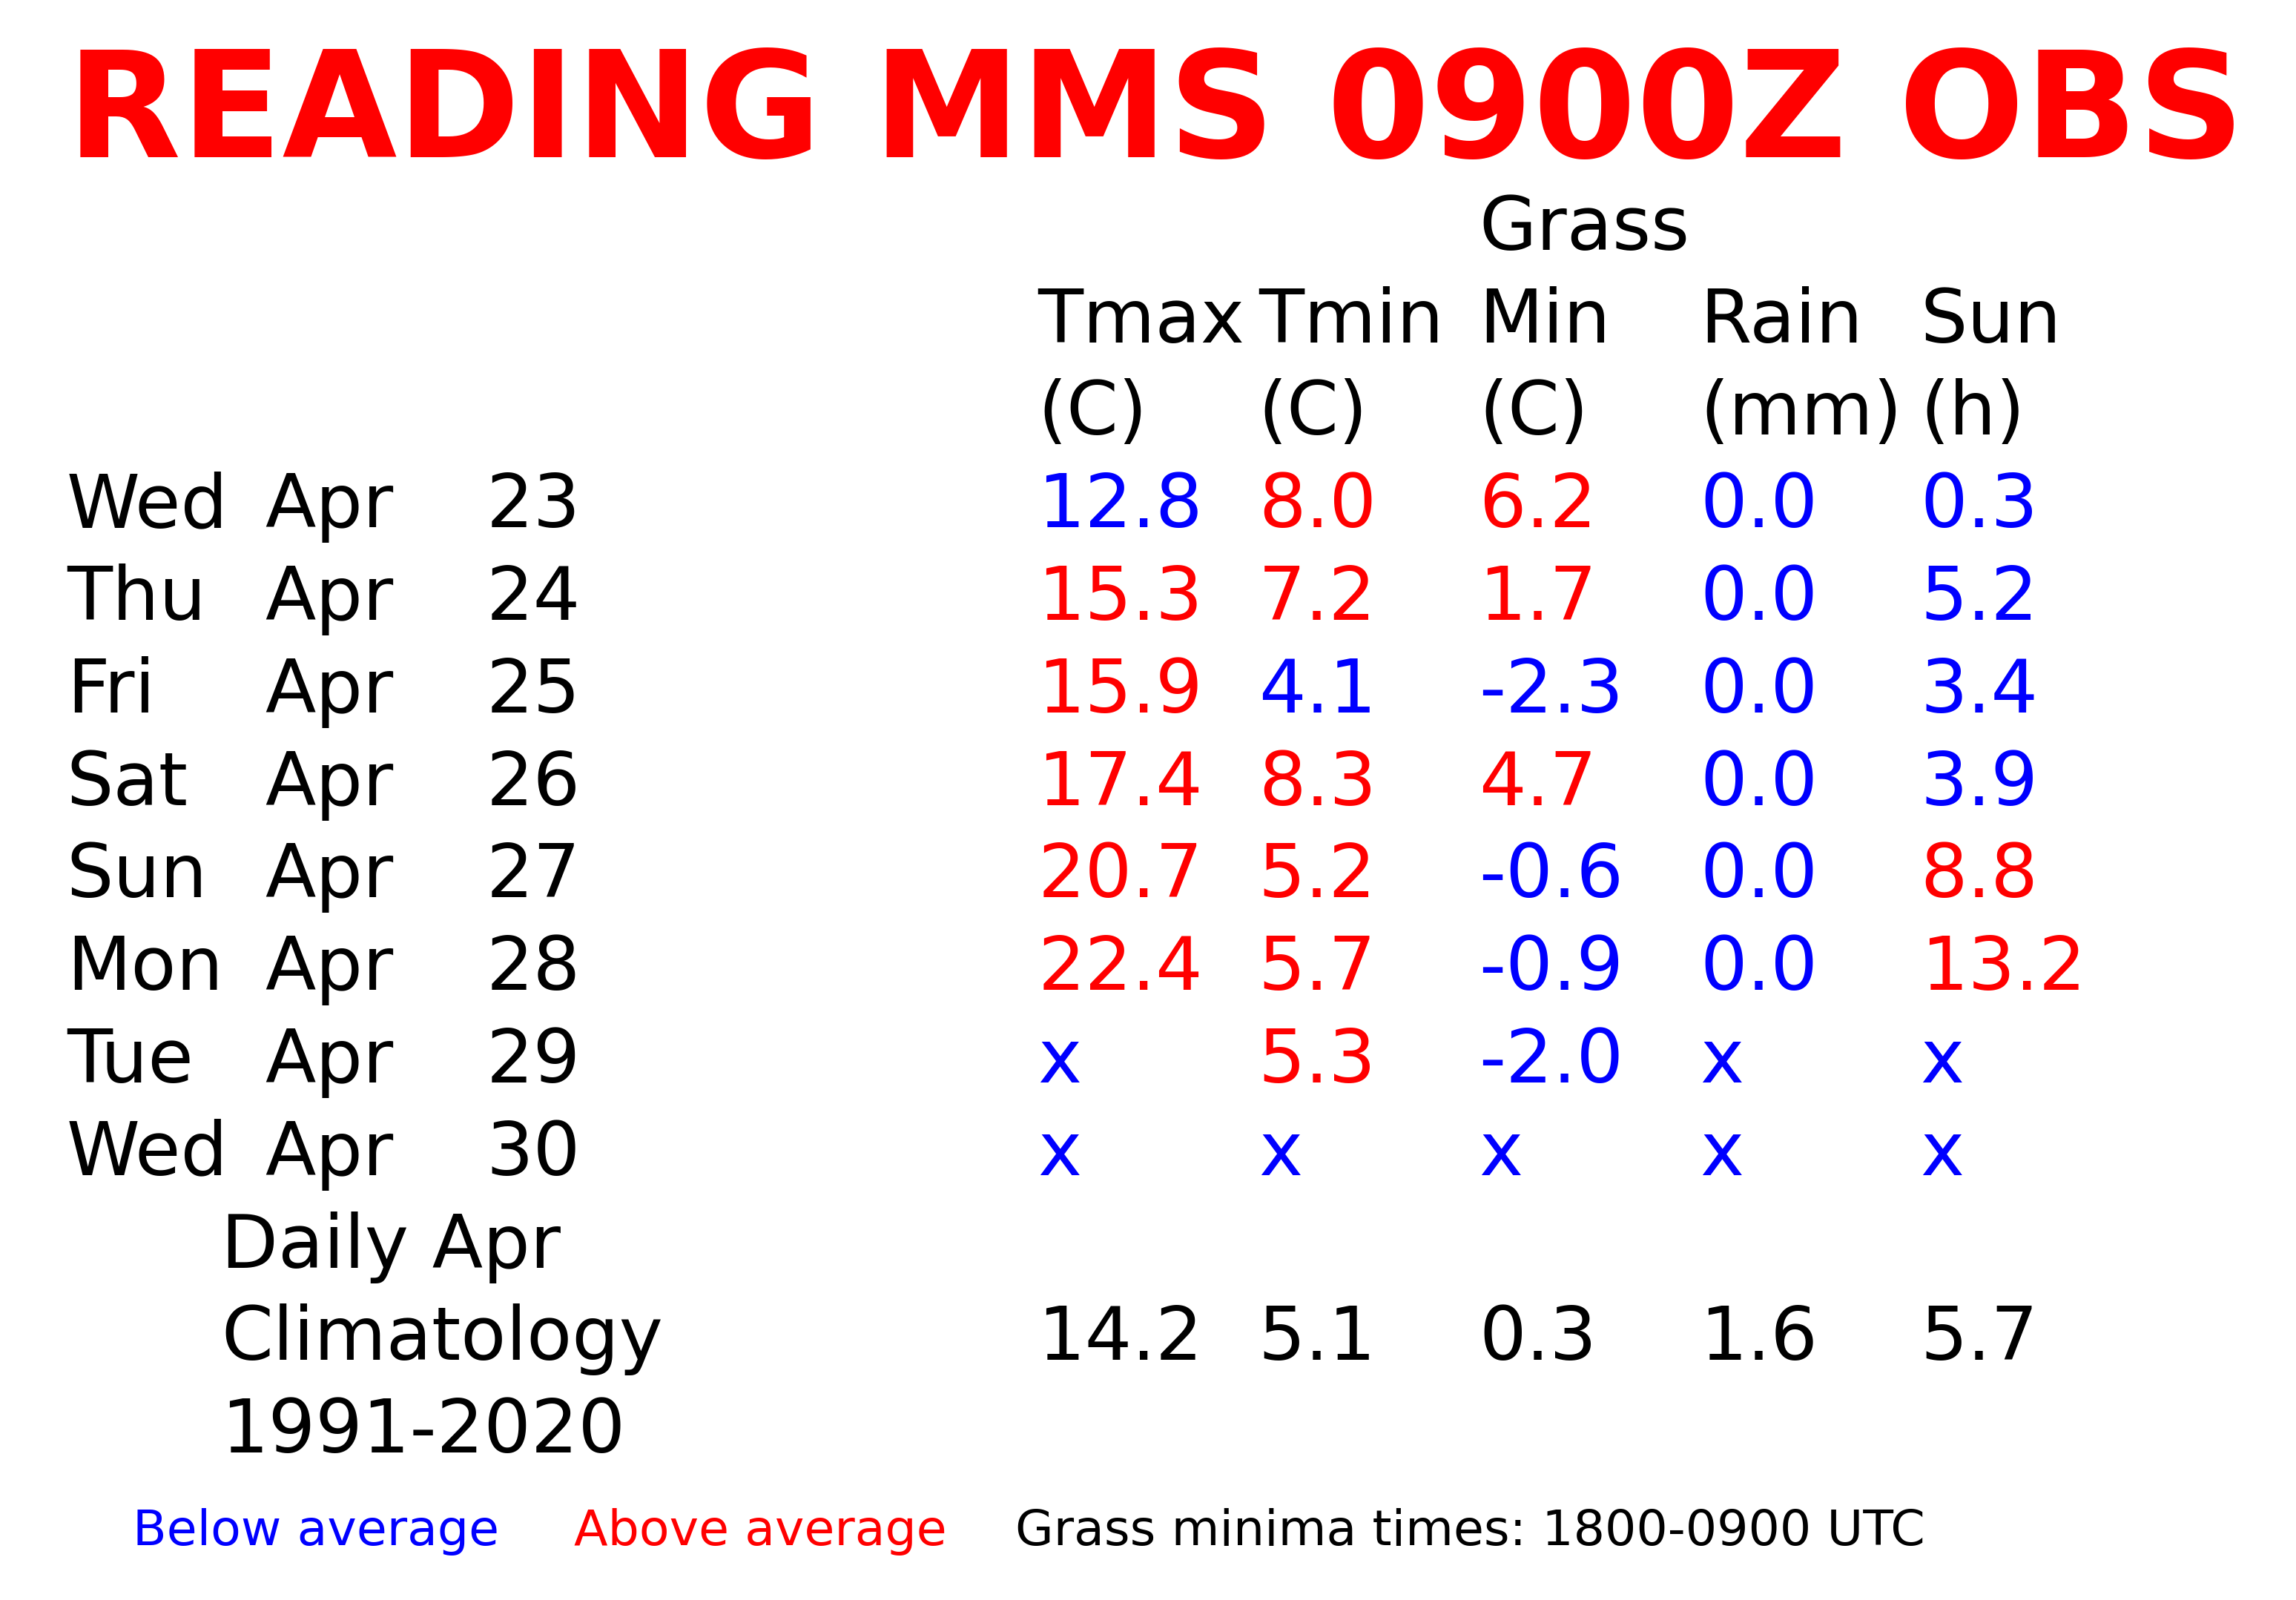
| The MMS version
|
|
|
| |
Note that the MMS version is updated infrequently, as the data become available
|
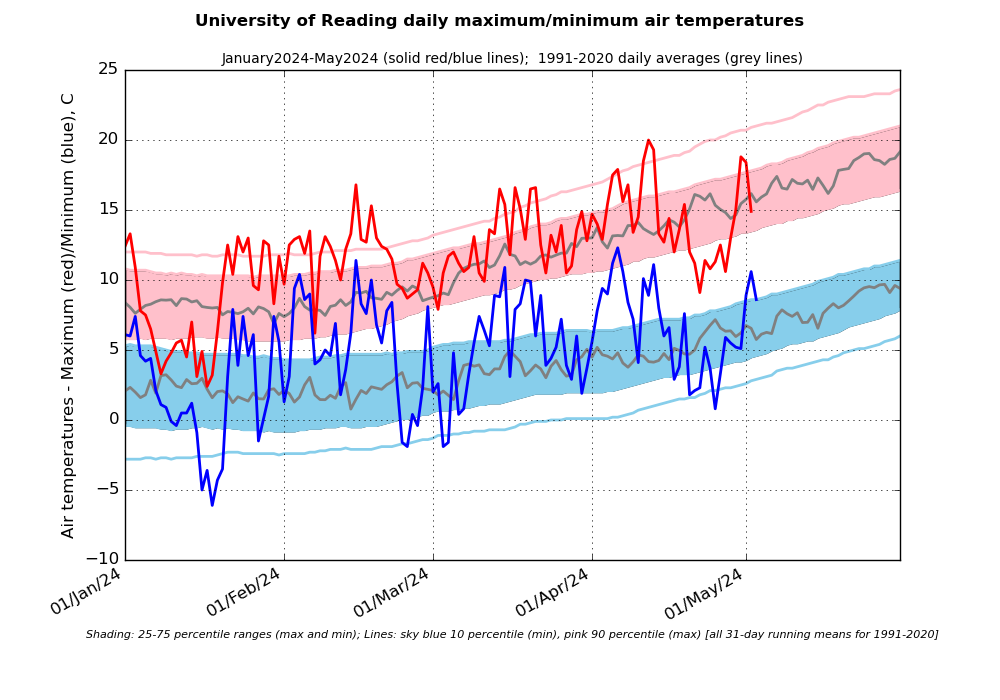
| Current month - temperature
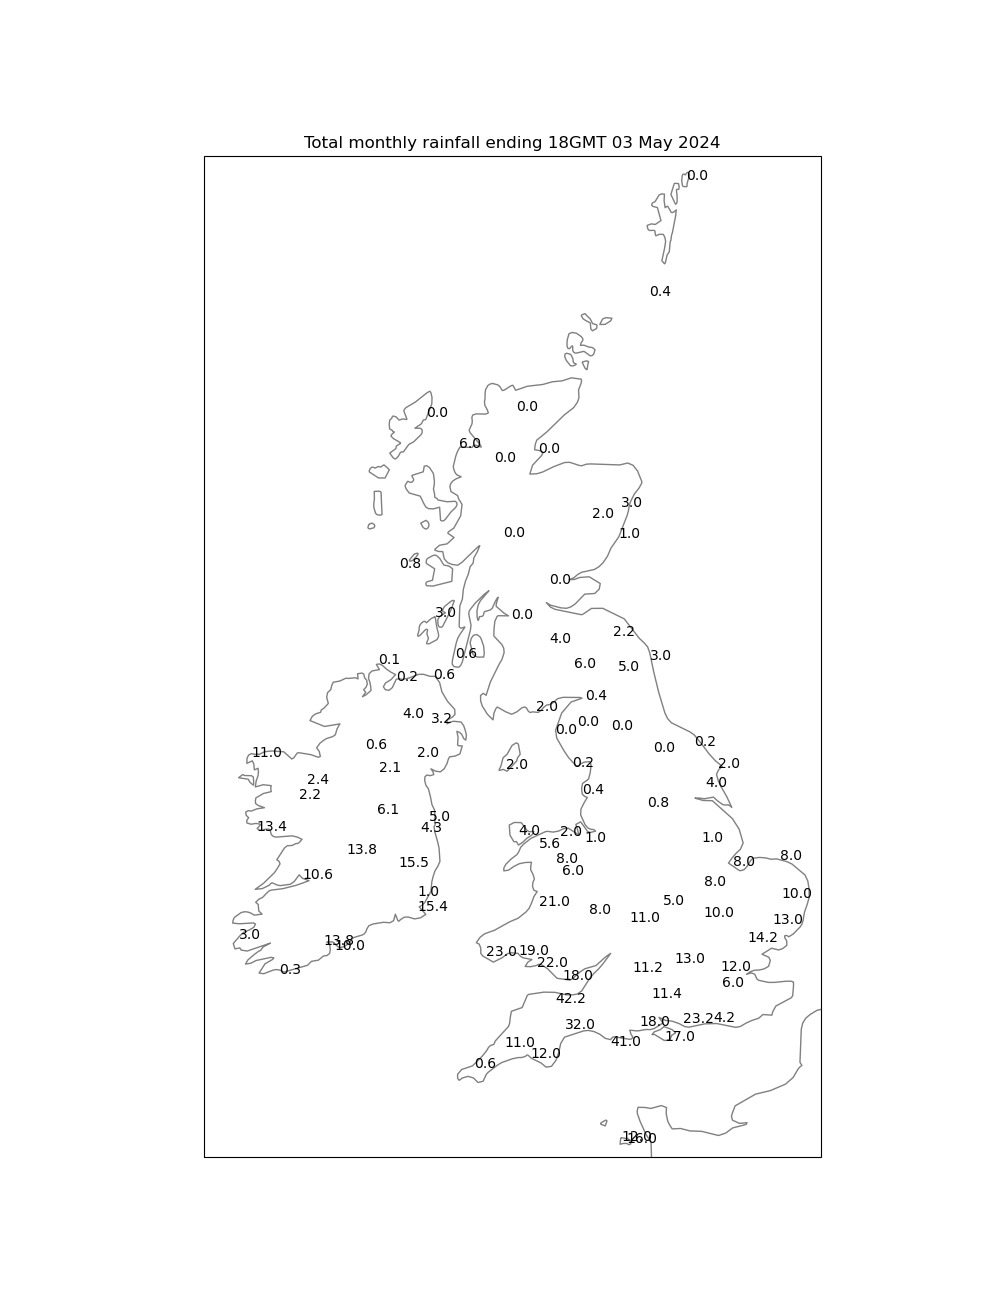
| - rainfall
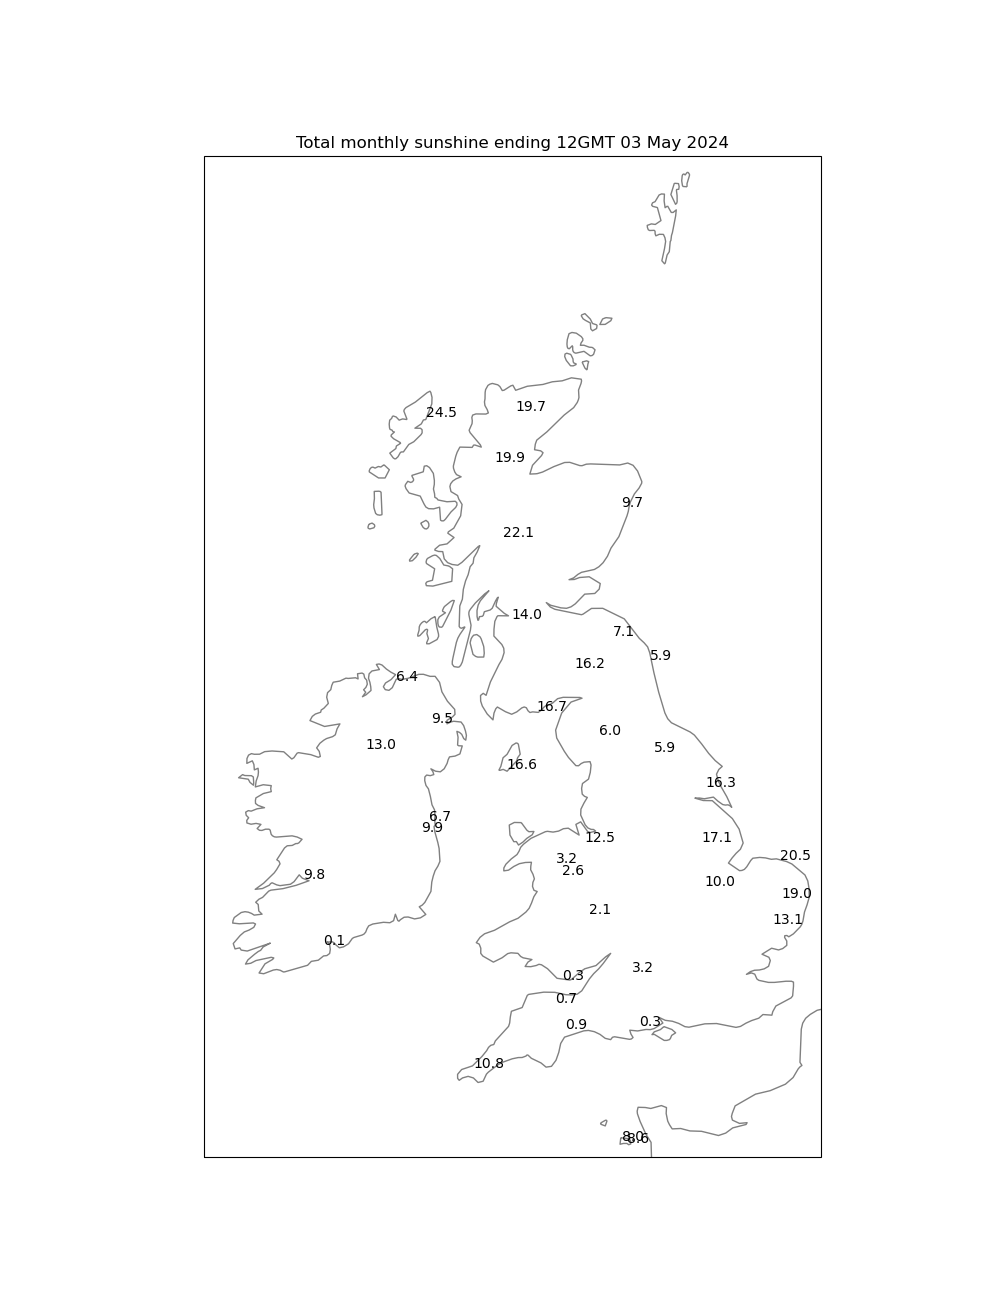
| - sunshine
|
|
|
| |
The month so far, in
numbers
|
|
| Annual - temperature
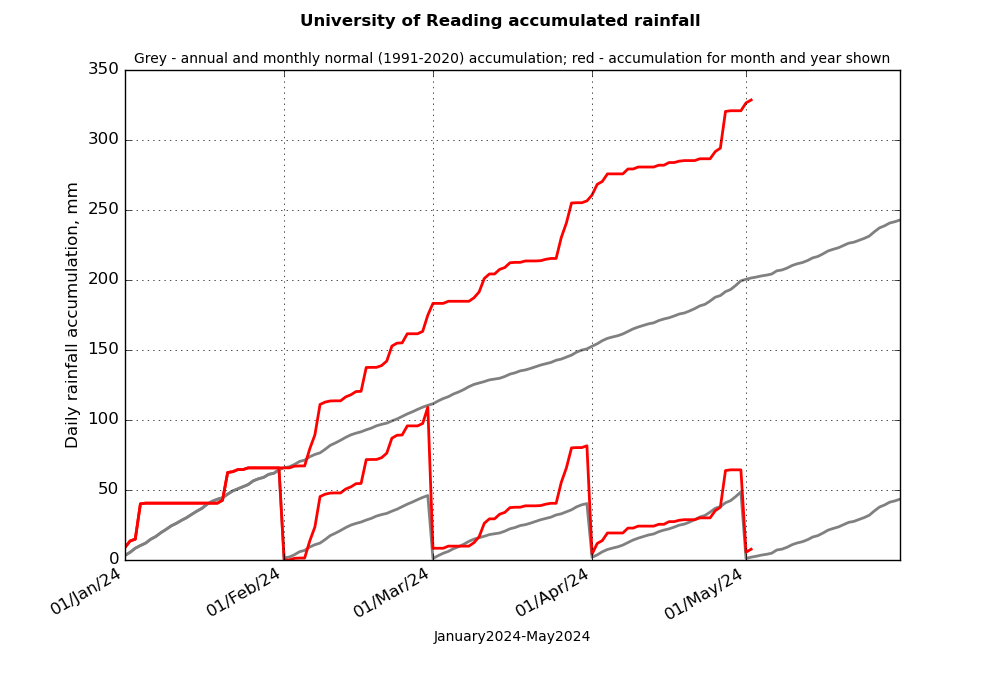
| - rainfall
| - sunshine
|
|
|
| |
|
| Previous month - temperature
| - rainfall
| - sunshine
|
|
|
| |
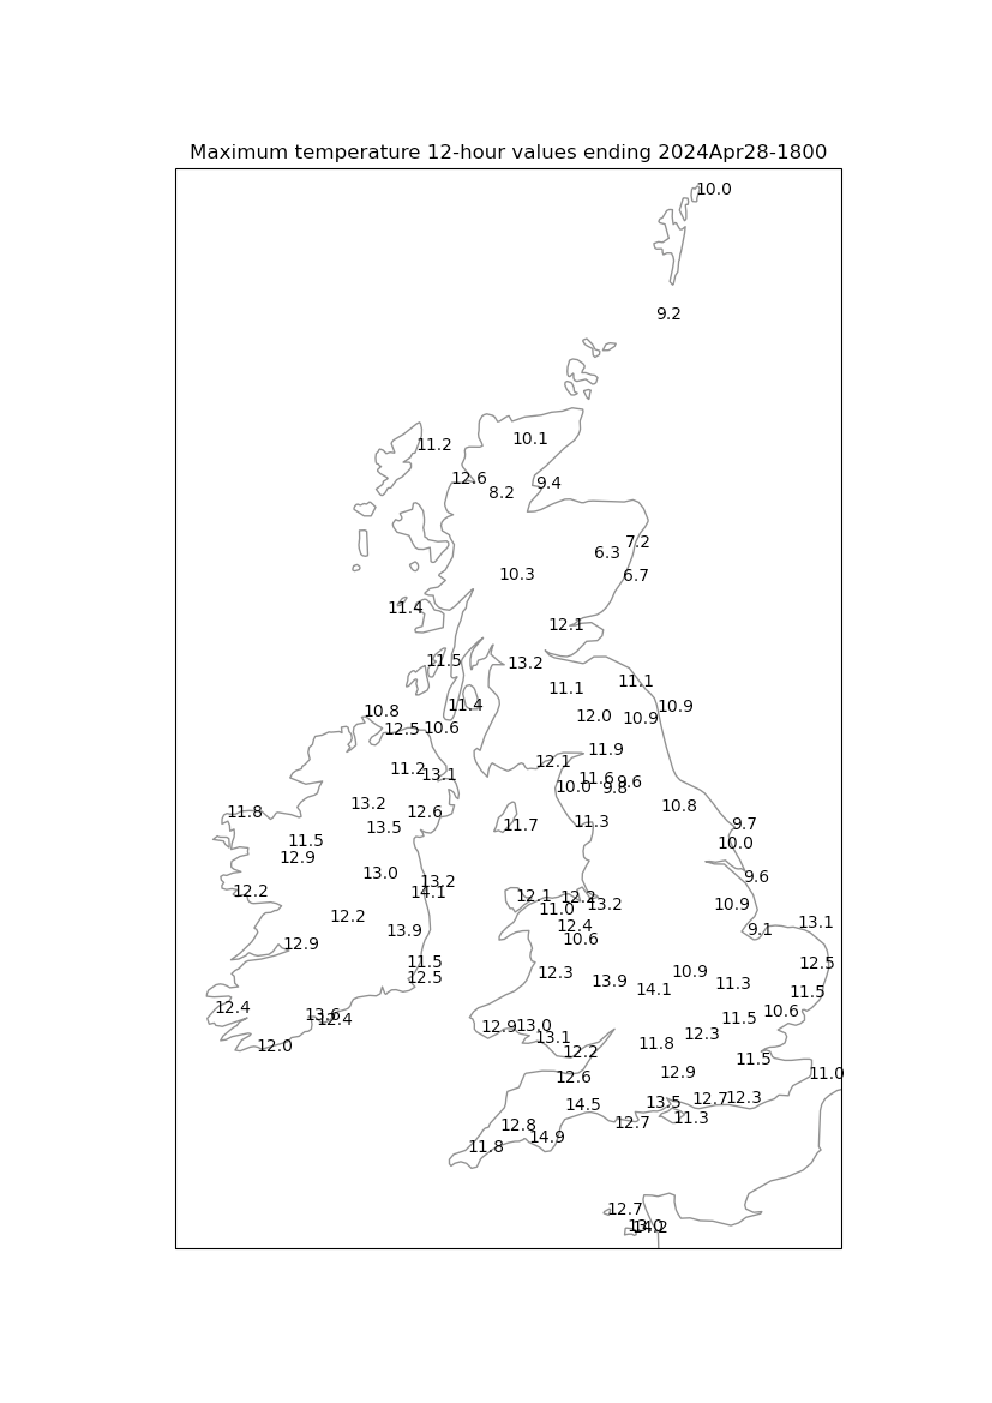
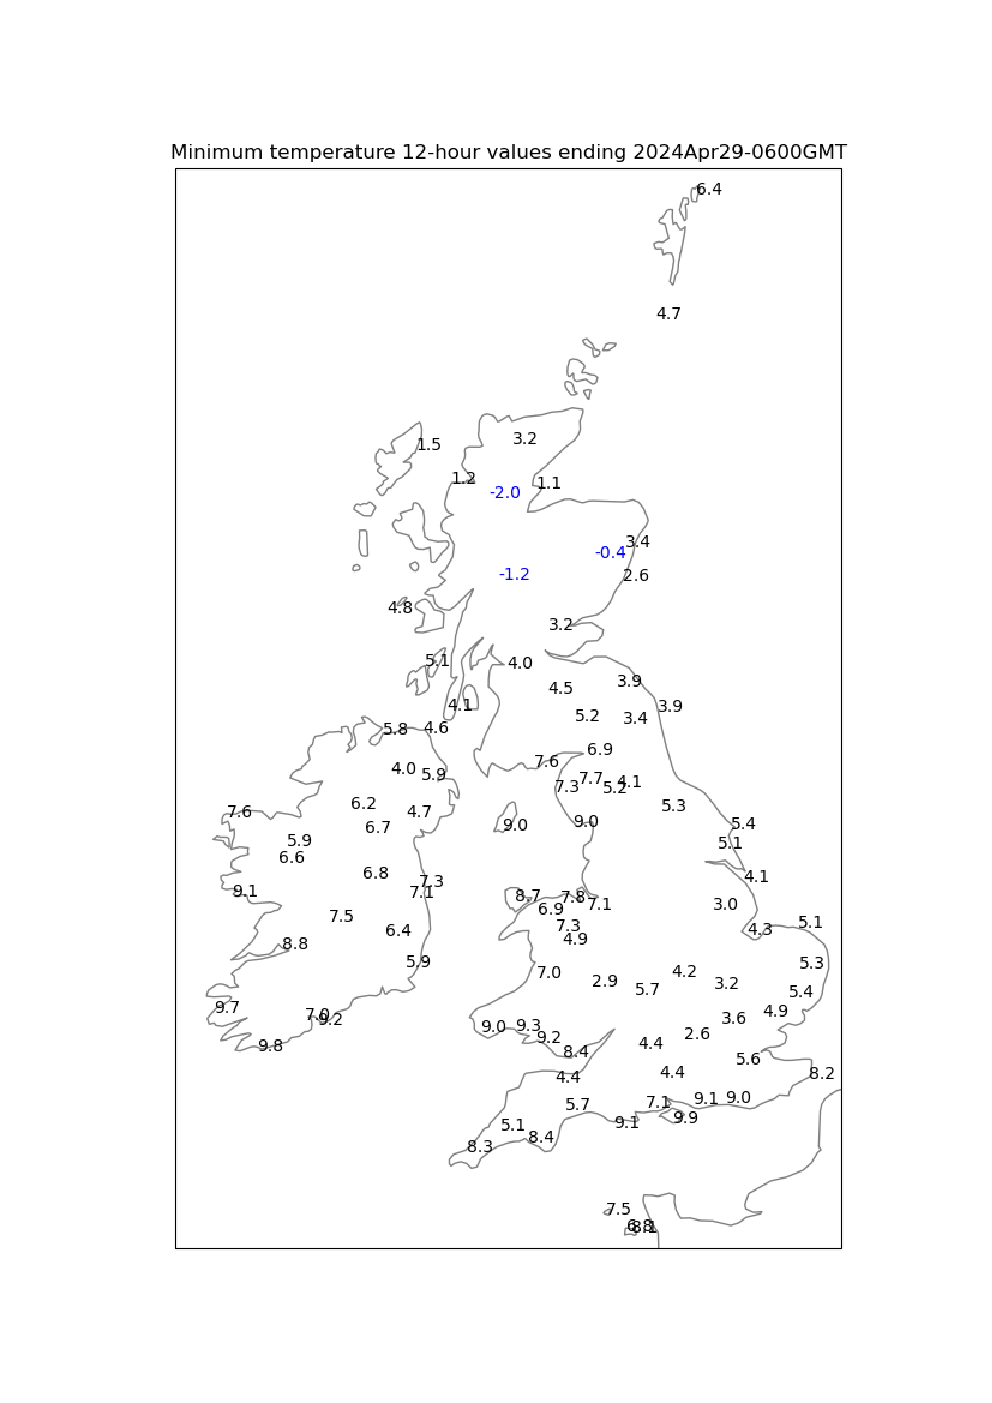
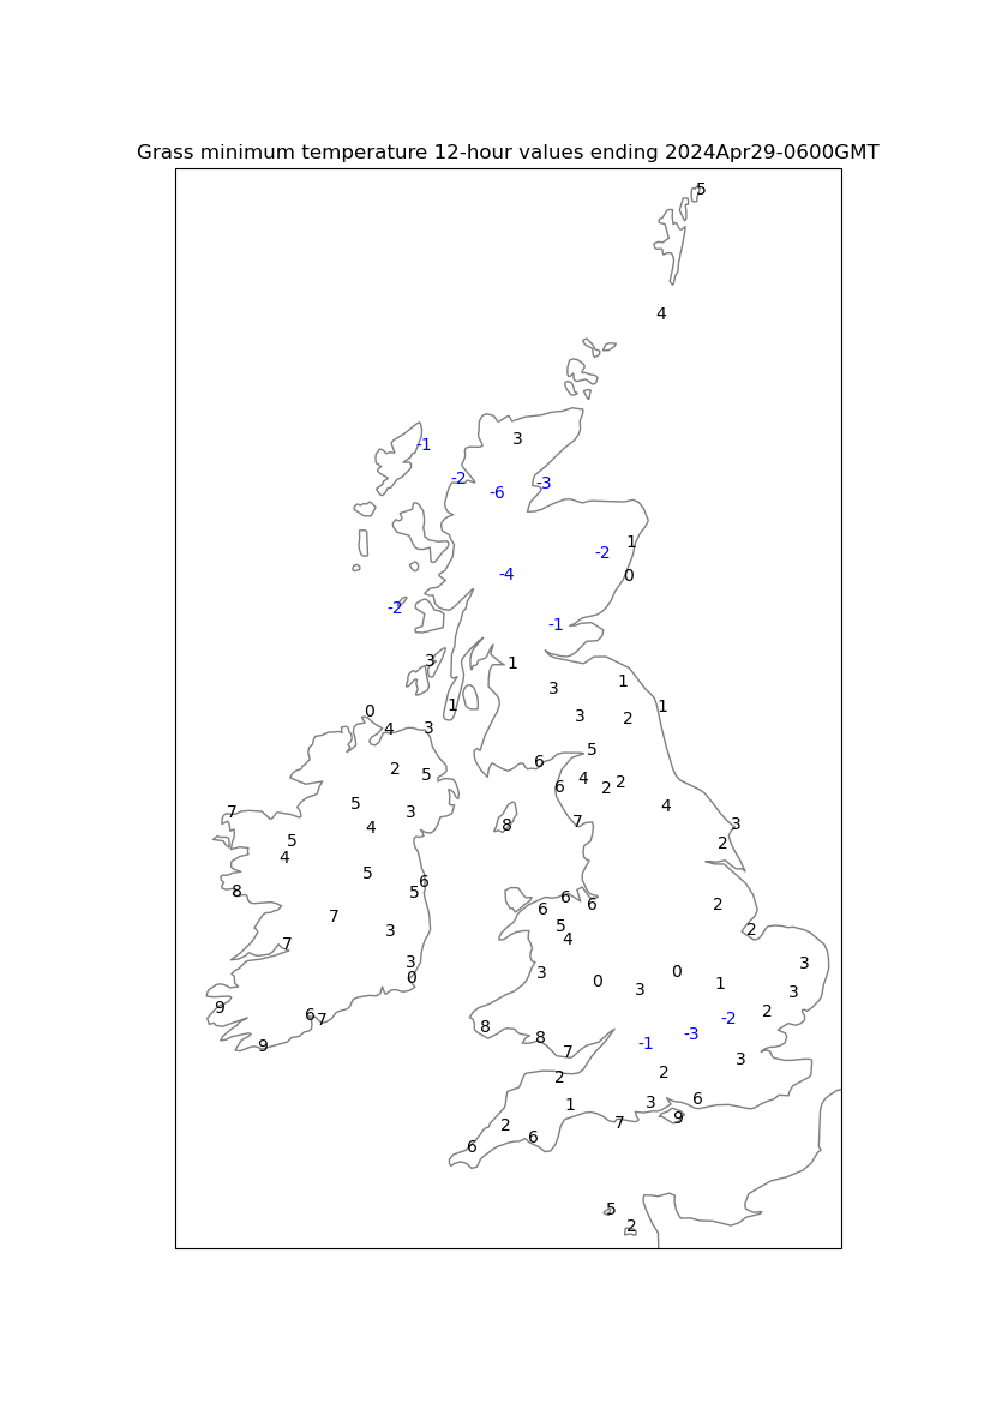
Latest tabulated Met Office daily extremes by region
|
| Daytime maximum temperature |
Night minimum temperature |
Night grass minimum temperature |
|
|
| |
|
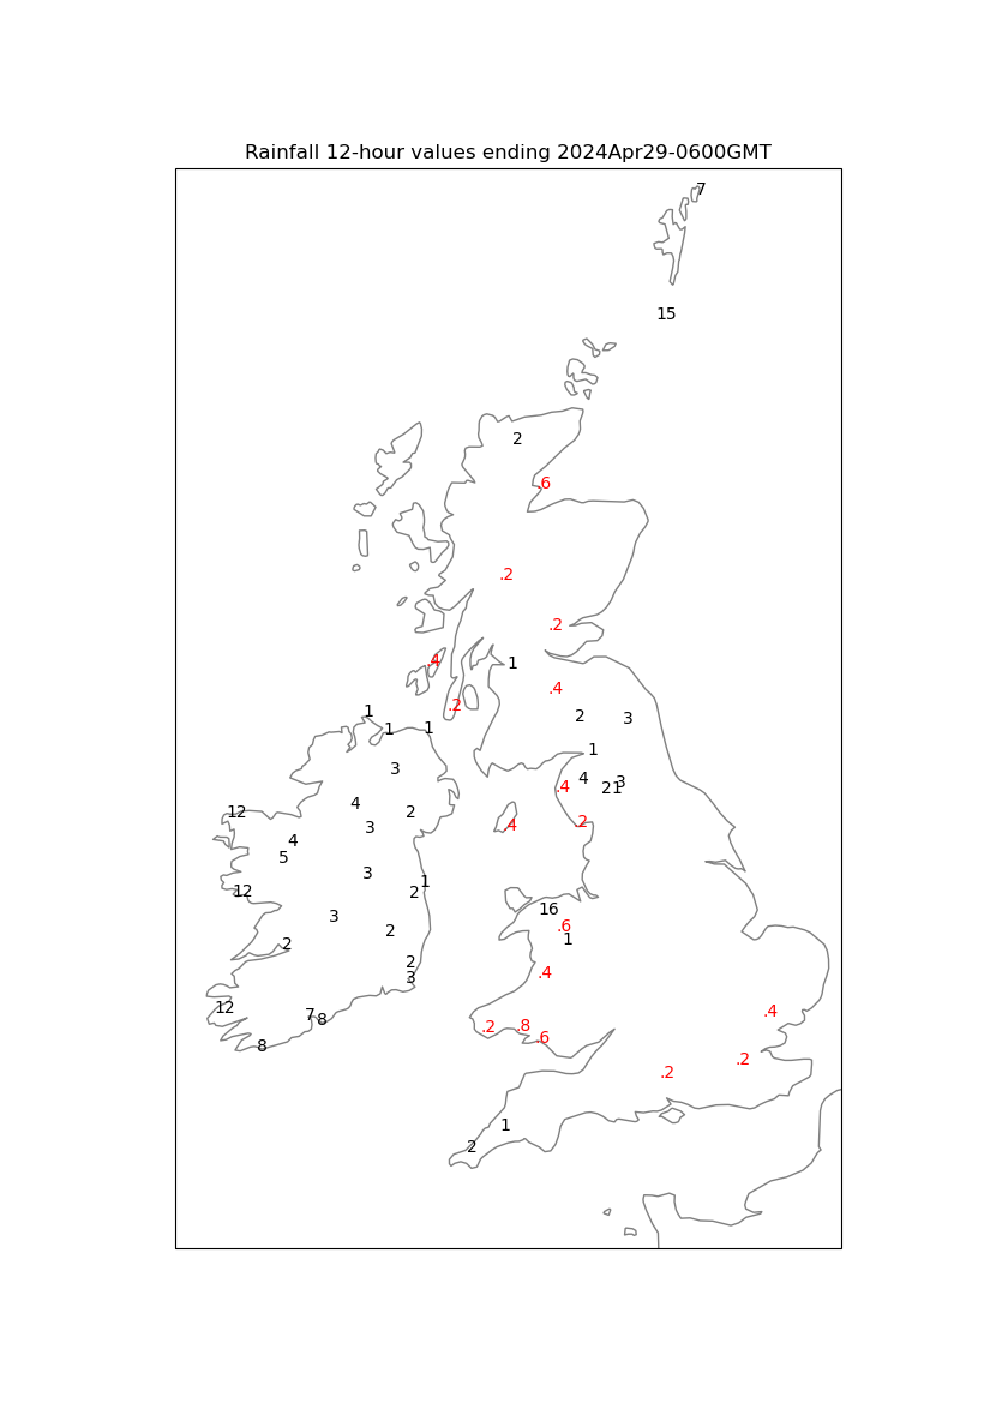
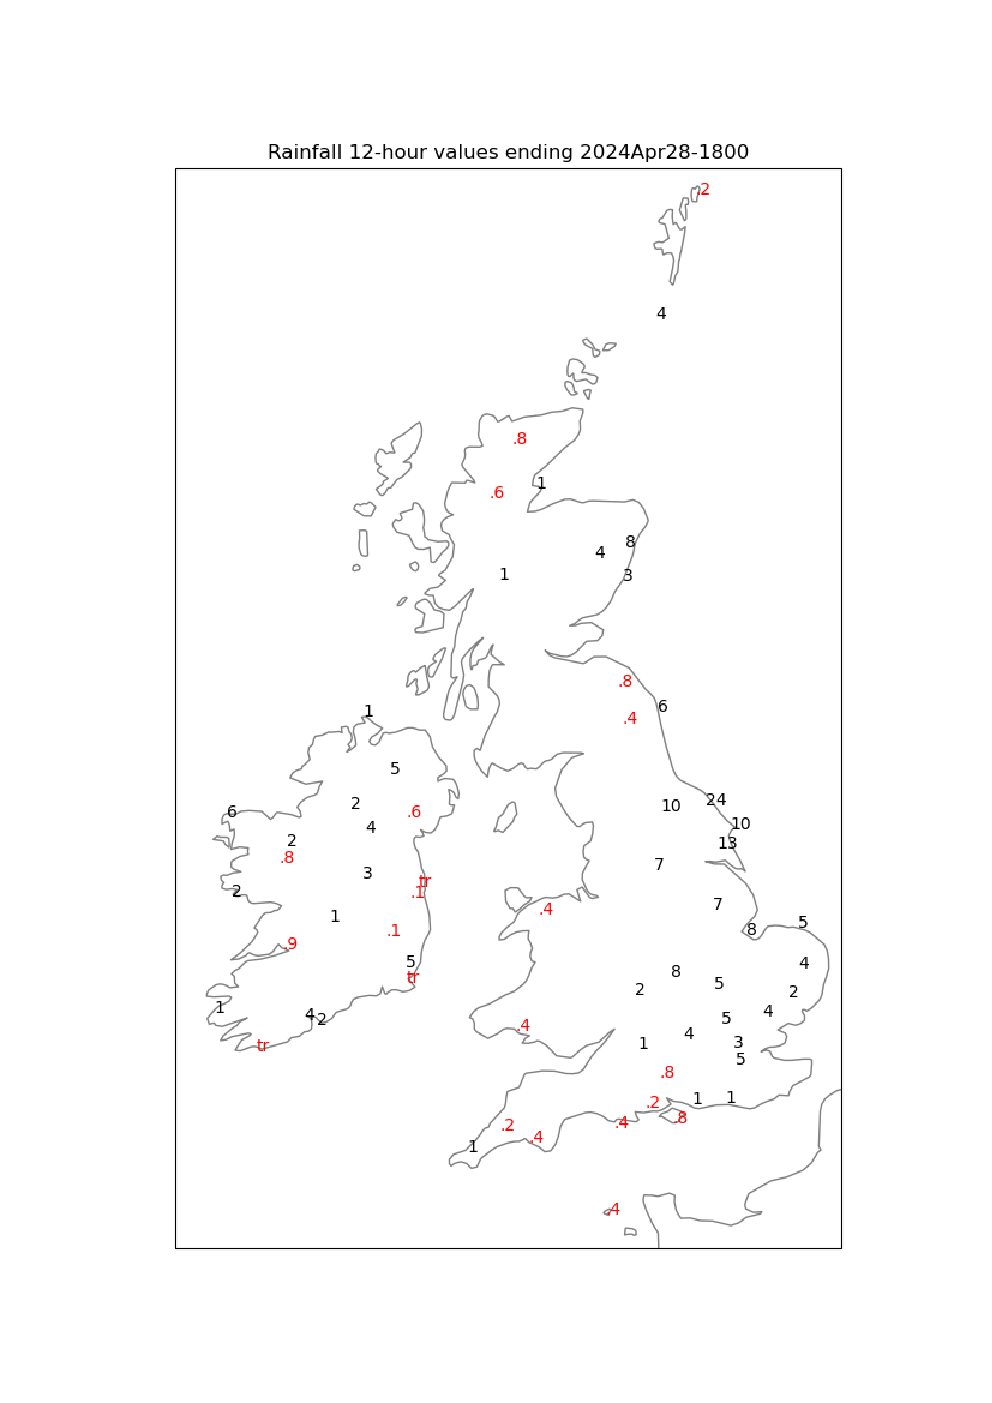
| Night 18-06 UTC precipitation |
Daytime 06-18 UTC precipitation |
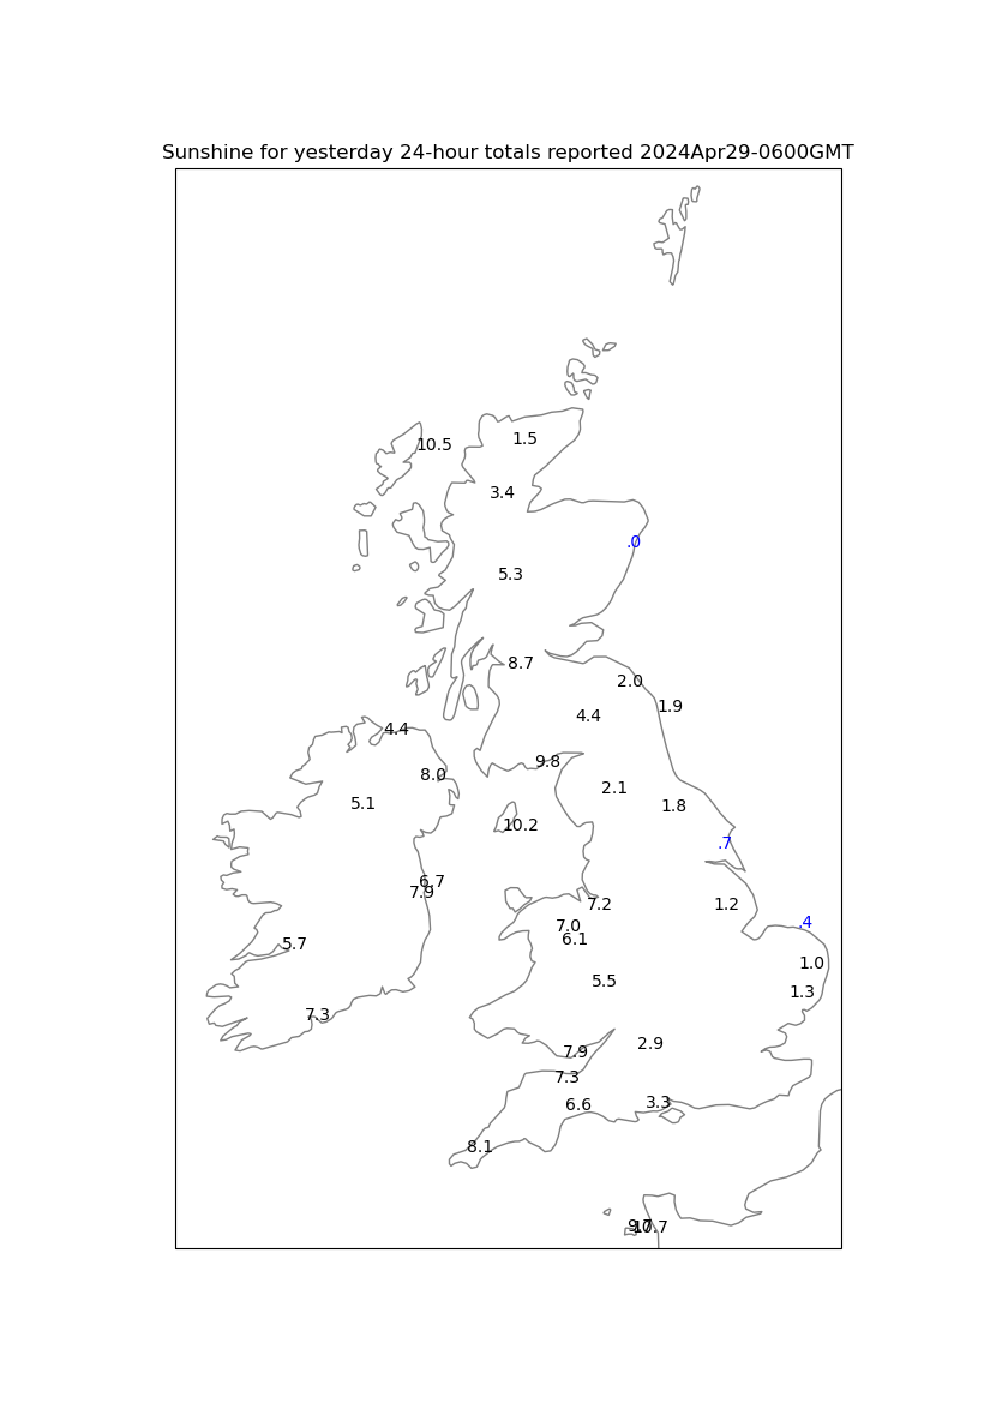
24-hour sunshine |
|
|
| |
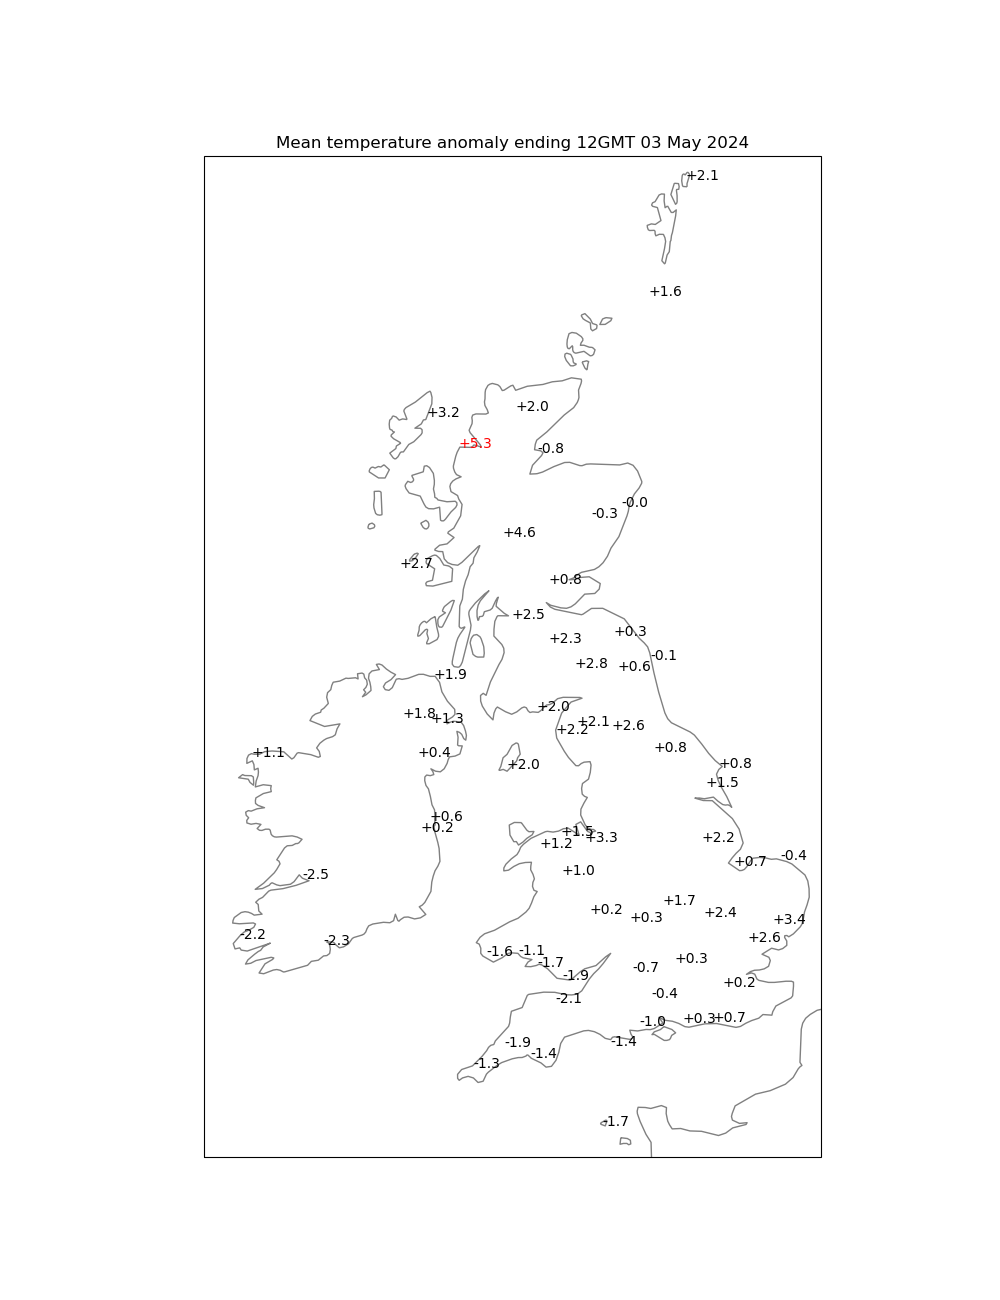
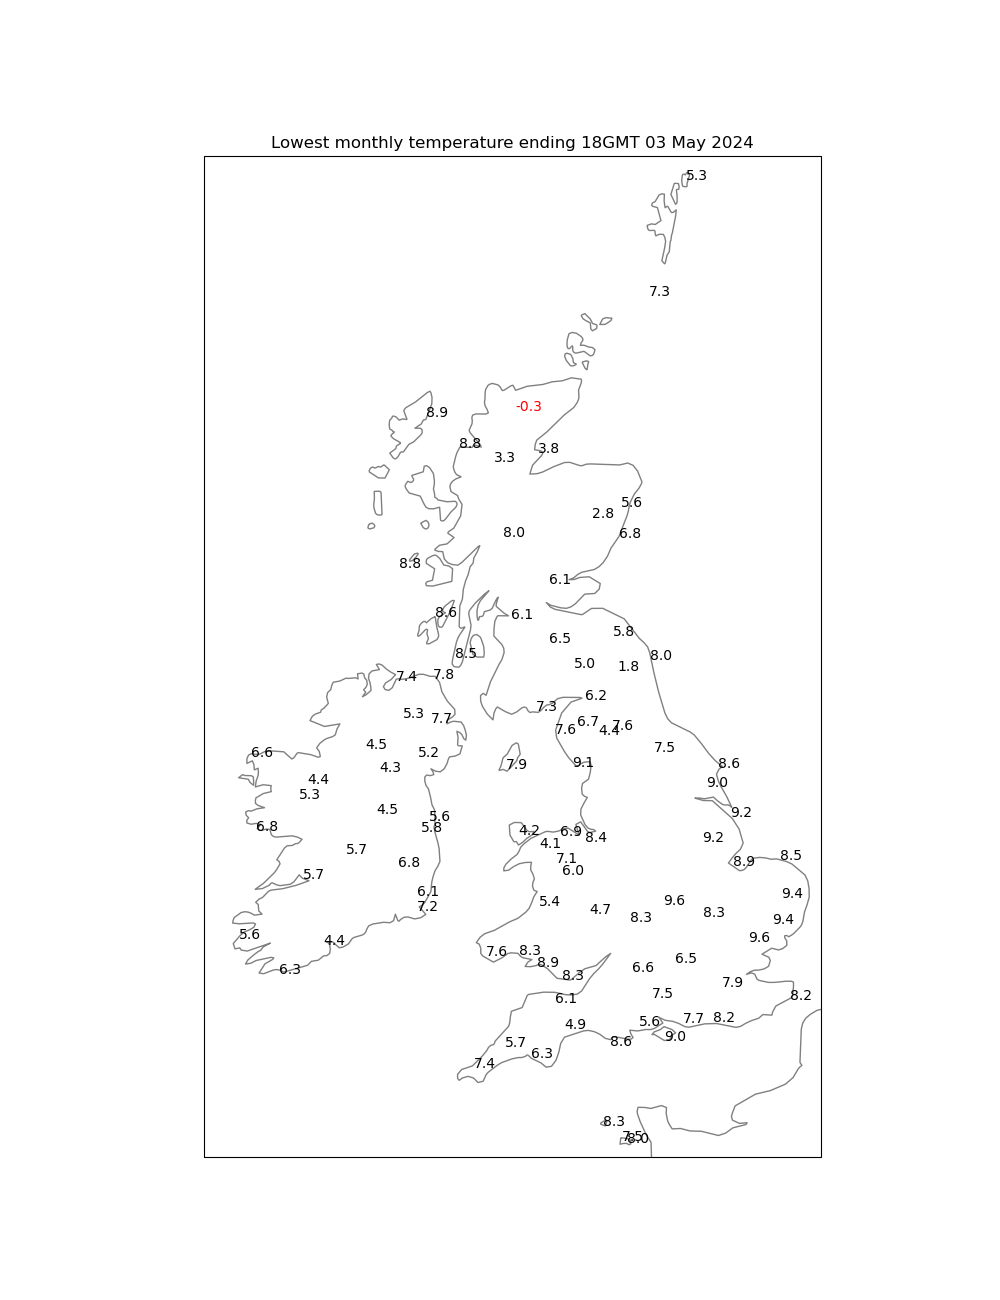
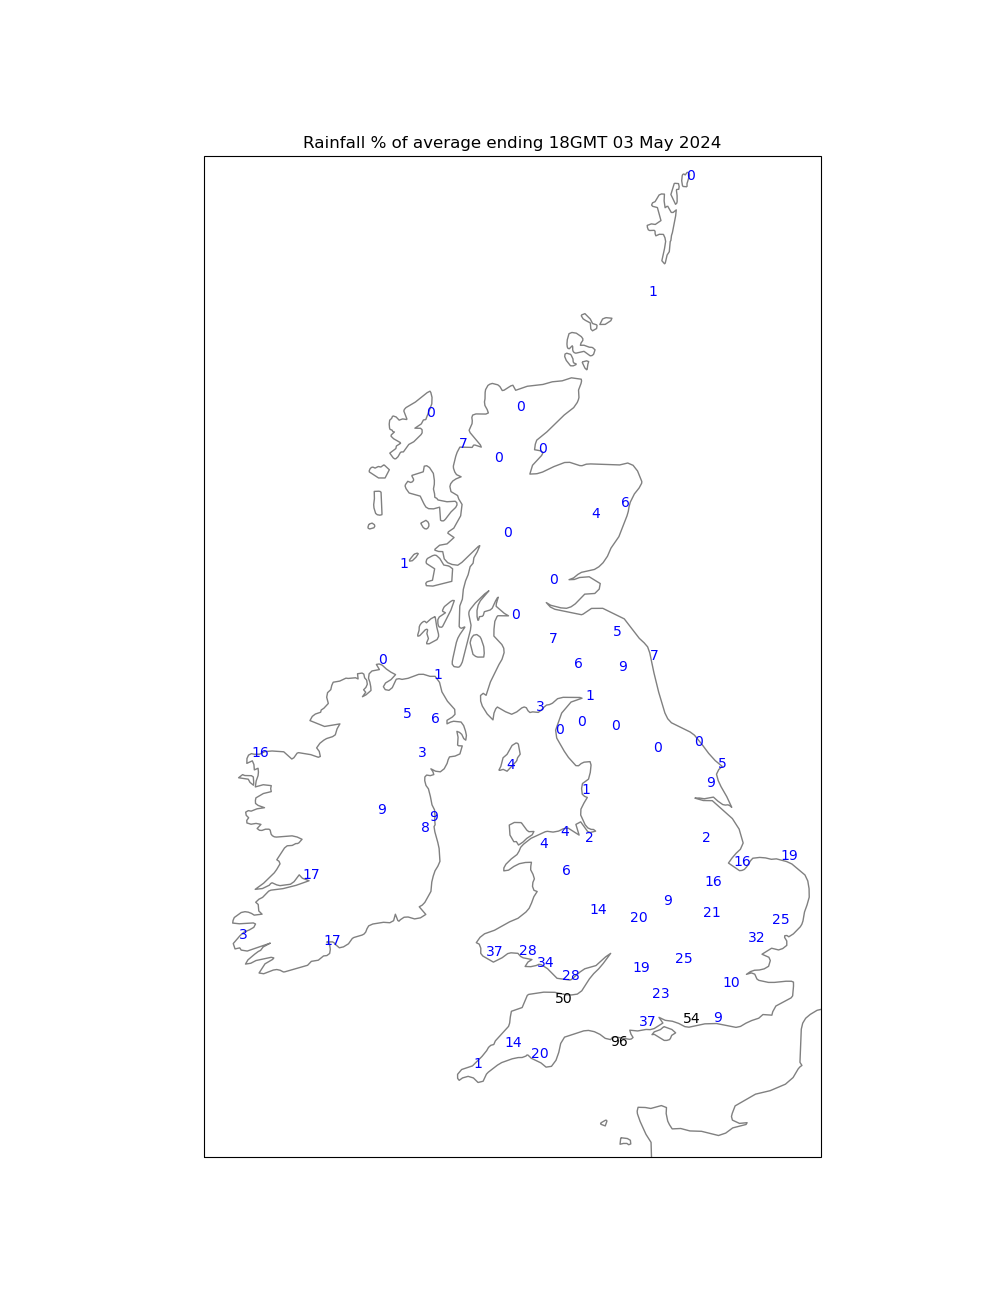
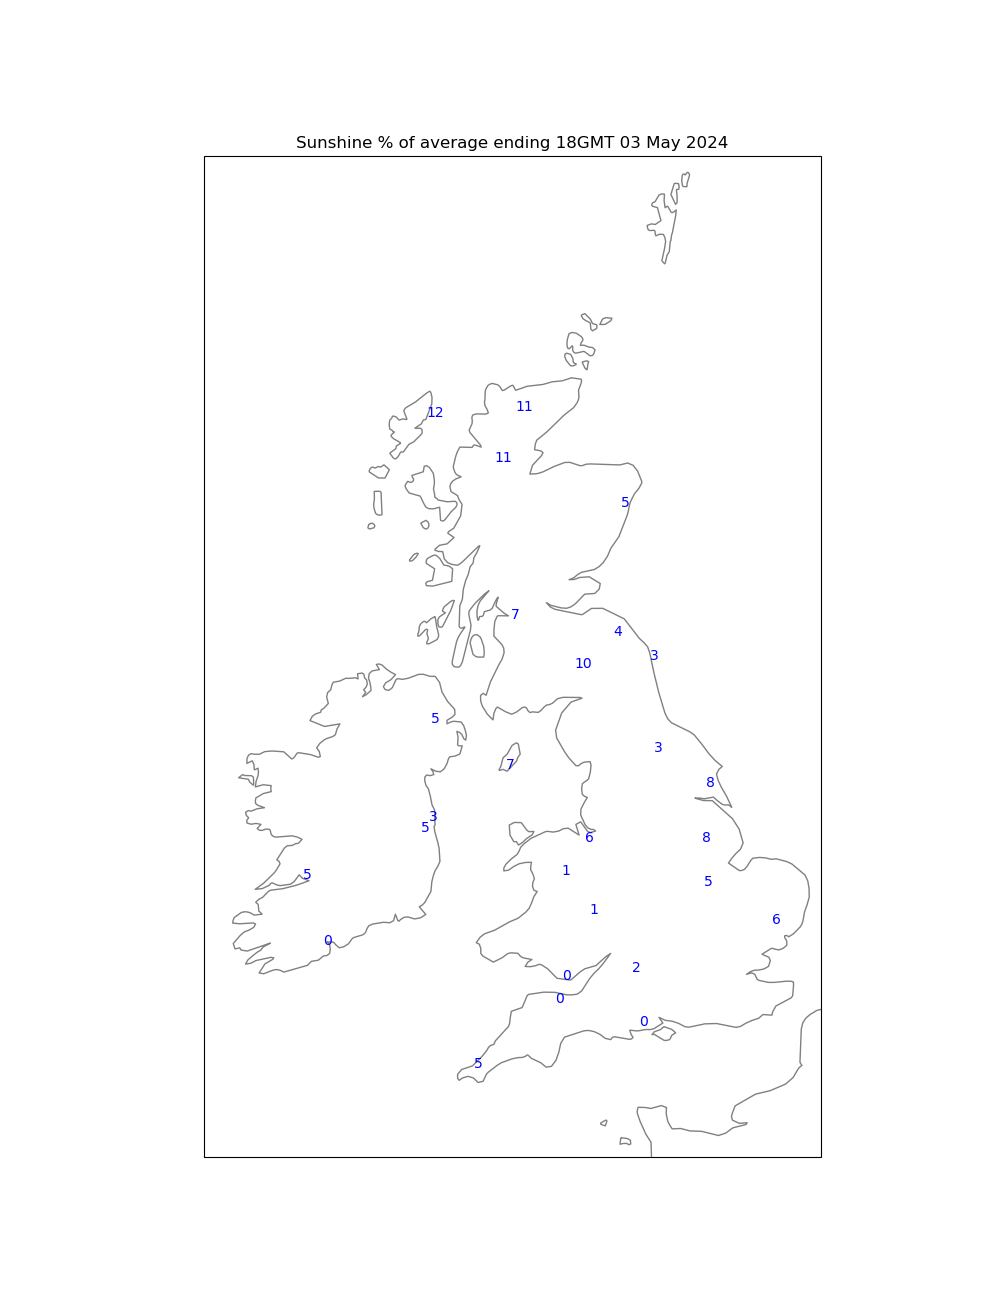
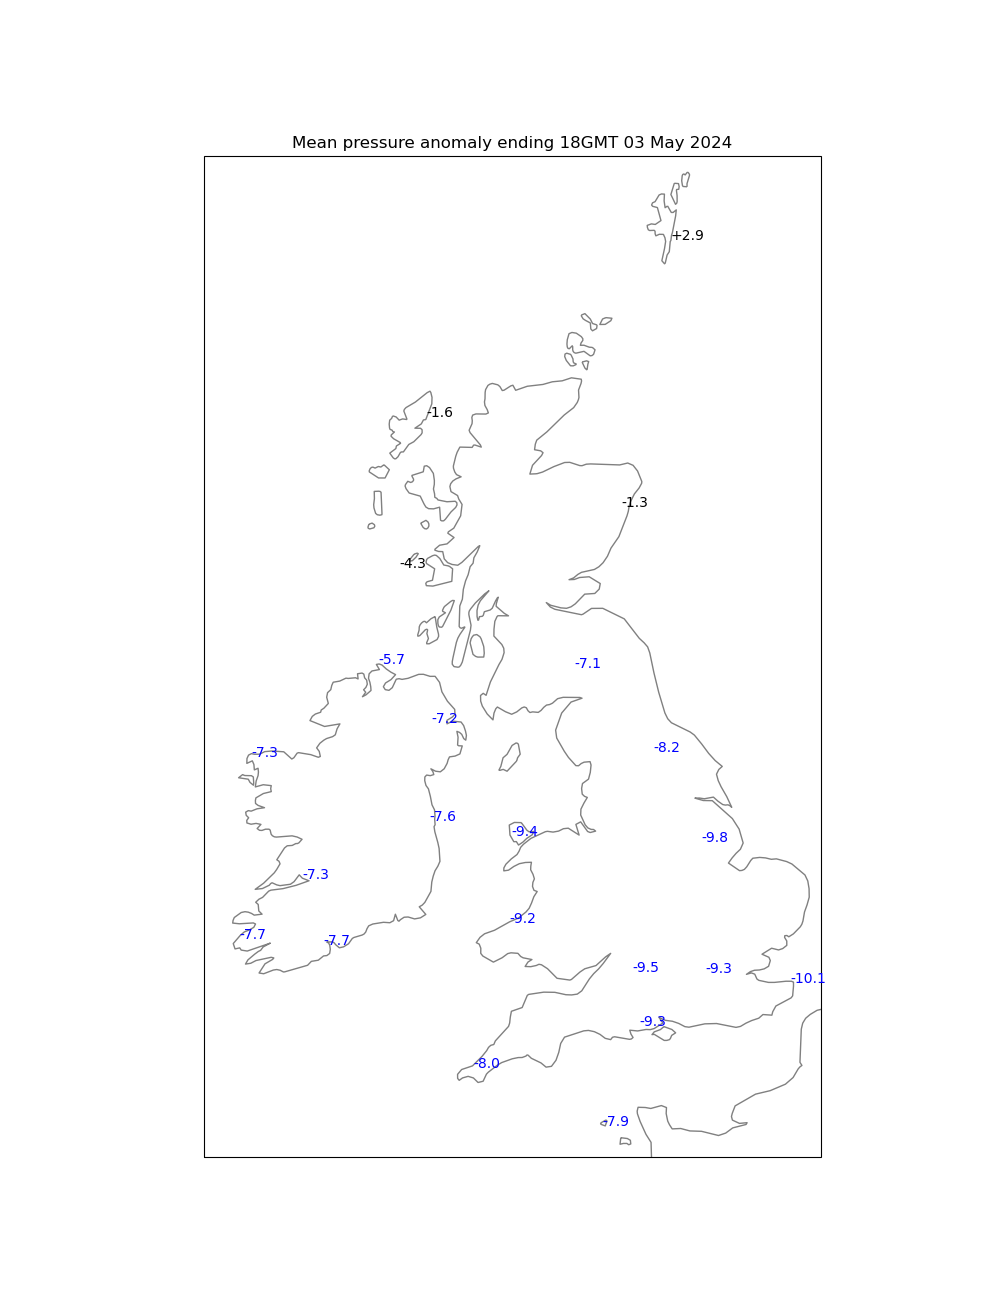
All anomalies/percentages are with respect to a full month for the period 1991-2020
|
| Mean temperature anomaly, degC |
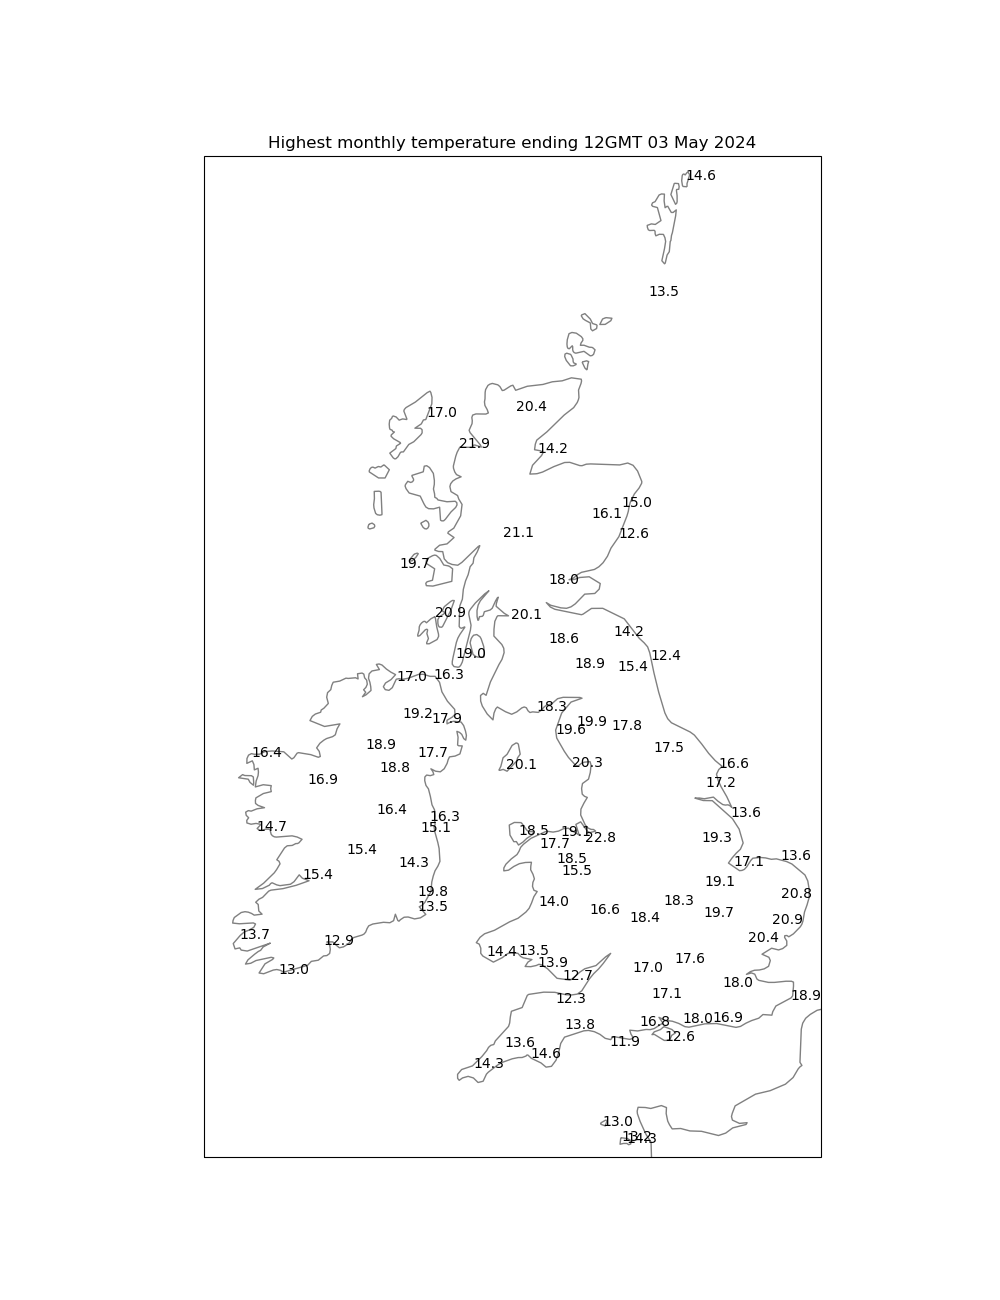
Highest temperature, C |
Lowest temperature, C |
|
|
| |
|
| Rainfall: percentage of monthly average |
Sunshine: percentage of monthly average |
Mean pressure anomaly, hPa |
|
|
| |
|
| Mean temperature, C |
Total rainfall, mm |
Total sunshine, h |
|
|
| |
|
| UKMO Surface analysis |
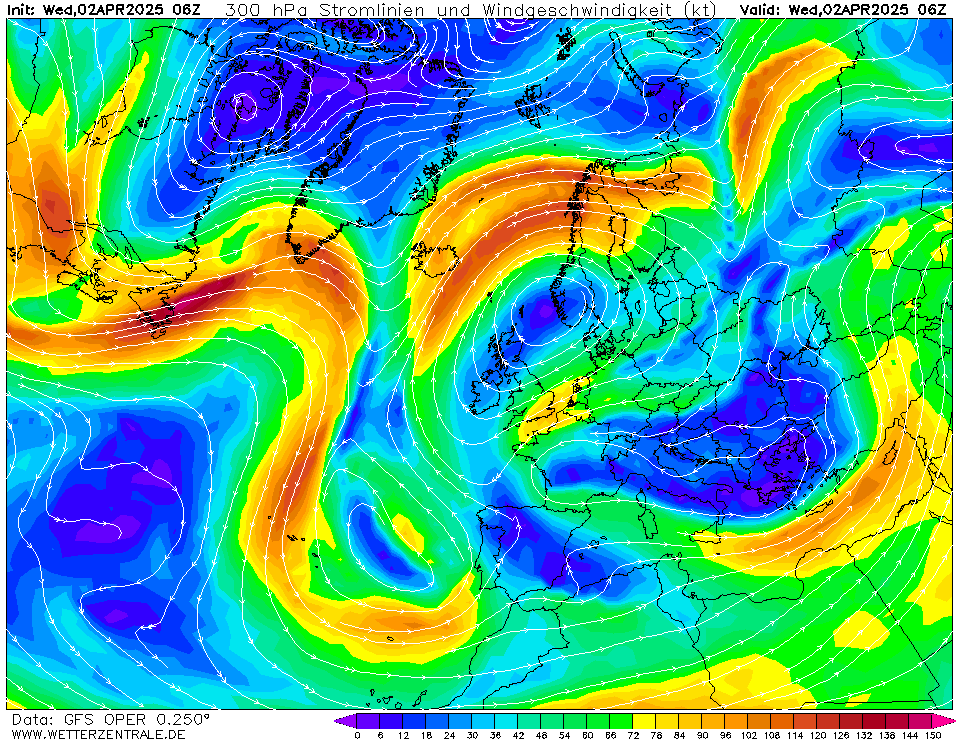
| 500 hPa analysis: northern hemisphere |
| 500 hPa analysis: temperature and height |
|
|
| |
Sources: Wetterzentrale and NCEP/NWS/NOAA
|
| 24h ↓ |
| 36h ↓ |
|
|
| |
|
| 48h ↓ |
| 60h ↓ |
|
|
| |
|
| 72h ↓ |
| 84h ↓ |
|
|
| |
|
| 96h ↓ |
| 120h ↓ |
|
|
| |
Source: Wetterzentrale
Sources: EUMETSAT and Wetterzentrale
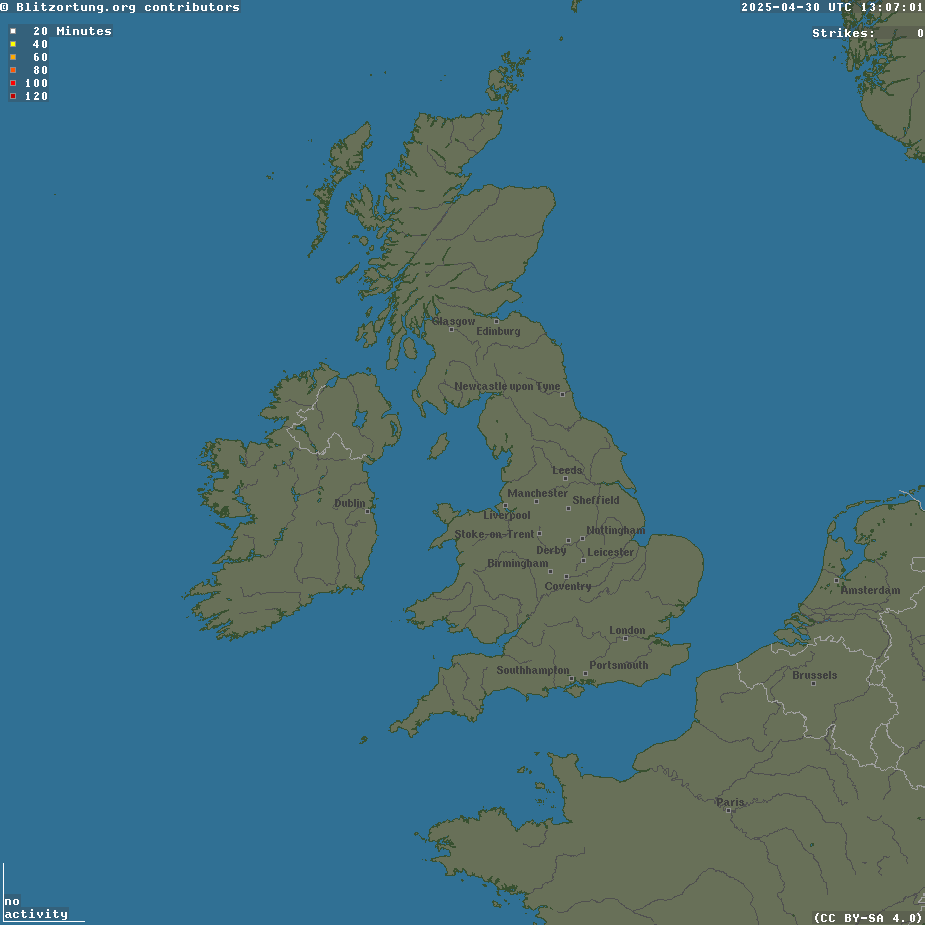
For an 'zoomed in' view see
here (and double-click on a white box)
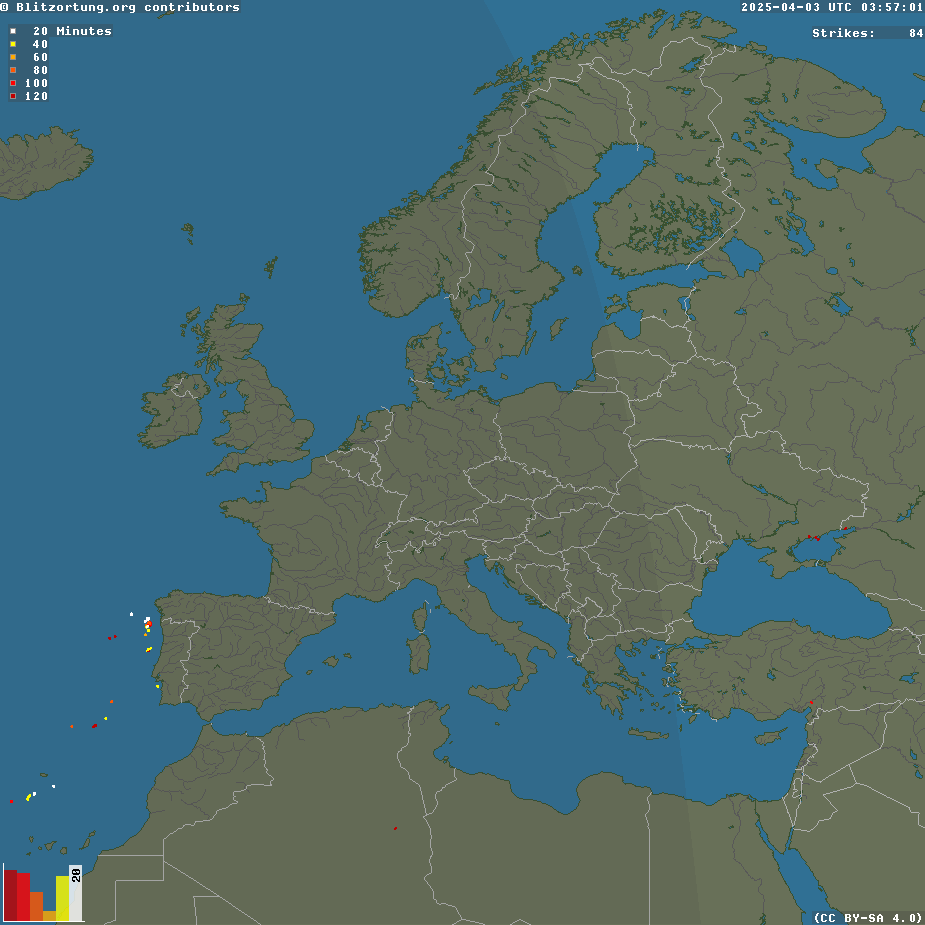
Source: images.blitzortung.org
|
| |
| |
|
| 
| Latest Met Office imagery:
here
| |
Source: www.weatheronline.co.uk
These are subject to availability
Source: weather.uwyo.edu
Some useful links
Forecast charts from ECMWF, the European Centre for Medium-Range Weather Forecasts, can be found
here
Finally, this link
will take you to the Reading University Atmospheric Observatory data and script page