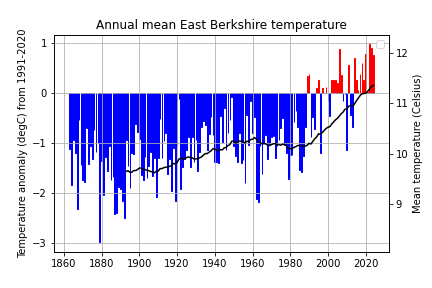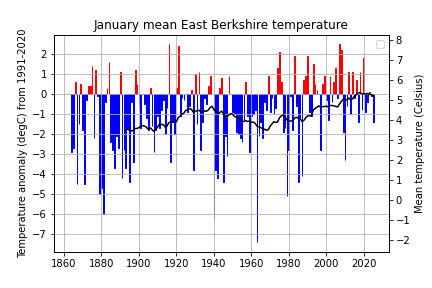
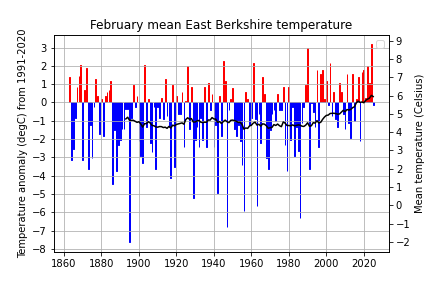
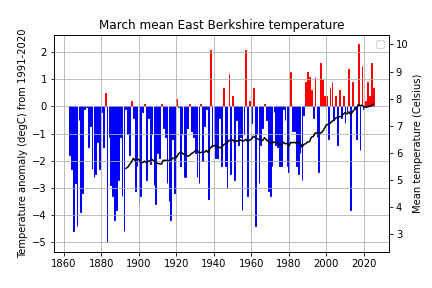
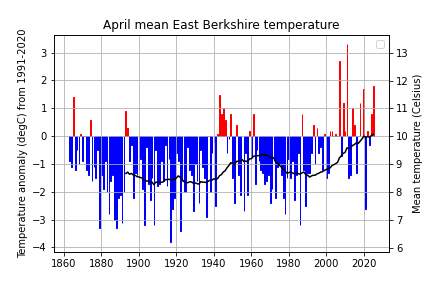
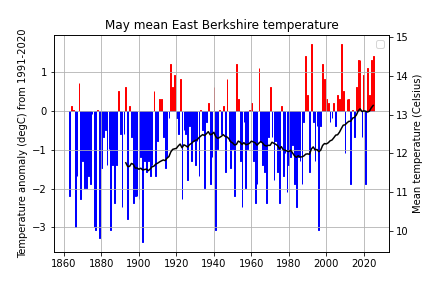
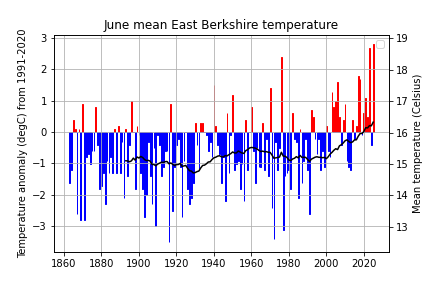
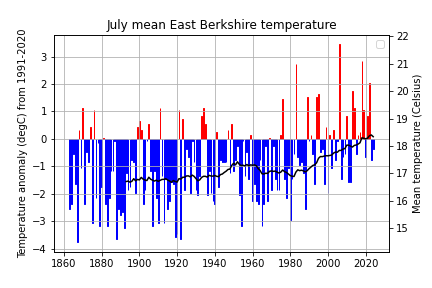
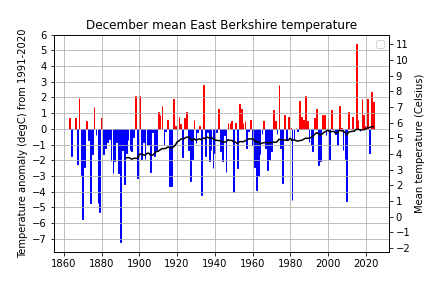
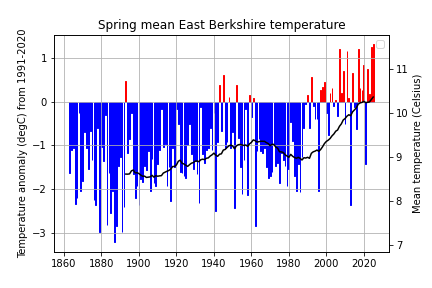
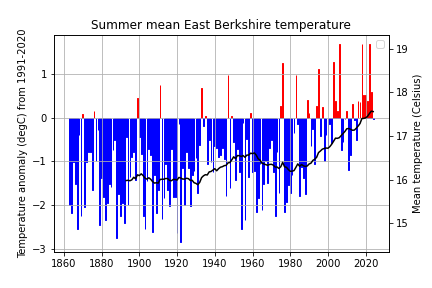
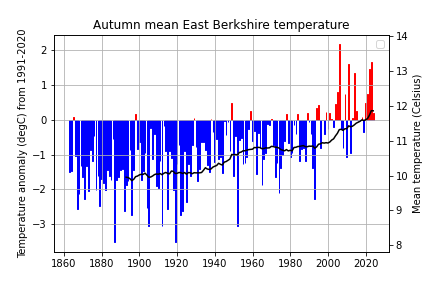
This series has been determined using reported monthly-mean temperatures from many of the weather stations that have been open in the Reading-Bracknell-Wokingham-Maidenhead area at some point in time since 1863.
The weather stations currently used are those for Maidenhead West, Crowthorne 2, Wokingham and the University of Reading. Monthly data for all these stations can be found in the monthly Bulletin of the Climatological Observers Link.
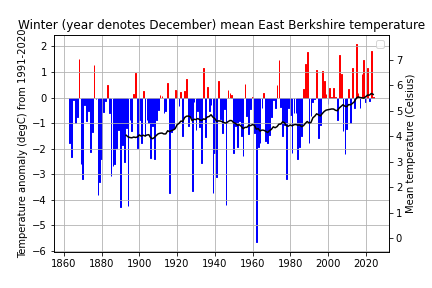
Each graph shows:
January February
March April
May June
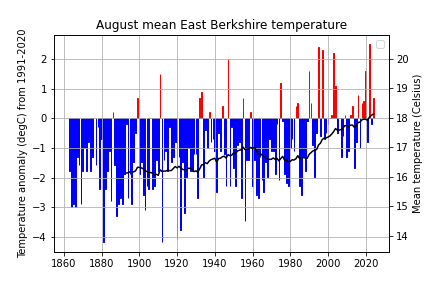
July August
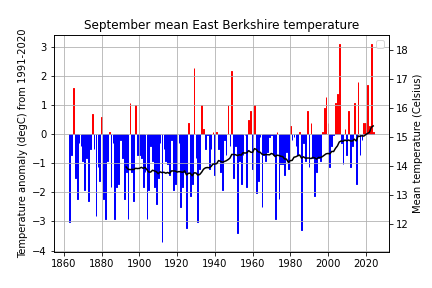
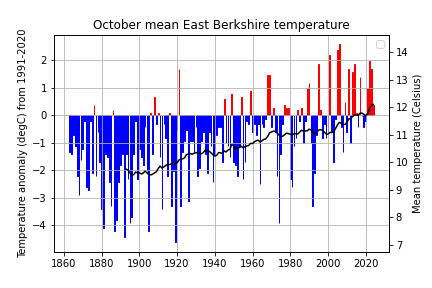
September October
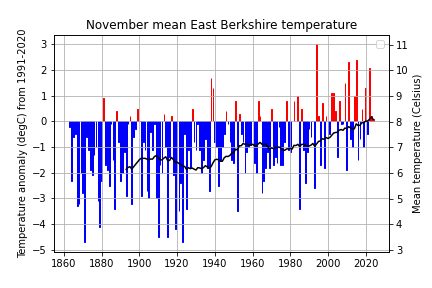
November December
Spring(MAM) Summer(JJA)
(Note that winter data are plotted according to the year of the December of the winter - thus the winter '2011-12' is shown as '2011'.)
Autumn(SON) Winter(DJF)
(Note that winter data are plotted according to the year of the December of the winter - thus the winter '2011-12' is shown as '2011'.)
Annual