The weather of the month so far
Note that whatever the current date, averages refer to the month as a whole. Thus by 10th June we might expect percentages of rainfall and sunshine to be around 33% (as we are one-third through the month) and the temperature anomaly to be slightly negative (as June tends to get warmer as the month unfolds). There is no significant monthly cycle in air pressure so the pressure anomaly is always a true reflection of the conditions up to the current date.Thanks are due to Sean Batty of STV weather; discussions with him provided me with the impetus to create these maps.
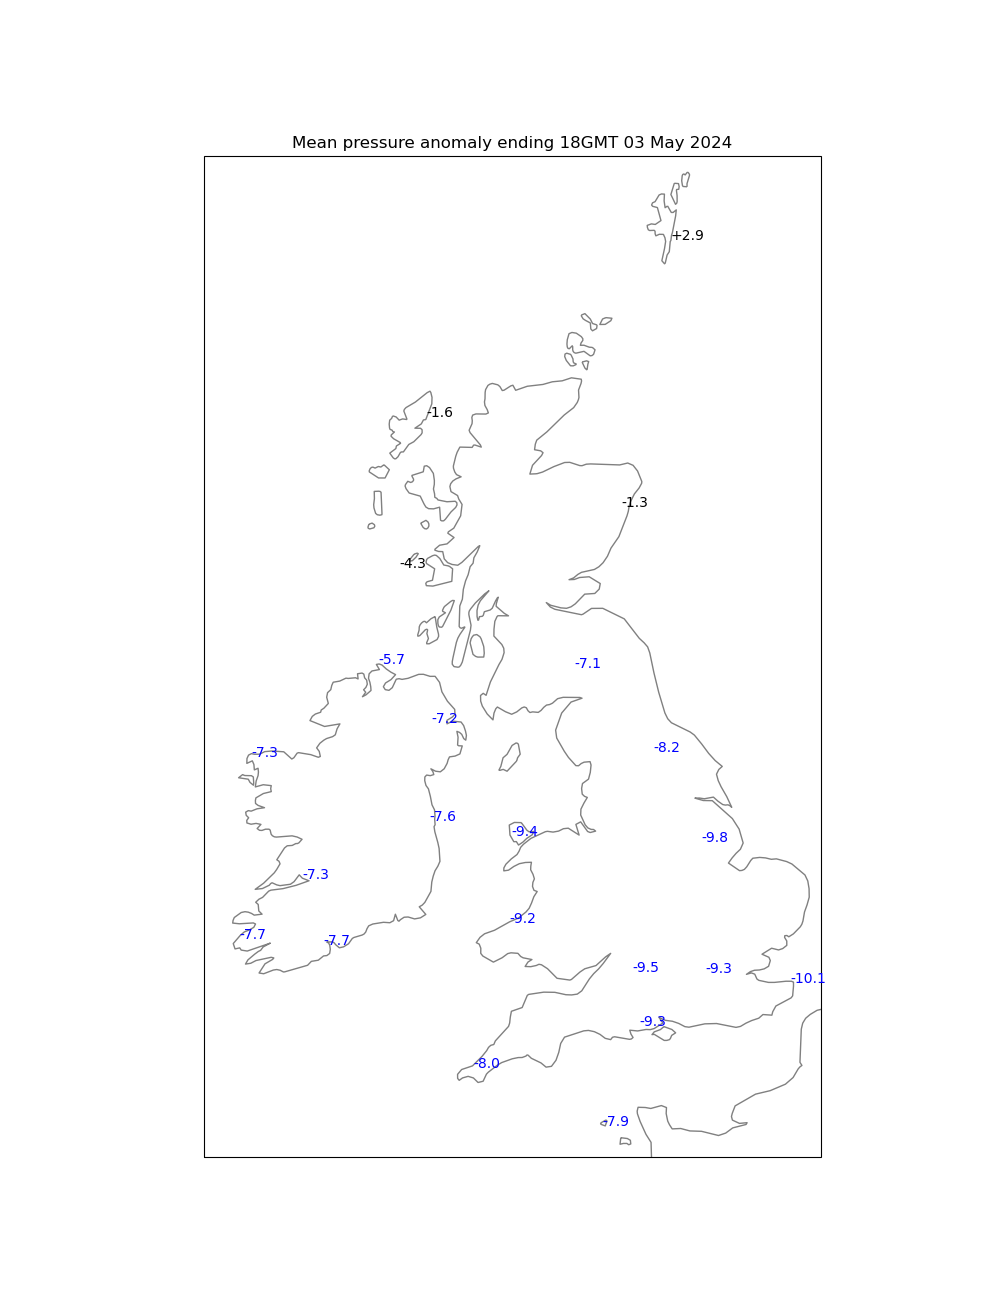
Select an image and then use the left mouse button to view a larger version of the image. All anomalies are with respect to 1991-2020.
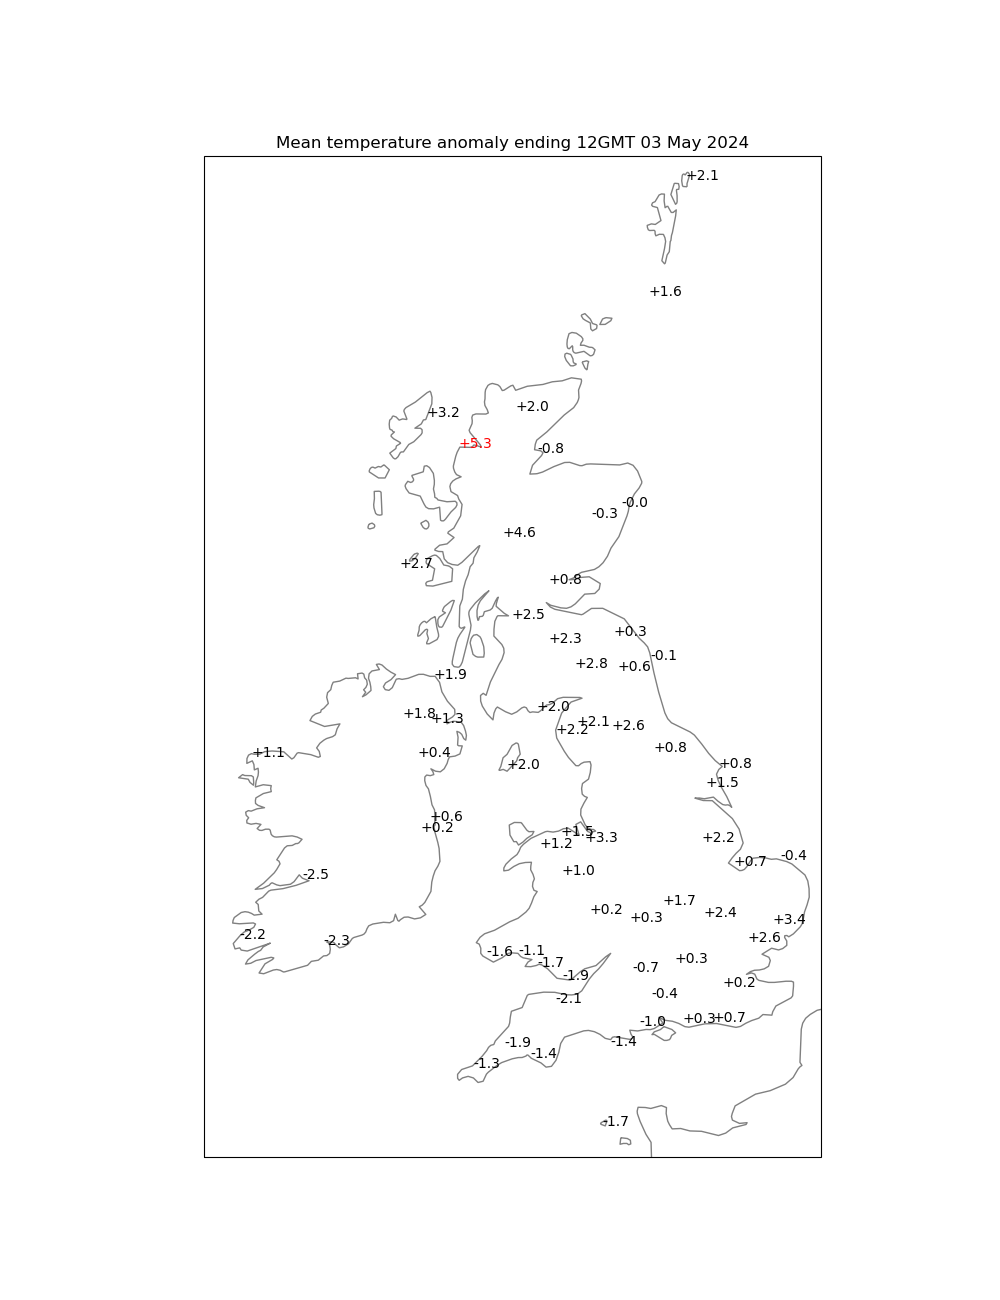
(Left) mean temperature (C) and (right) the departure from average

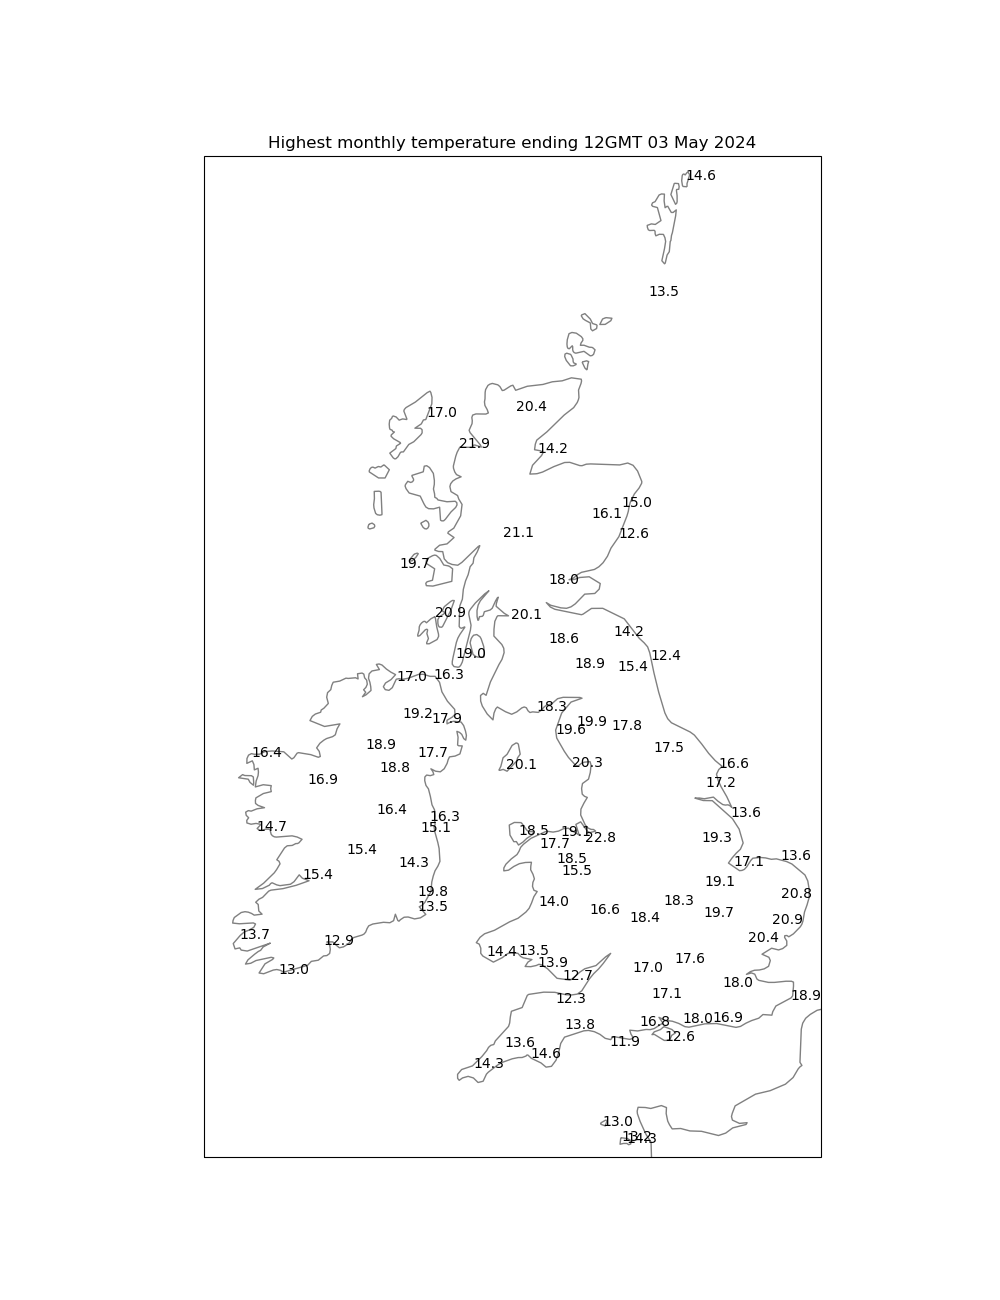
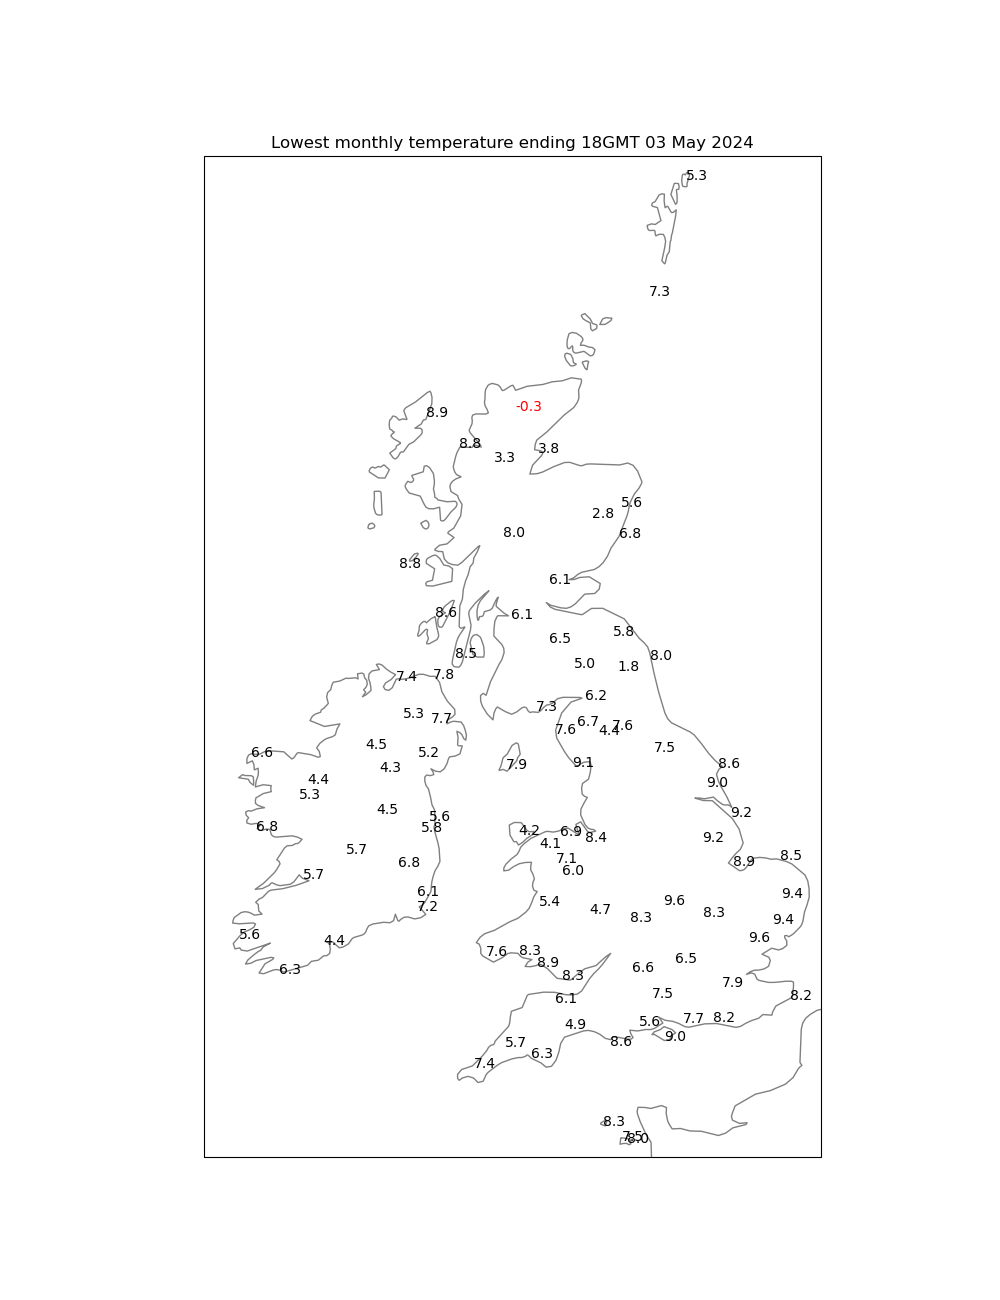
(Left) highest and (right) lowest temperatures (C) of the month
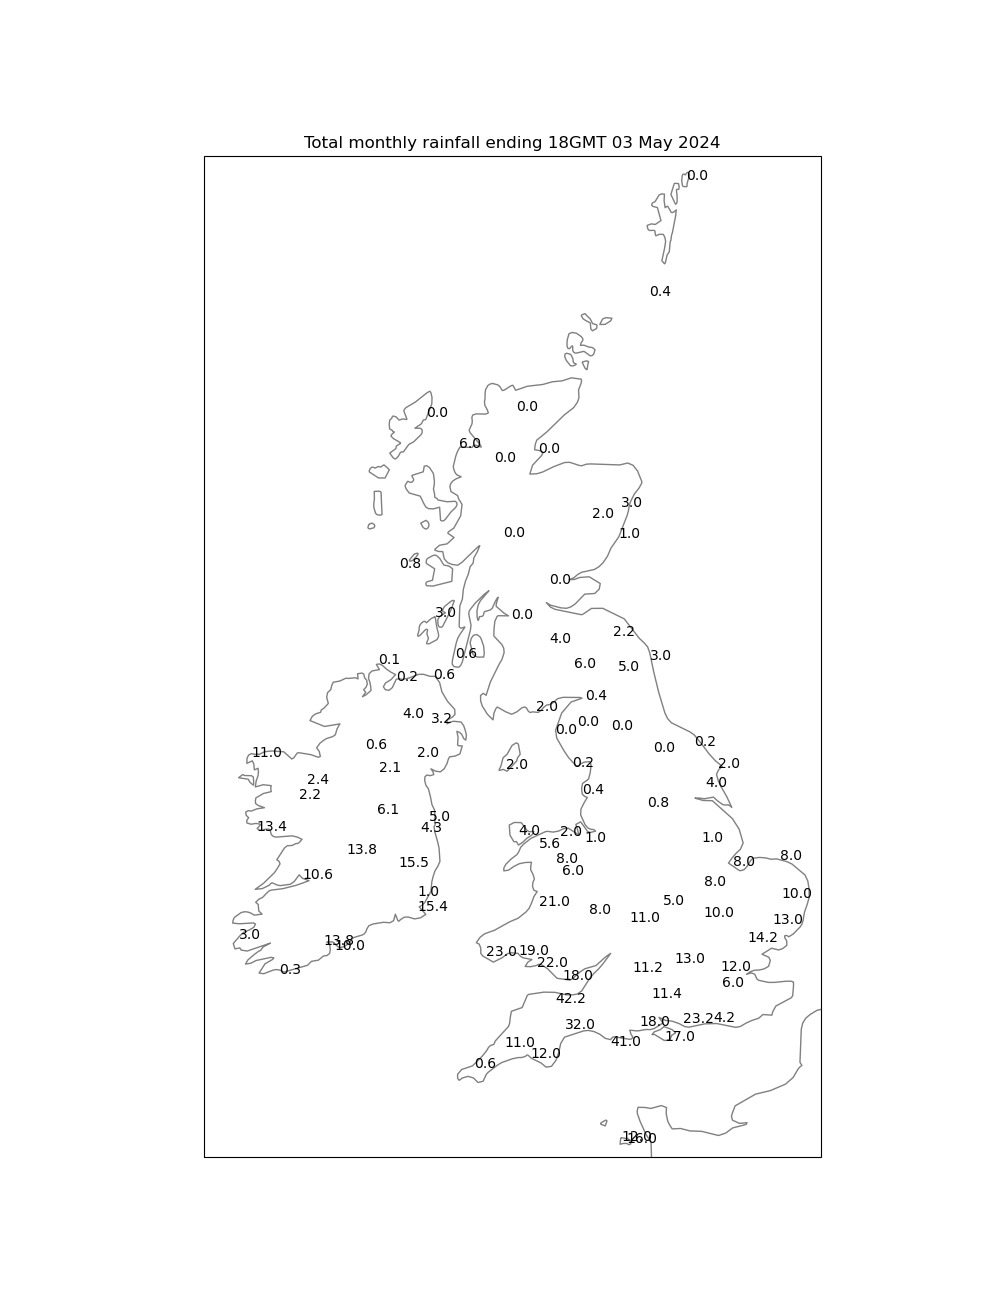
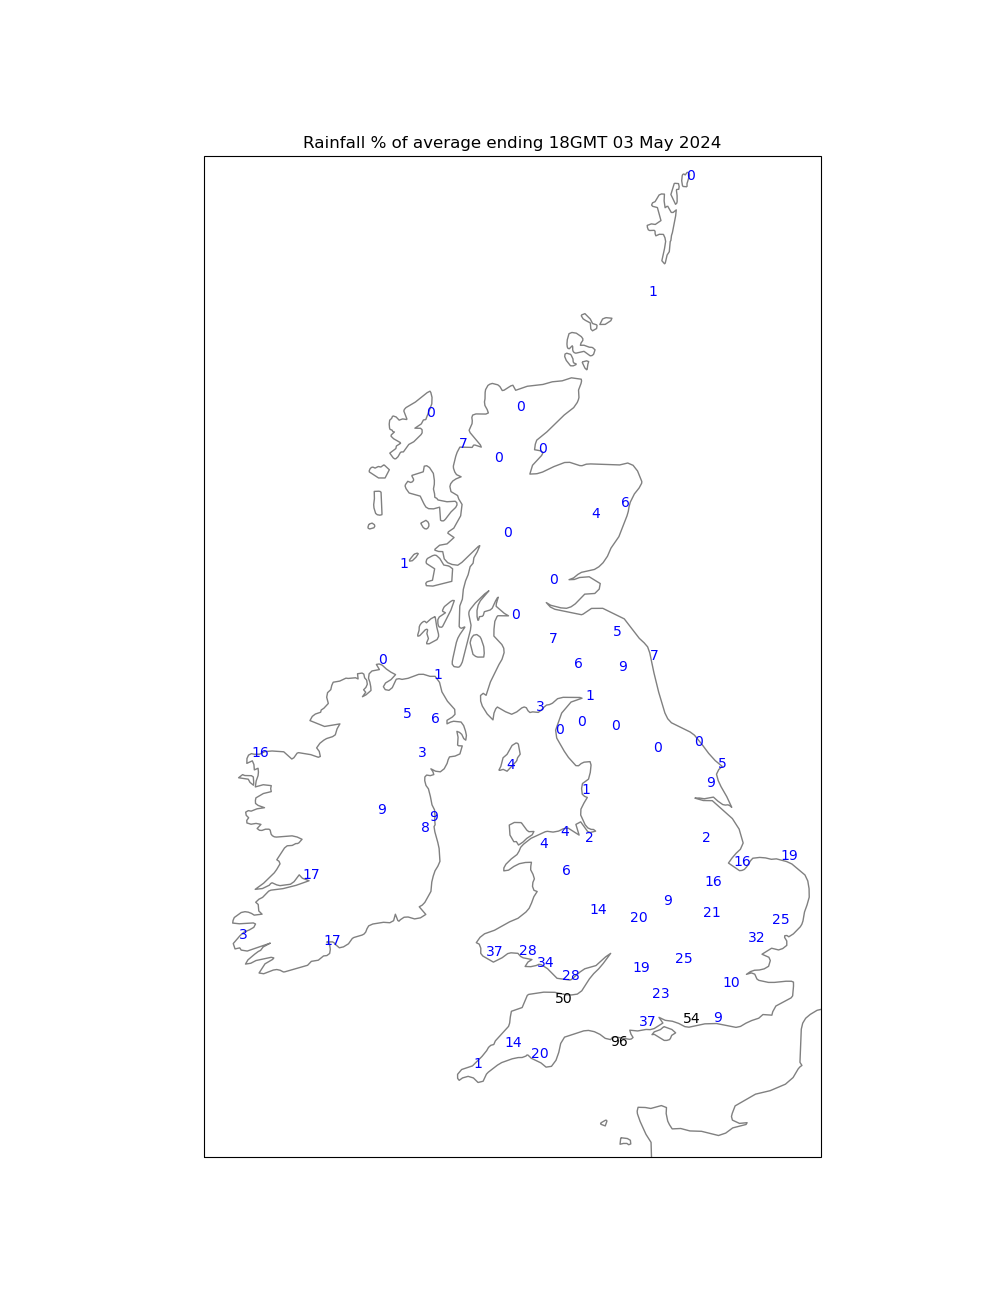
(Left) total rainfall (mm) and (right) the fall as a percentage of the average
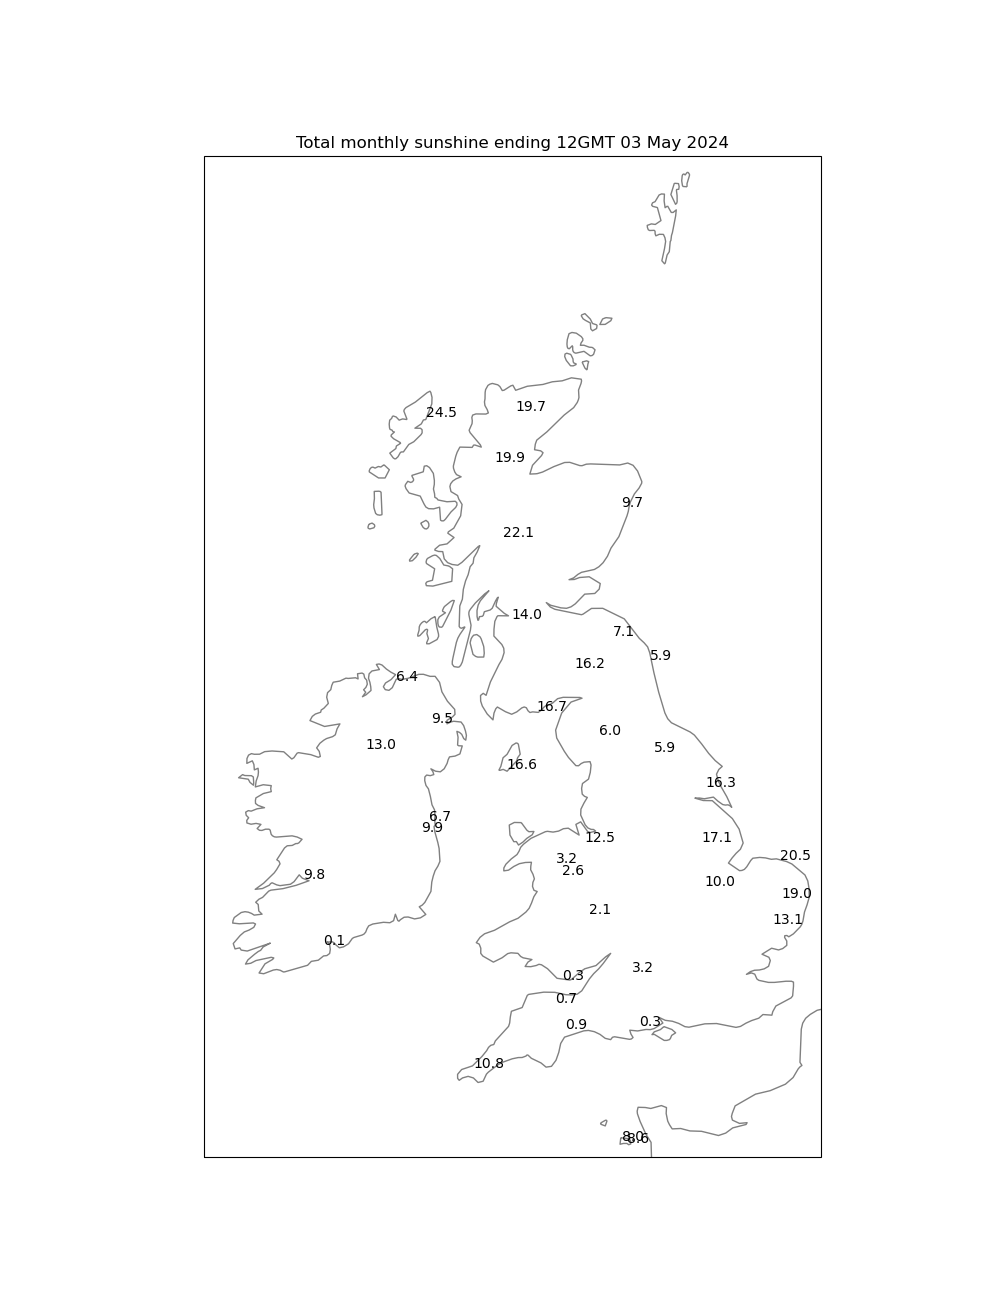
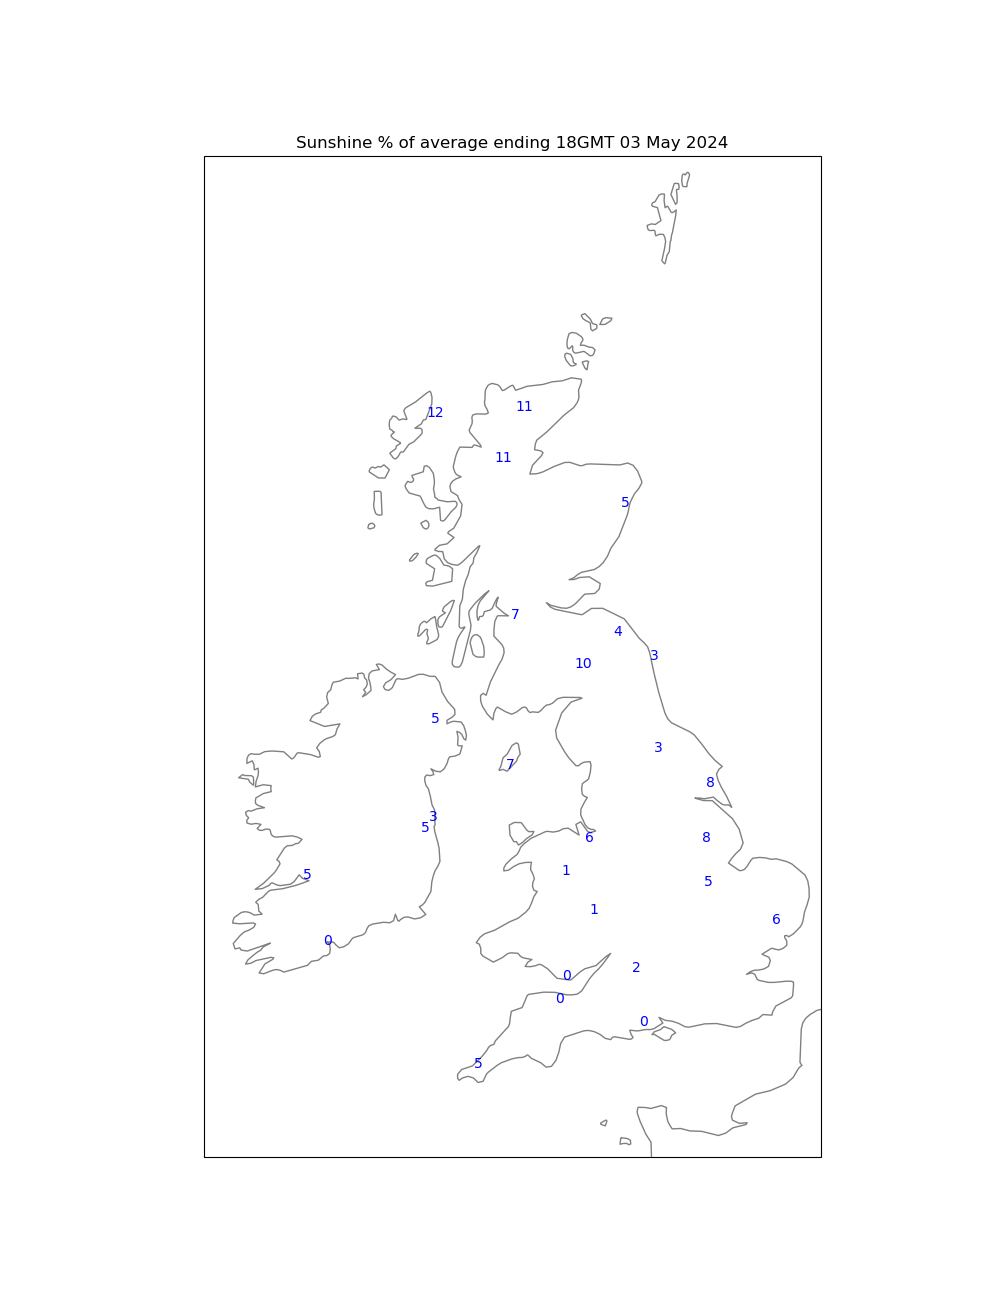
(Left) total sunshine (hours) and (right) the duration as a percentage of the average
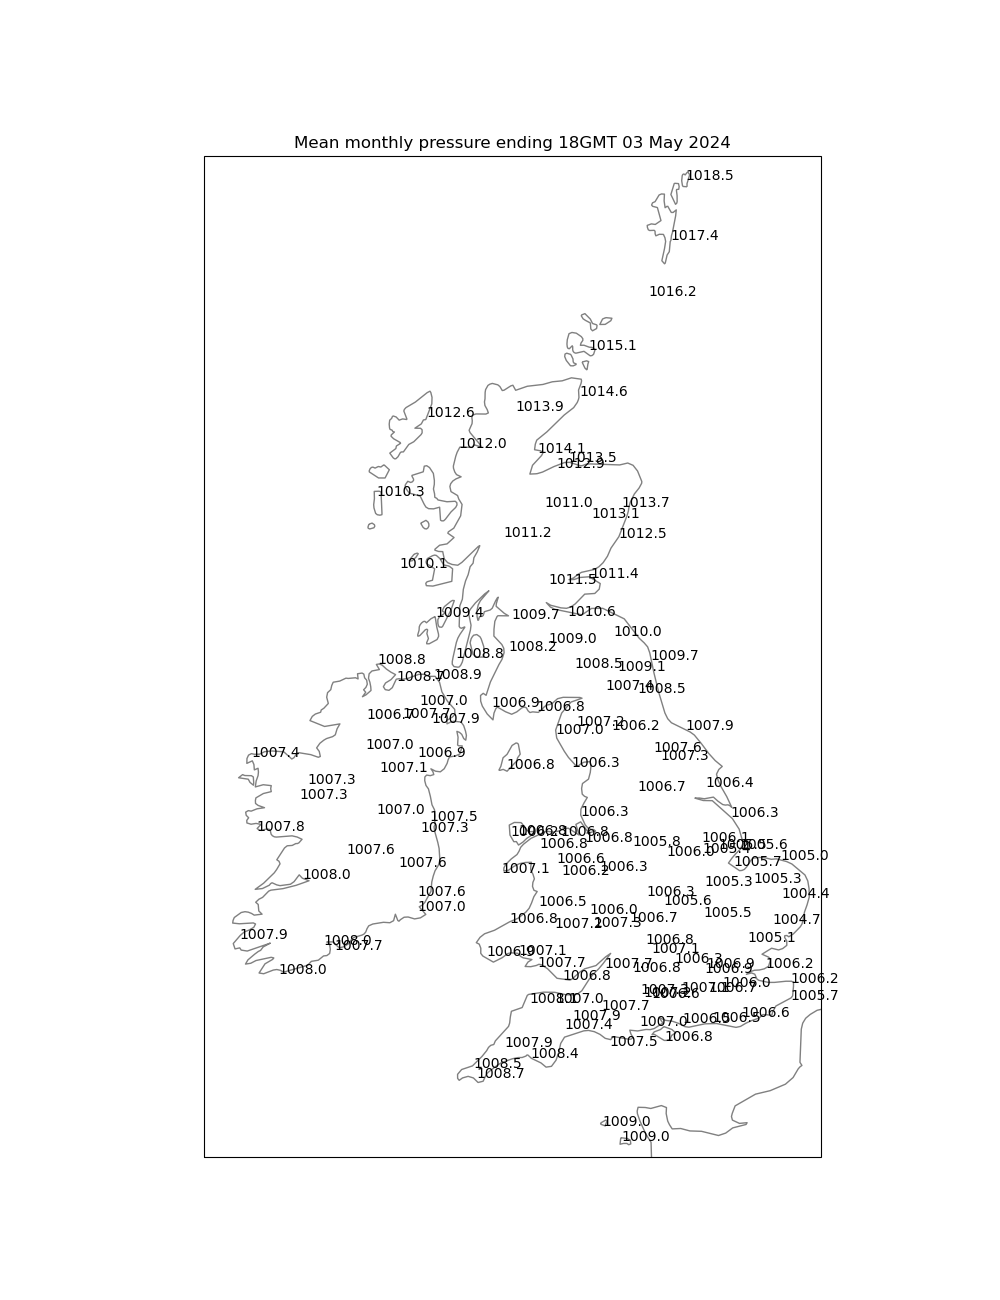
(Left) mean sea level pressure (mb) and (right) the deviation from average
Other useful links
- My homepage/surface charts
- Local weather:
- Maidenhead's recent weather and climate
- Reading's climate, 1991-2020
- Current UK/Ireland weather information:
- Maps:
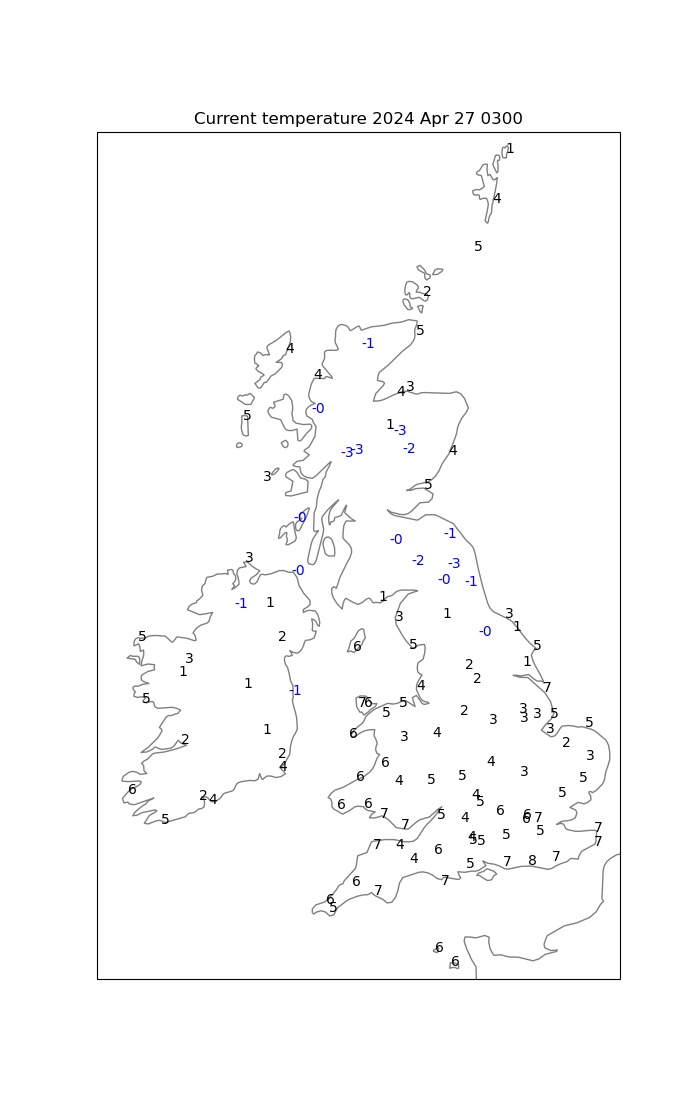
- Current temperature
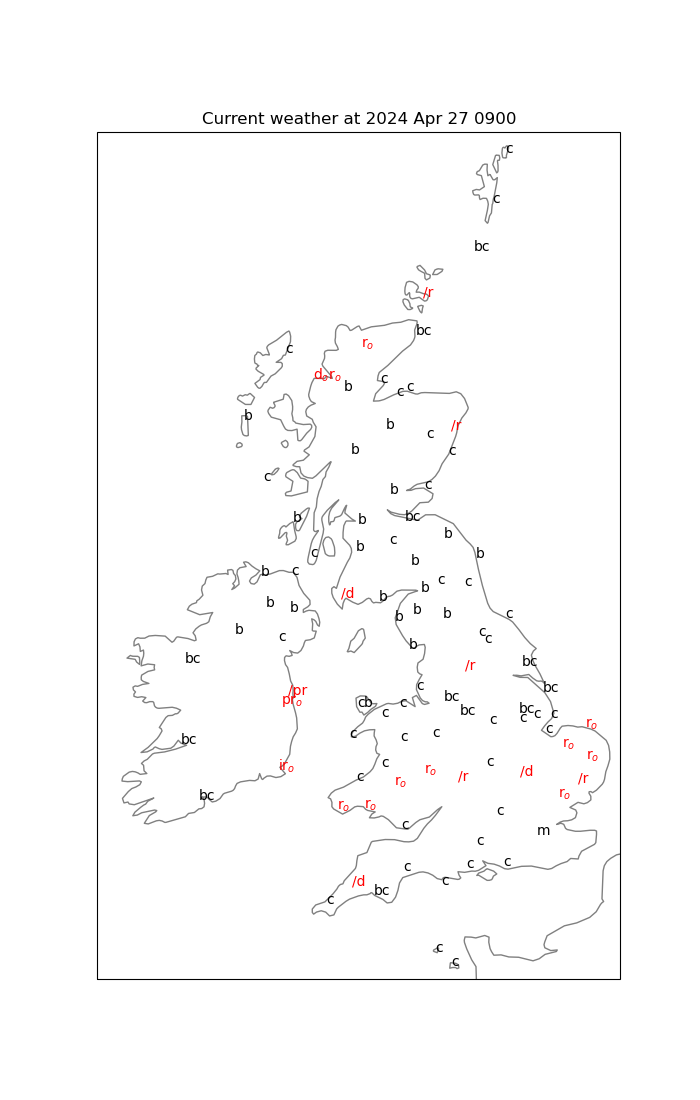
- Current weather
- Plotted daily extremes
- Current weather
- Monthly summaries:
- The month so far - text
- Last month - text
- The month so far - charts
- Last month - text
 August 2016: Details
and order form for this new book about weather observing.
August 2016: Details
and order form for this new book about weather observing.
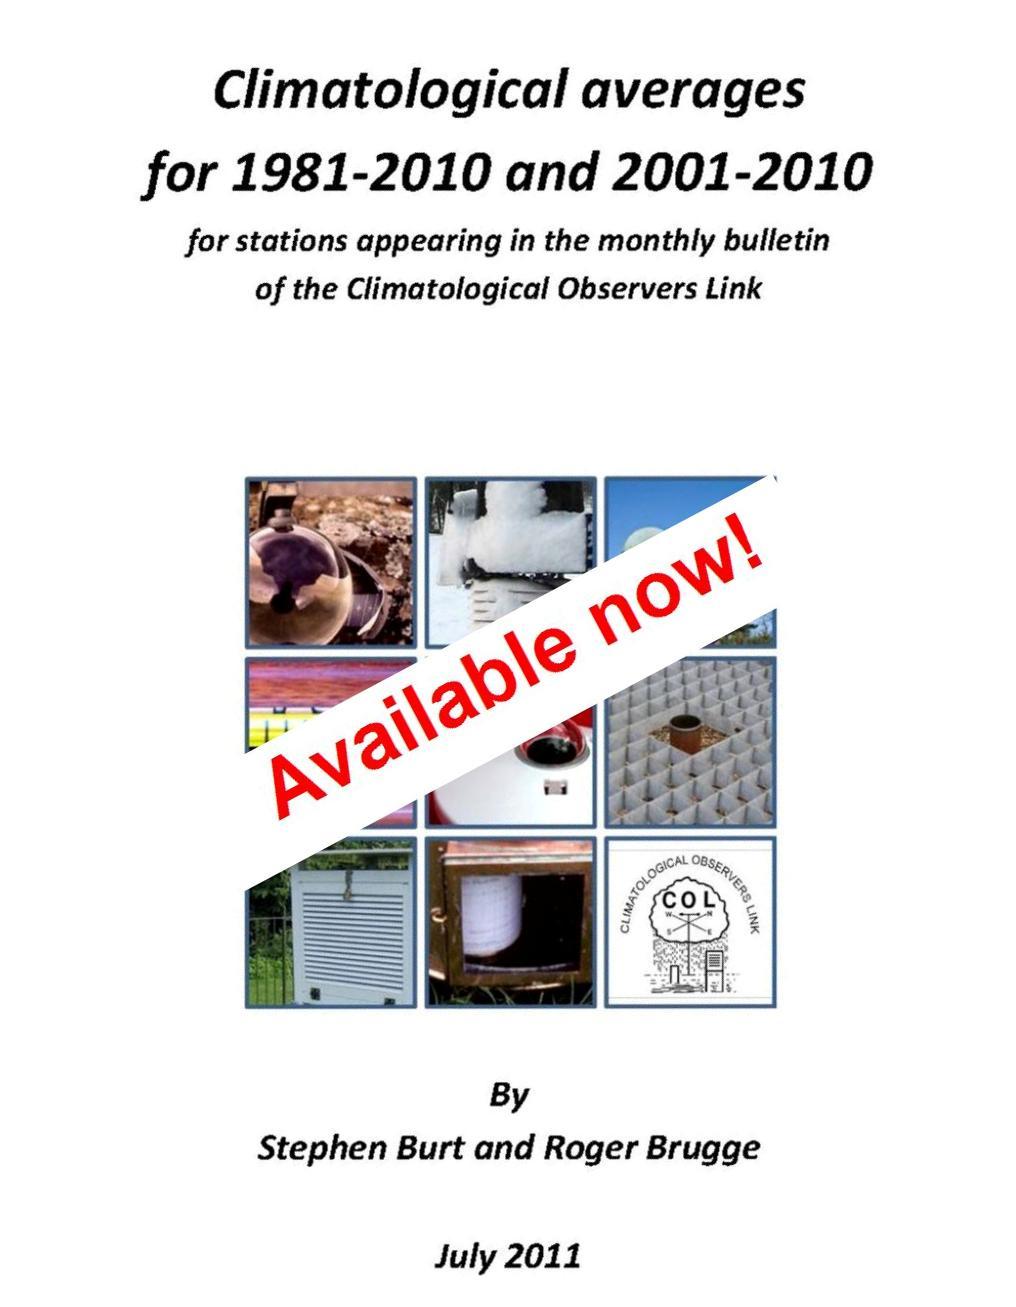 Details
and order form for this limited edition publication.
Details
and order form for this limited edition publication.
Met Dept Home
- My publications
- Maidenhead weather
- Current, recent and historical weather in Reading, Berkshire
- East Berkshire temperatures
- Maidenhead (Berkshire) rainfall
- UK weather diary
- Reading weather 'on this day in ...'
- World weather news stories
- Met-Jobs mailing list
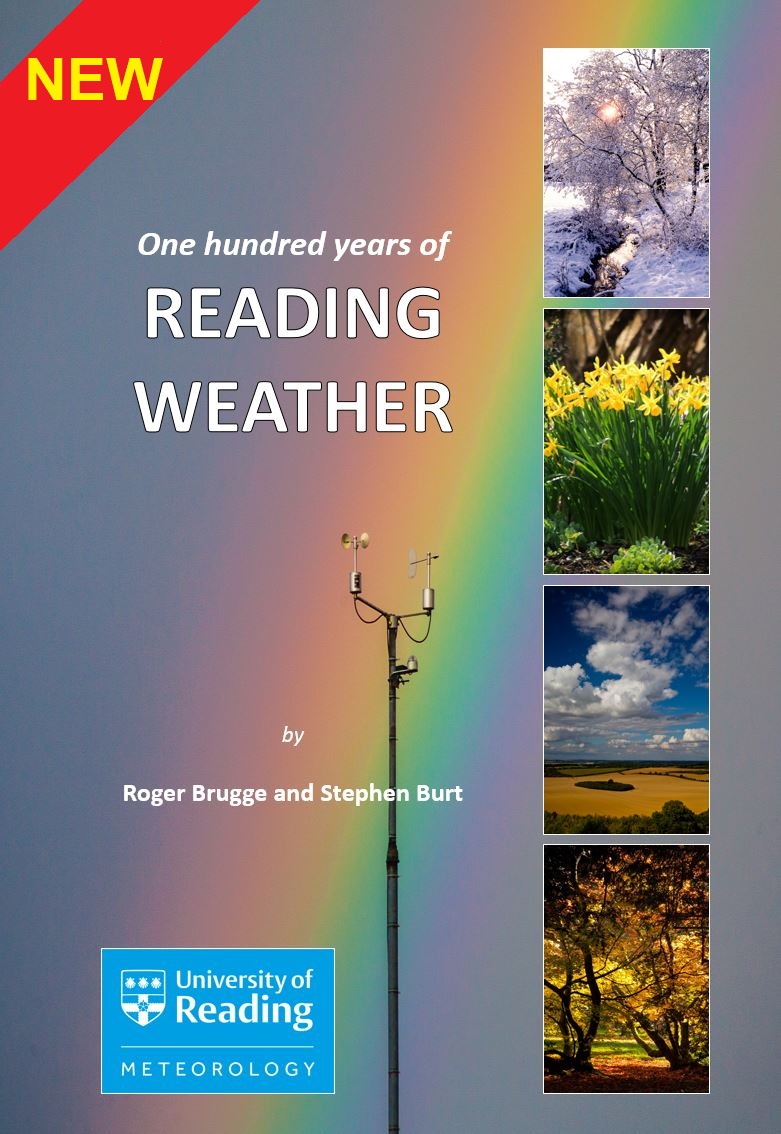 Read about and order this NEW book about the weather of Reading.
See also
Make your own weather observations? Then see the Climatological Observers Link
The Tornado and Storm Research Organisation
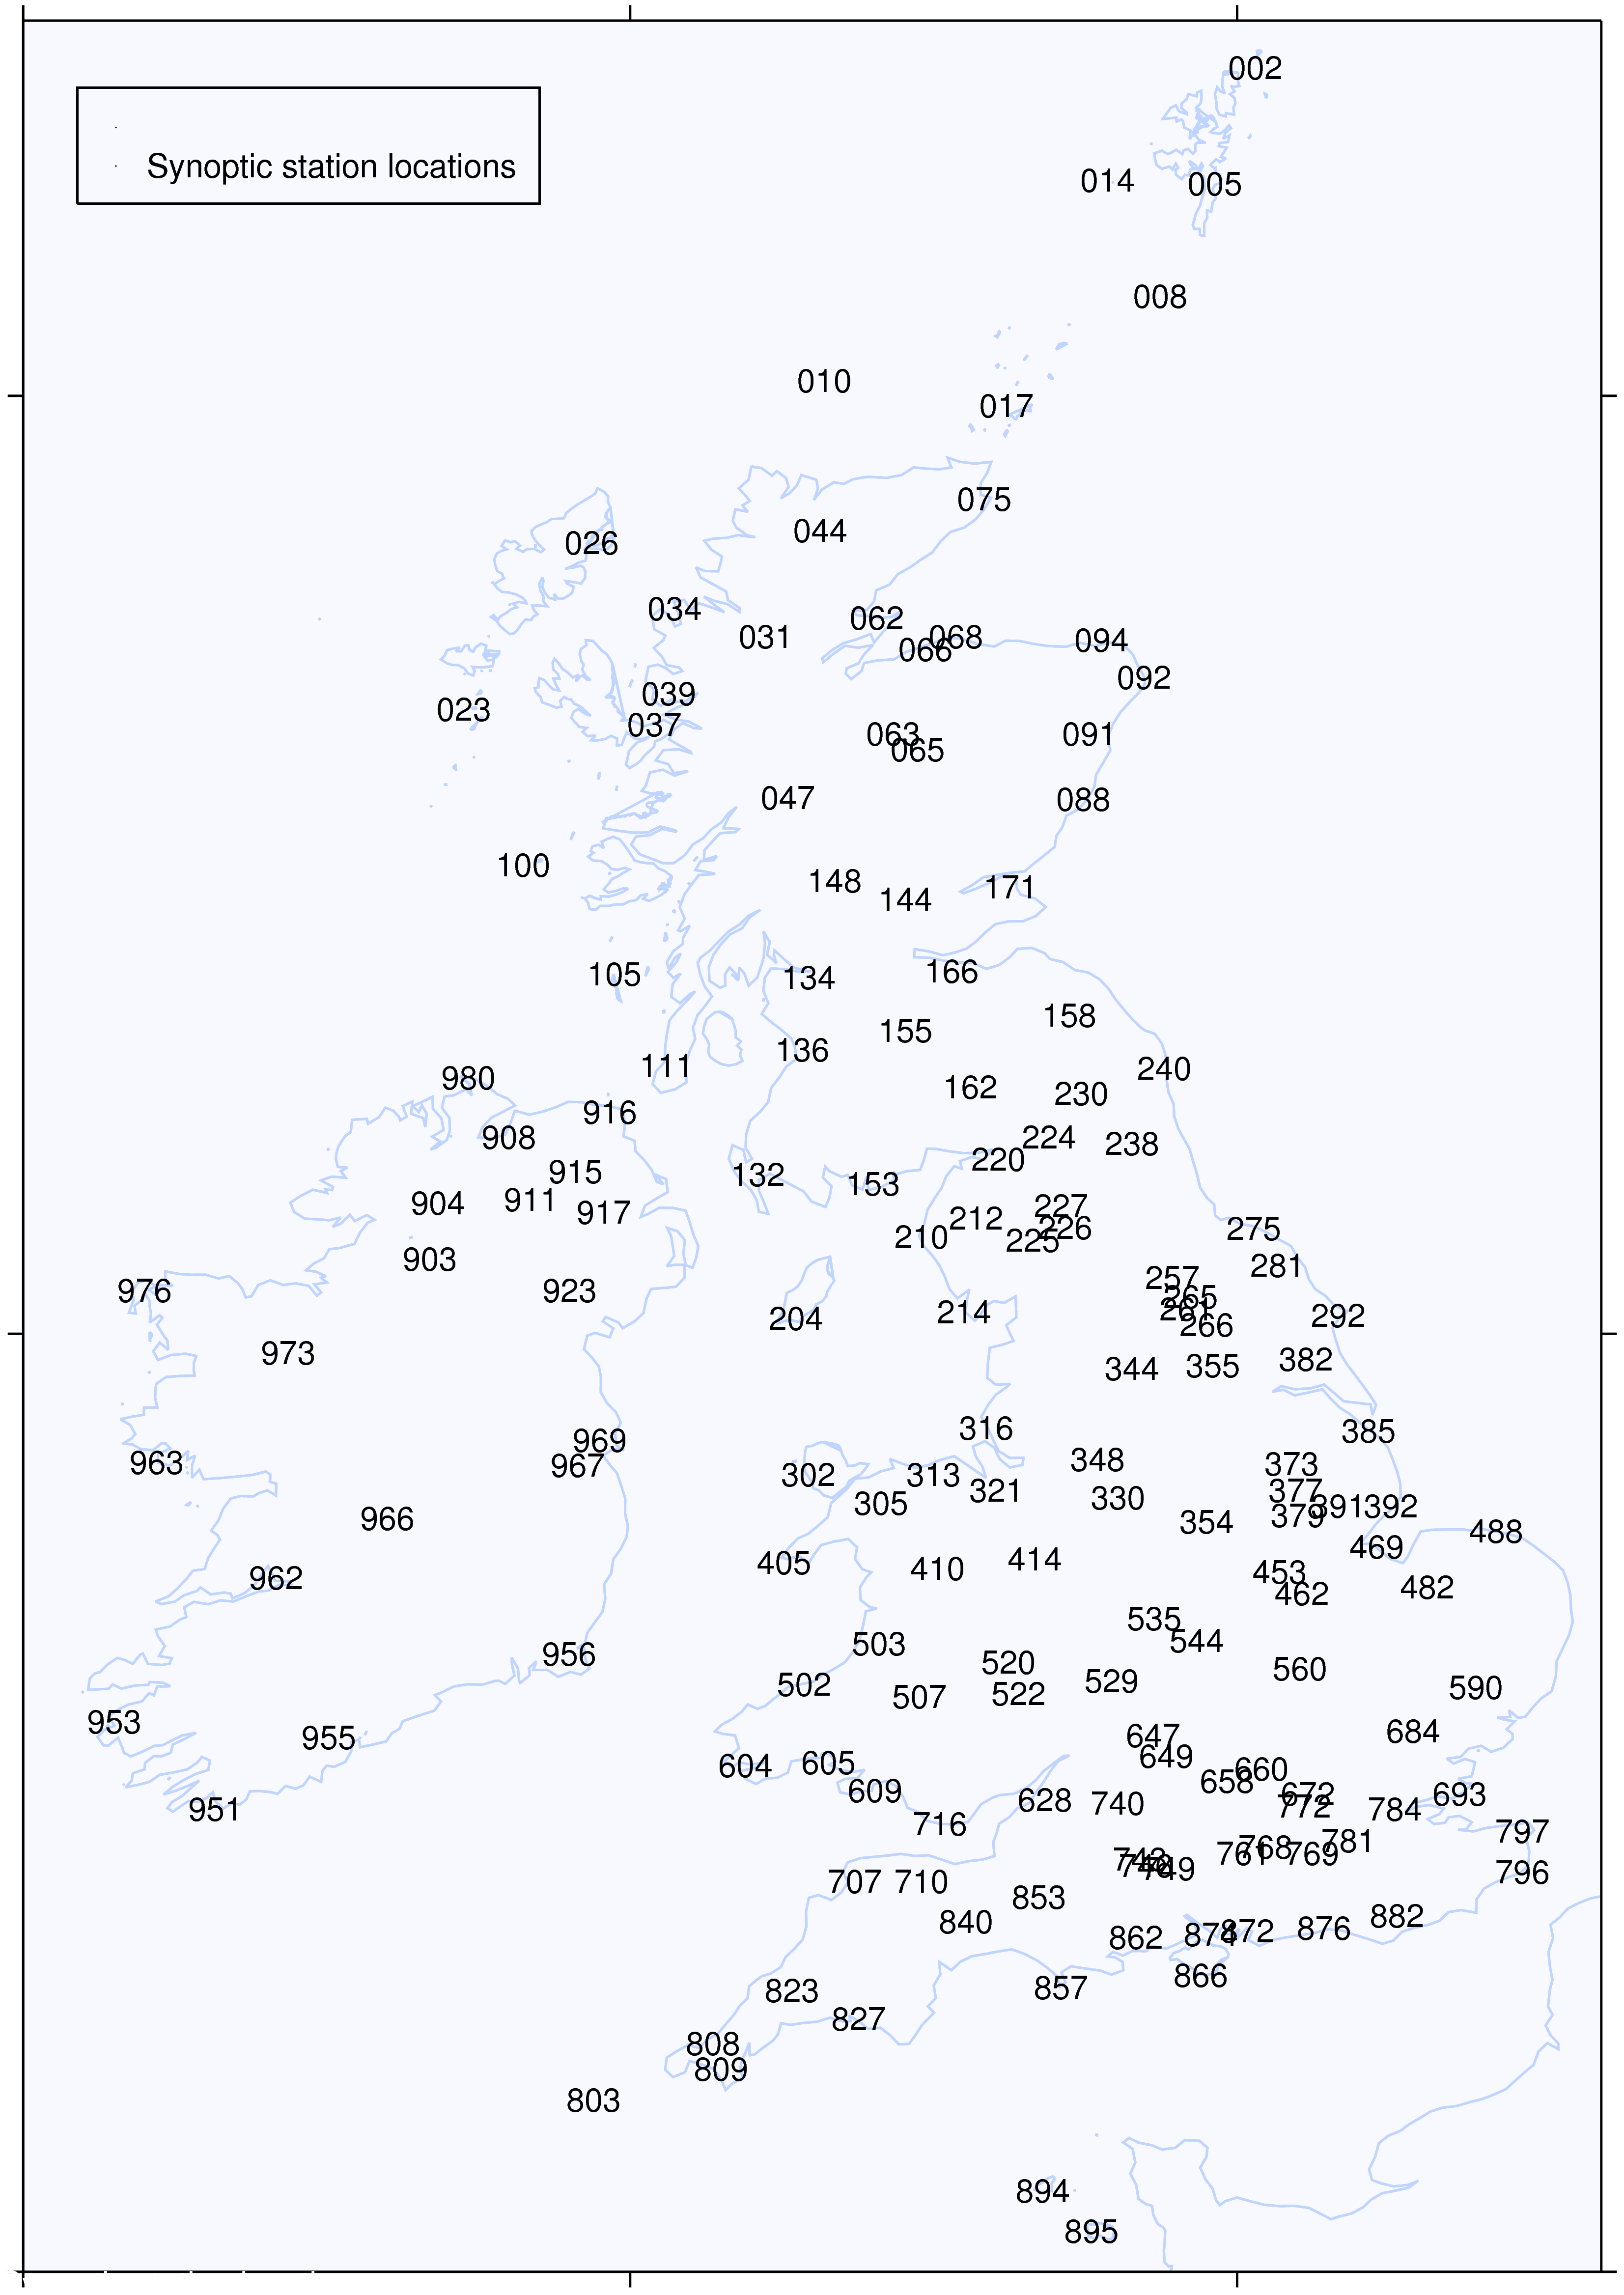
UK/Ireland synoptic station locations:
- Maidenhead weather