Analysis of maximum and minimum temperature forecasts provided by Roger Brugge at:- http://www.met.rdg.ac.uk/~brugge/forecast/
By Martin Rowley
- Period used: 18th June to 17th July, 2008
- Station use: Hurn airport, Bournemouth (03862)
SYNOPTIC-SCALE PATTERN
Jet often displaced well to south of its mean mid-summer position, though 'jinking' further north at times later in the period: a high zonal index with frequent incursions of frontal-wave depressions. Occasional trough extension post low pressure, with a mean MSLP flow WSW'ly with strongest flow across southern half of British Isles. Mean jet-level flow also WSW'ly with strongest flow south of 50degN.
MAXIMA
Using a convention [actual-minus-model], the mean difference across the 6 days was -0.31°C (SD varying between 1.35 at day 1 to 1.80 at day 6). The 'model' was therefore, on average, warmer than reality, with the difference broadly increasing with increasing lead-time.Looking at individual events, the overwhelming number of forecasts (between 24 out of 30 at D6 and 26 out of 30 at D1,D2,D3 & D5) were within 2degC of actual. Only 4 individual forecasts (out of 180) were >=4degC difference, which criterion would be regarded as a 'misleading' event. Three (out of 4) of these 'misleading' events were at either D5 or D6 (not surprising).
Model comfortably beat climatology (i.e. using the long-term/71-00 mean for each appropriate 10-day period): the mean difference between actual and 10-day mean was -0.96°C [SD 1.64], confirming the below-average nature of the 30-day spell. Only at D6 was the SD of the model/actual worse than mean/actual, again confirming my suggestion that at around D6, model output might not always give a decent steer (compared with climatology for example).
I looked at persistence for D1, D2 and D3.
... Surprisingly (to me anyway), this model ONLY JUST beat persistence at D1, i.e., using yesterday's maximum as today's forecast. The mean difference [actual-minus-model] for D1 = -0.08, as against the mean difference [actual/prev.day-minus-actual/today]. The SD difference was not so good (for 'persistence'), where SD model = 1.35degC, SD persistence = 1.90degC. ... At D2, the mean difference (persistence) was better than the model (-0.13degC/persistence; -0.24degC/model), but the spread (as measured by the SD) was much tighter/better with the model output. ... By the time we get to D3, then persistence offers no help and the model is clearly a better guide.
MINIMA
Using a convention [actual-minus-model], the mean difference across the 6 days was +0.62°C (SD varying between 2.22 at day 1 to 2.89 at day 6). A poorer outcome w.r.t. maximum temperatures (above). The 'model' was therefore, on average, colder than reality, with the difference irregularly increasing with increasing lead-time. With SD >2 at all time-steps, and nearly 3 at D5 & D6, it does give the first clue that for Hurn at least, this method is struggling to provide 'useful' guidance. Your 'all-series' verification up to D6 is broadly 2degC or less, so the problem is probably 'Hurn specific'.Looking at individual events, then in contrast with the maximum series, the model is having difficulty with it's forecast minima for Hurn. Only at D1 (i.e. the day that the forecast was produced) was the error <=2degC on just half of occasions; it then dropped to roughly a third of events meeting this criterion (i.e., a 'useful' forecast) & for operational purposes this would not be considered acceptable.
Despite the problems above, the model did beat climatology (i.e. using the long-term/71-00 mean for each appropriate 10-day period): the mean difference between actual and 10-day mean was +0.90°C [SD 3.07]; minima generally during this spell was above-average for the 30-day spell.
As regards persistence (to D3), then the model (and climatology) were better than same, with SD 4.38 at D1, 4.74 at D2 and 4.50 at D3.
GENERAL COMMENTS
Because the input data are based on a 1 x 1deg grid, and effectively 'regressed' to each station by using recent observations to 'correct' for bias, a lot depends upon the location of the site with respect to 'other' influences: as you have pointed out, coastal/near-coastal stations will have particular problems, as a bias assessed given one situation (wind direction, cloud cover, state of ground etc.) may not apply, even for the following day. Hurn is one such site: with wind flow from the south, then it behaves as a coastal site, but with heavy modification by the building infrastructure of the Poole-Bournemouth-Christchurch population centre; with wind flow from the north, then it behaves as a rural inland site, with the fact that the soil type is light, sandy, free-draining a major factor.During the period under consideration, given the mean WSW'ly gradient flow, the surface wind favoured a S or SW'ly type, and this is reflected in the data that shows that the actual minima were, on average, nearly a degree C above 'normal'. The larger errors of minima (>=4degC) appeared to be associated with air-mass changes where the model, on a 1 x 1deg grid, might have a great difficulty given that the baroclinic zone (polar front) was floating about in the southern Britain / English Channel area at the time.
- Martin Rowley
- 18 JUL 2008
Comments?
Your comments are welcome, and can be posted to me. I will forward them to Martin.
Other useful links
- My homepage/surface charts
- Local weather:
- Maidenhead's recent weather and climate
- Reading's climate, 1991-2020
- Current UK/Ireland weather information:
- Maps:
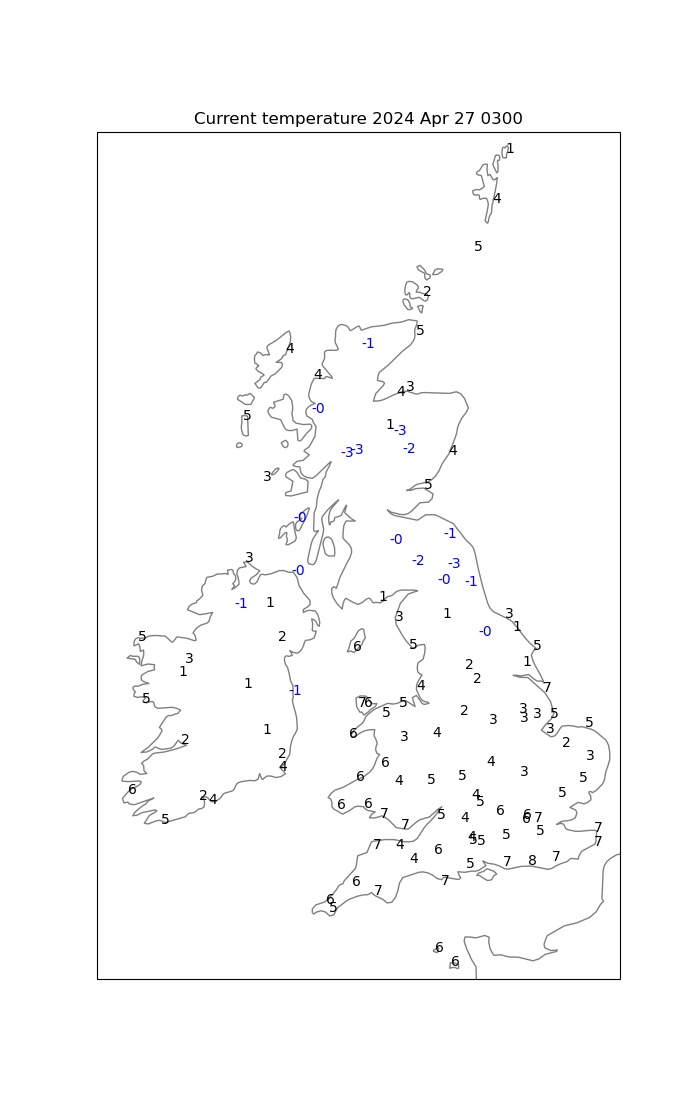
- Current temperature
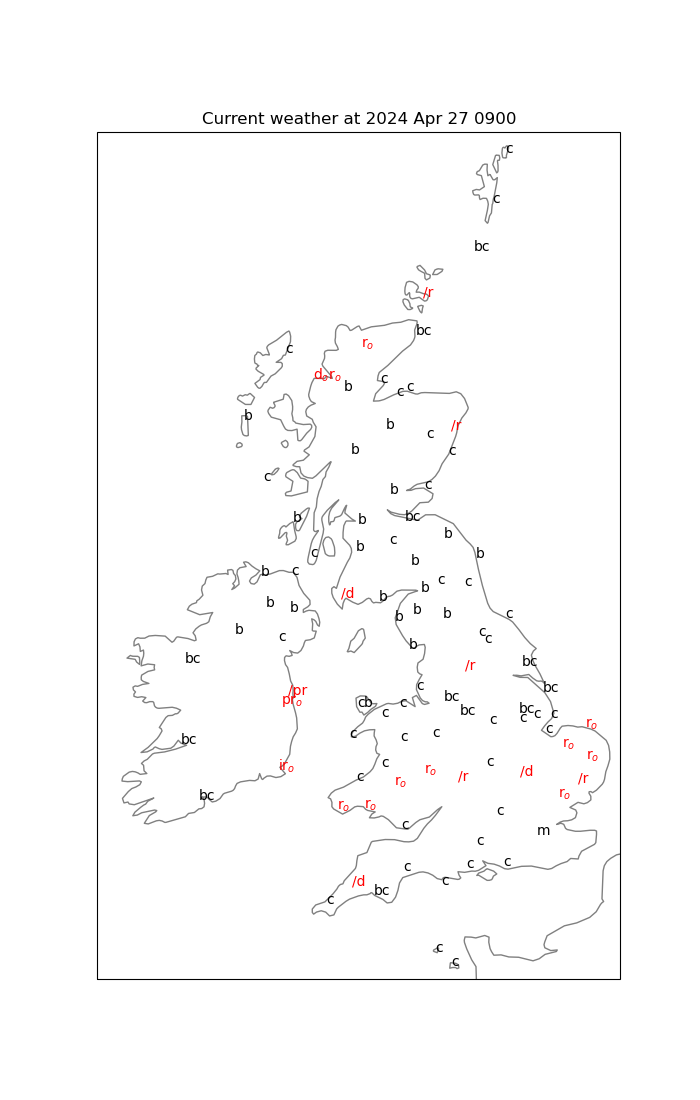
- Current weather
- Plotted daily extremes
- Current weather
- Monthly summaries:
- The month so far - text
- Last month - text
- The month so far - charts
- Last month - text
 August 2016: Details
and order form for this new book about weather observing.
August 2016: Details
and order form for this new book about weather observing.
 Details
and order form for this limited edition publication.
Details
and order form for this limited edition publication.
Met Dept Home
- My publications
- Maidenhead weather
- Current, recent and historical weather in Reading, Berkshire
- East Berkshire temperatures
- Maidenhead (Berkshire) rainfall
- UK weather diary
- Reading weather 'on this day in ...'
- World weather news stories
- Met-Jobs mailing list
 Read about and order this NEW book about the weather of Reading.
See also
Make your own weather observations? Then see the Climatological Observers Link
The Tornado and Storm Research Organisation
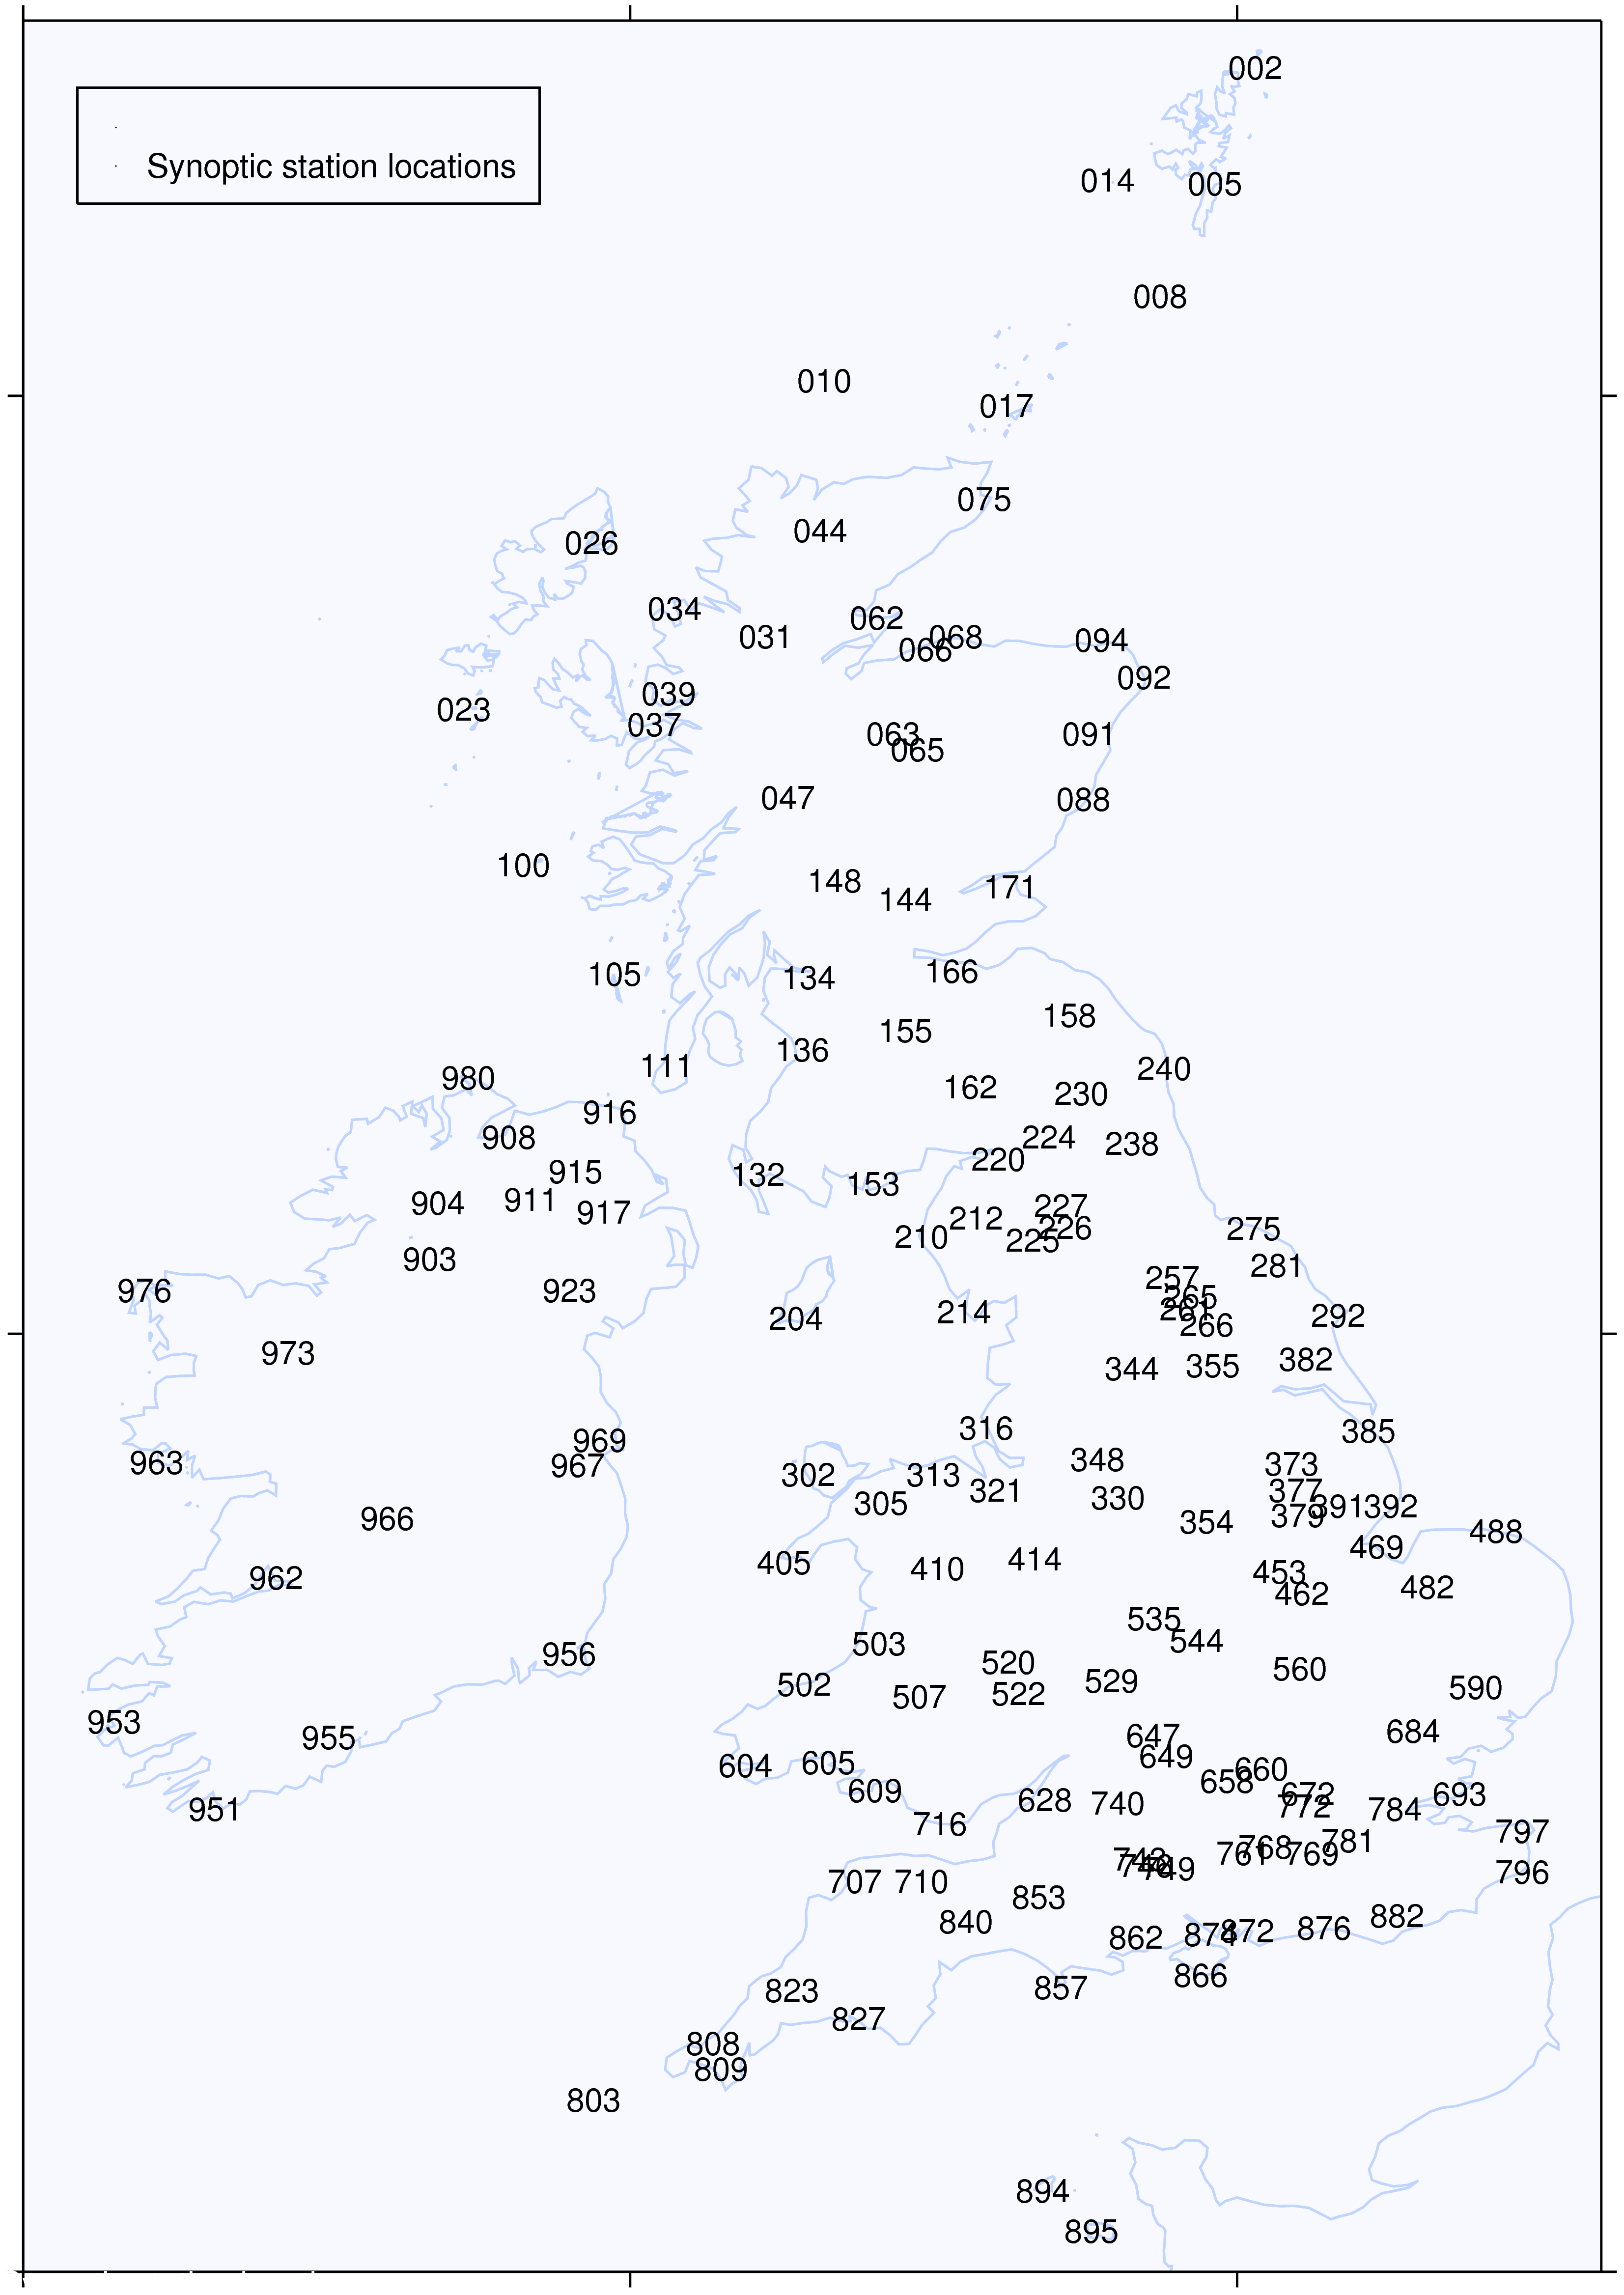
UK/Ireland synoptic station locations:
- Maidenhead weather