|
|
|
ITOP Plots of the Day
Selected plots are posted here daily by the ITOP-UK group. They are
intended as discussion points for flight planning purposes.
In addition you can view
forward trajectories from the P3, DC8 and BA146 flight tracks during the ICARTT experiment.
Posted 27/7/04.
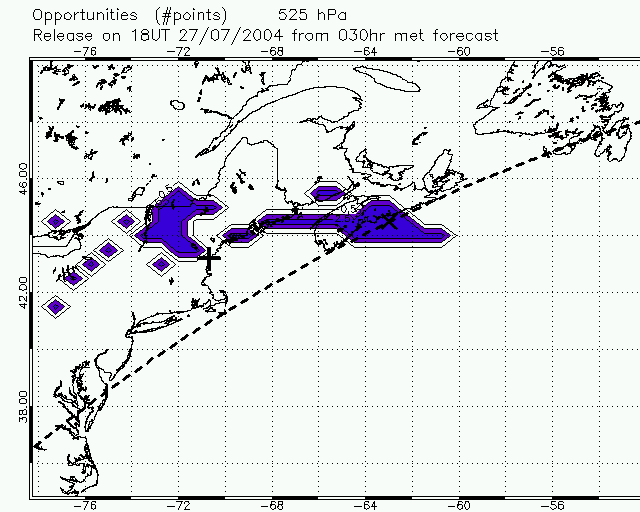
Fig.1: US domain at 18UT 27 July. Lagrangian opportunities highlighted on the 525 hPa level. Note that the opportunities are on a lower level than in the T+54 forecast. If 1.5 < n <2.5, there are two-point opportunities (US-Azores or US-Europe) and if n > 2.5, there are three-point opportunities (US-Azores-Europe).
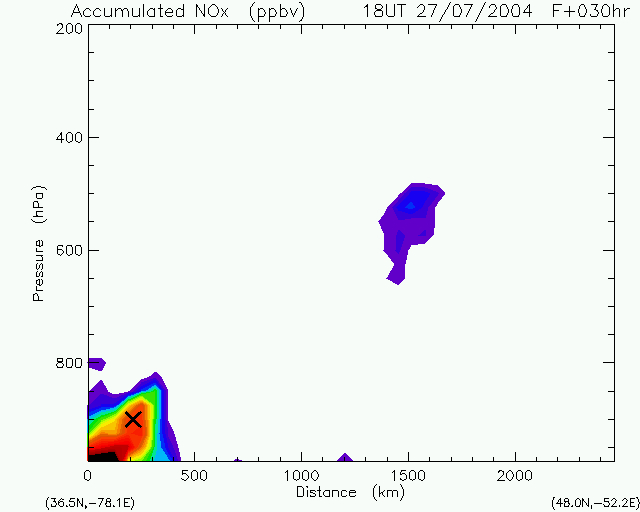
Fig.2: Section along the dashed line in Fig.1 showing accumulated NOx. The high level 3-point opportunity in the WCB heading for the Azores on 28 July is located at x=1500km on the section and trajectories are shown in Fig.3. The high tracer in the bottom, left marks a low level opportunity travelling slowly towards the Azores, some of which may head towards Europe. Its location is marked by the cross on Fig.4 and the trajectories are shown in Fig.5.
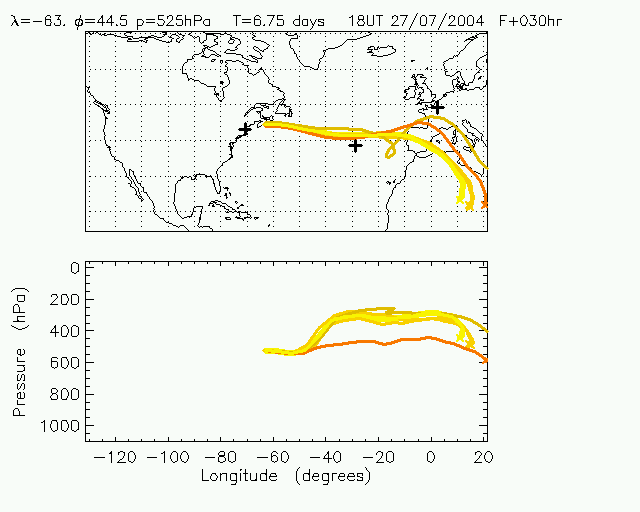
Fig.3: Forward trajectories for the high level opportunity (the cross on Fig. 1).
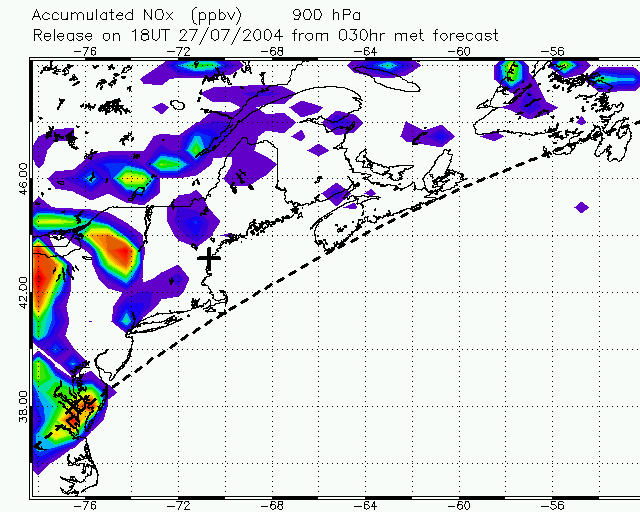
Fig.4: NOx emissions tracer on 900hPa. The low level target is at 38N, 76W.
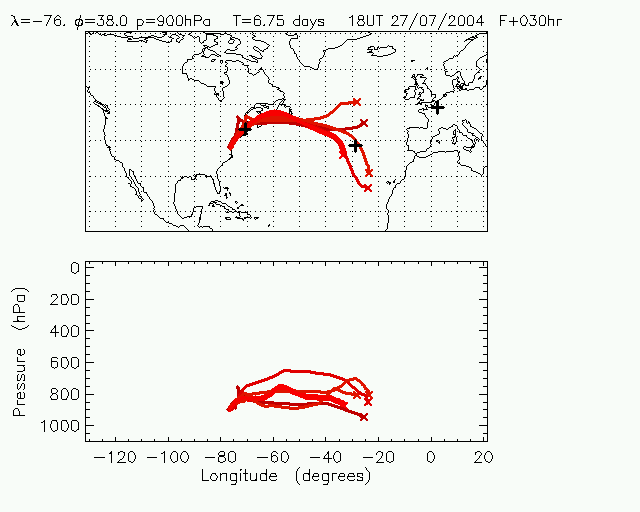
Fig.5: Forward trajectories (6.75 days) representative of the low level opportunity.
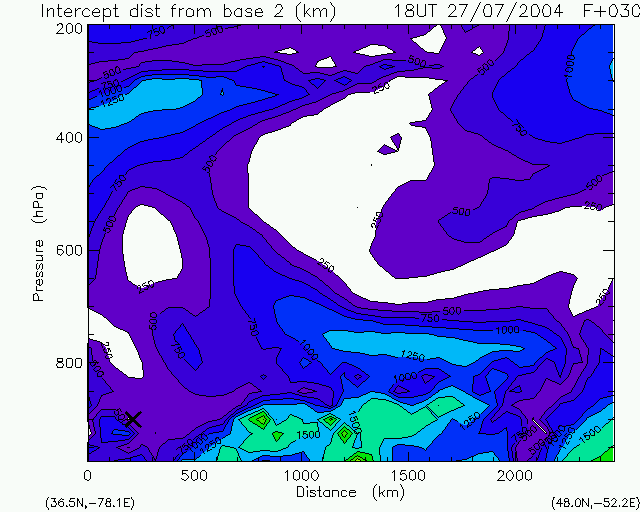
Fig.6: Section along the dashed line in Fig.1 showing closest approach of forward trajectories to Faial, Azores.
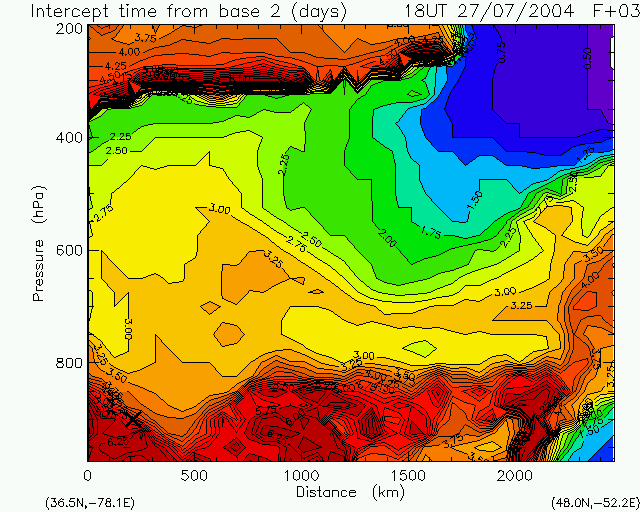
Fig.7: Section along the dashed line in Fig.1 showing the time of closest approach of forward trajectories to Faial, Azores. The high level opportunity reaches the Azores on the morning of 29 July. The low level opportunity coincides with a strong gradient in transit times (ranging from 6 to 3.5 days decreasing with height - 31 July onwards).
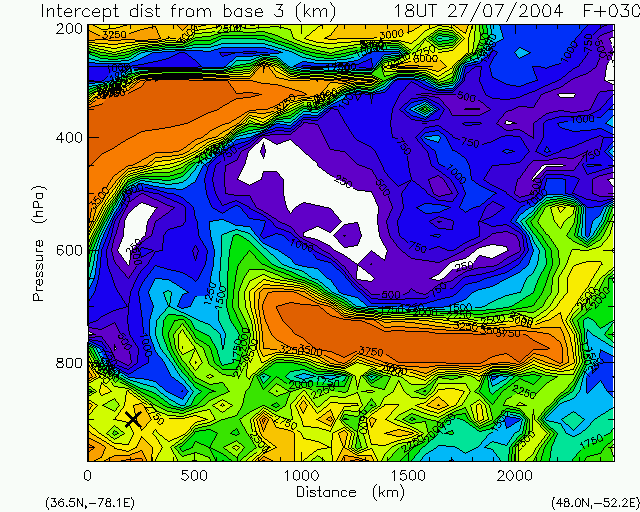
Fig.8: Section along the dashed line in Fig.1 showing closest approach of forward trajectories to Creil, France. The high level opportunities pass close to France. The low level opportunities only head for Europe at 850hPa (4000 feet) and above.
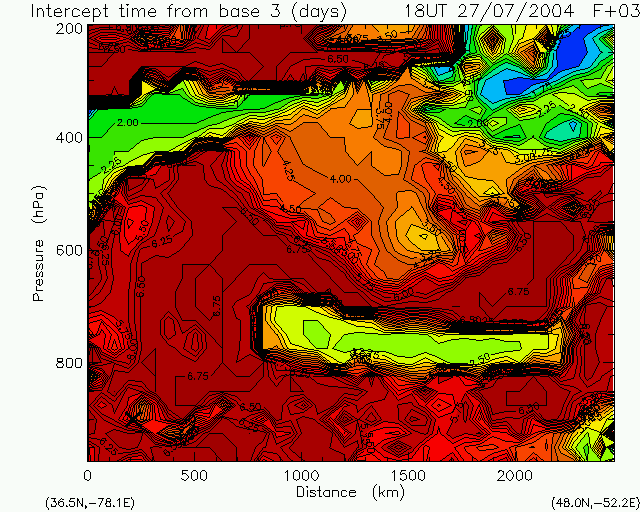
Fig.9: Section along the dashed line in Fig.1 showing time of closest approach of forward trajectories to Creil, France. The upper level opportunity reaches France on 31 Jul - low level on 2-3 August.
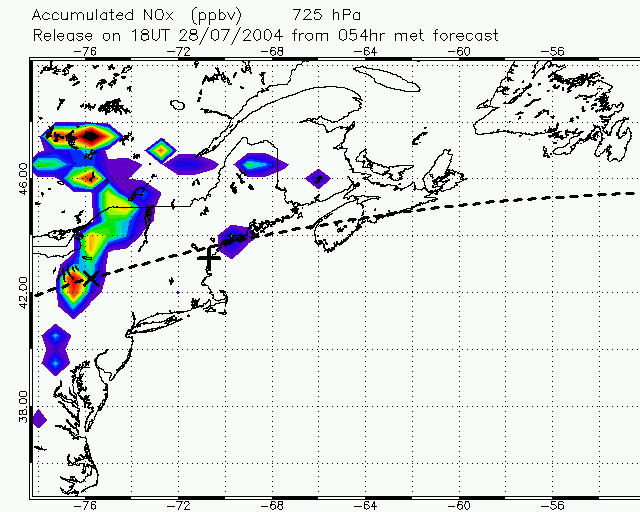
Fig.10: US domain at 18UT 28 July. Nox emissions tracer on 725hPa (8000feet).
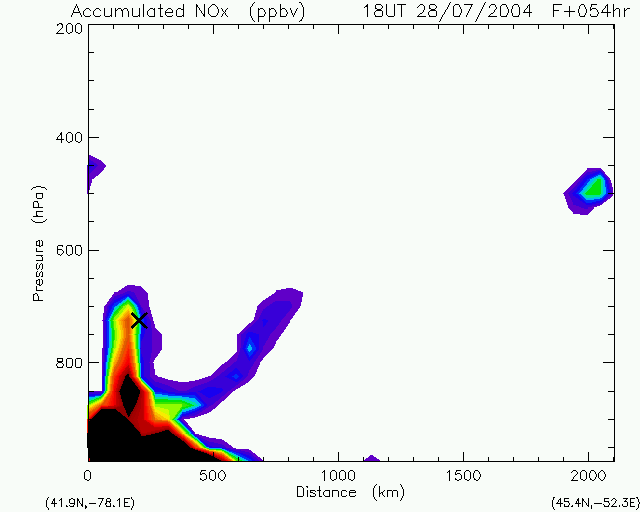
Fig.11: Section along the dashed line in Fig.10 showing accumulated NOx. Trajectories forward from feature at 200km are shown in Fig.12 (heading for Spain). Trajectories forward from sloping feature shown in Fig.13. High level feature south of Newfoundland is the back edge of the high level export event (trajectories shown in Fig.14). Will be flown through by DC8 on transit towards comparison with BA146.
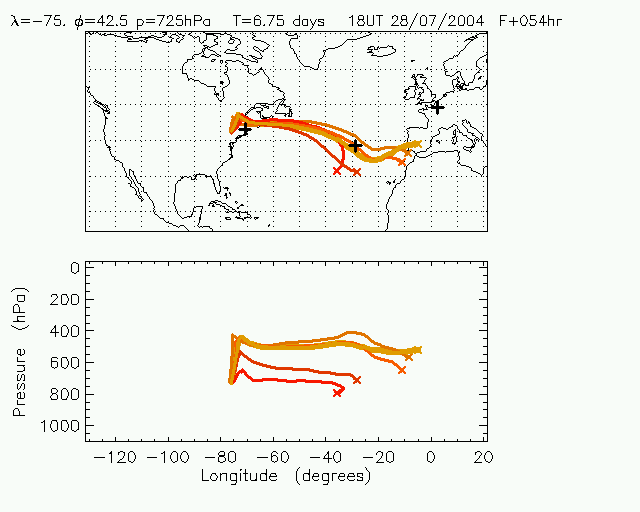
Fig 12: Forward trajectories from eastern most feature on Fig.11.
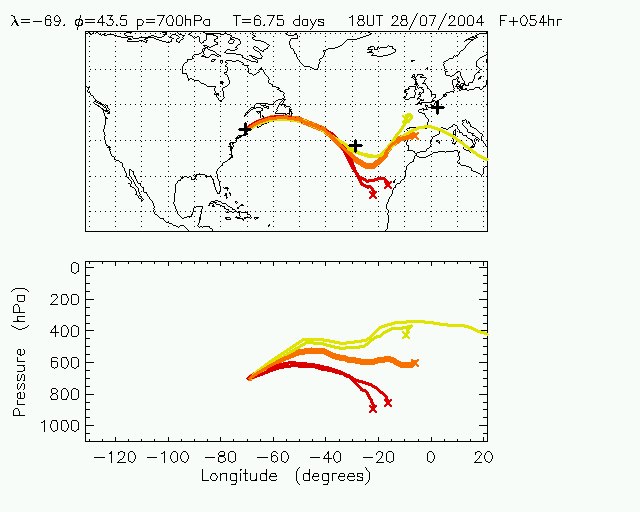
Fig 13: Forward trajectories from sloping feature on Fig.11.
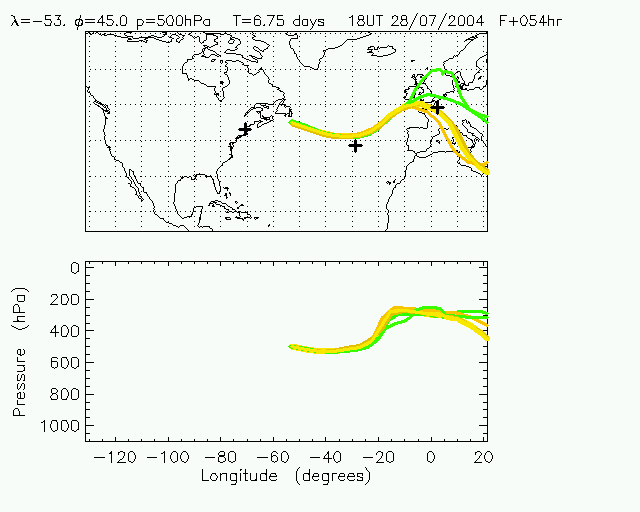
Fig 14: Forward trajectories from feature at x=2000km on Fig.11.
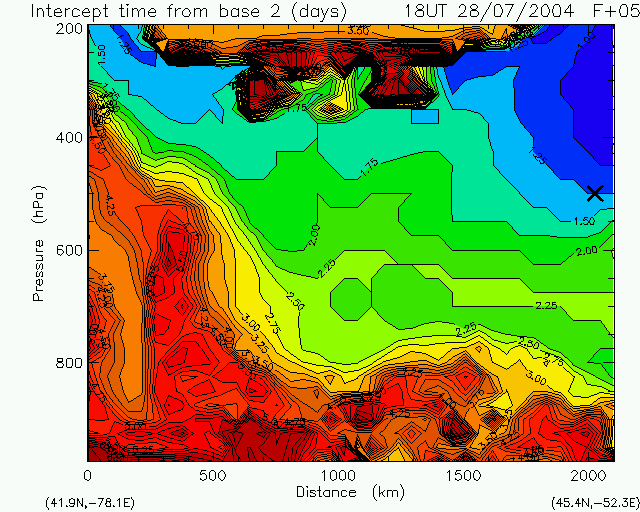
Fig.15: Time taken to reach closest approach to Faial, Azores, from US domain at 18UT 28 July.
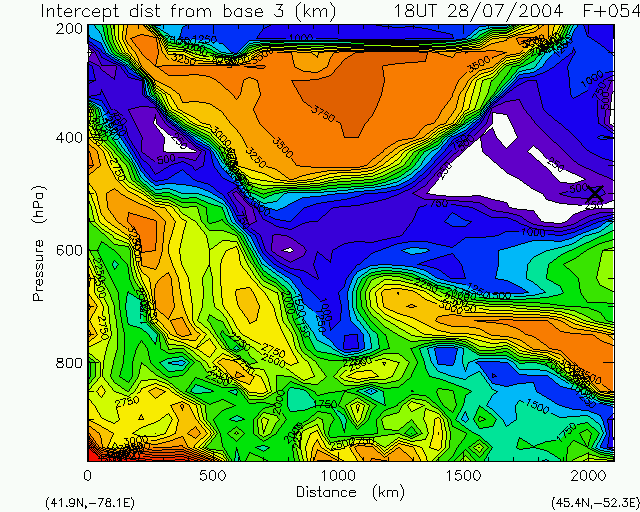
Fig.16: Closest approach to Creil, France showing that easternmost feature is more likely than the sloping feature to continue towards Europe.
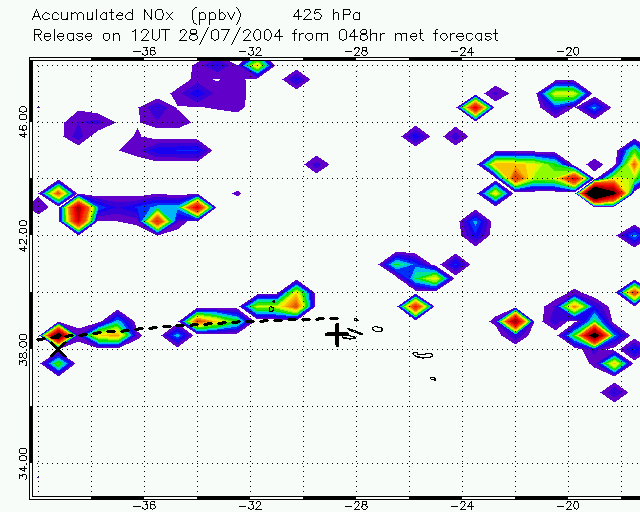
Fig.17: Azores domain at 12UT 28 July. Nox emissions tracer on 425hPa (FL220). The cross marks the rendezvous location for the DC8-BA146 comparison. The tracer feature along 43N marks the upper level WCB outflow (see also Fig.20). It will be cloudy there.
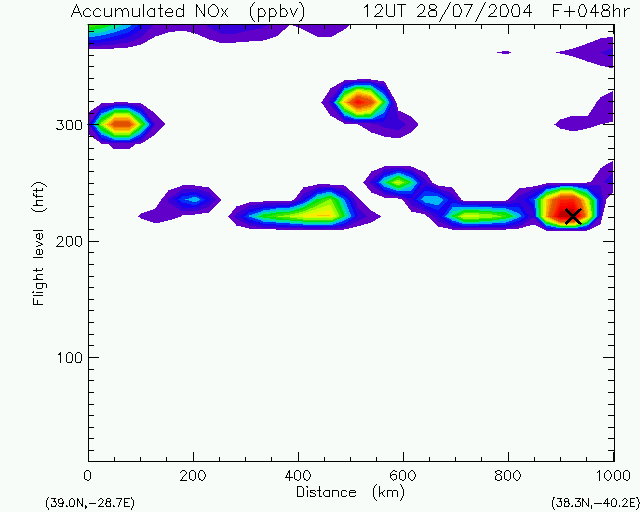
Fig.18: Section along the dashed line in Fig.17 showing accumulated NOx. Proposed top level for comparison leg is FL220.
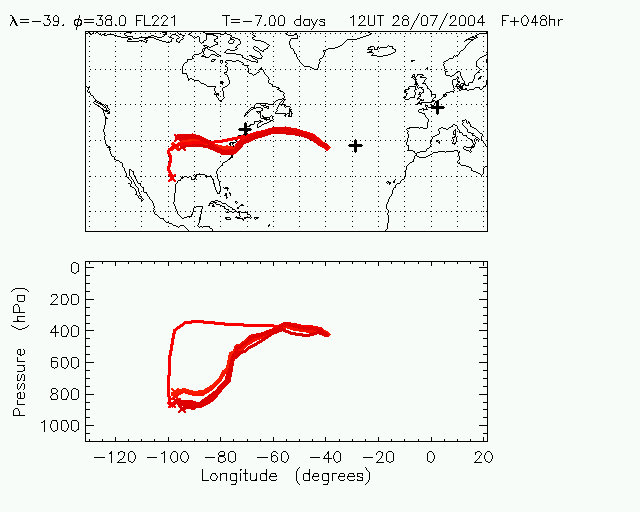
Fig 19: Back trajectories from rendezvous point.
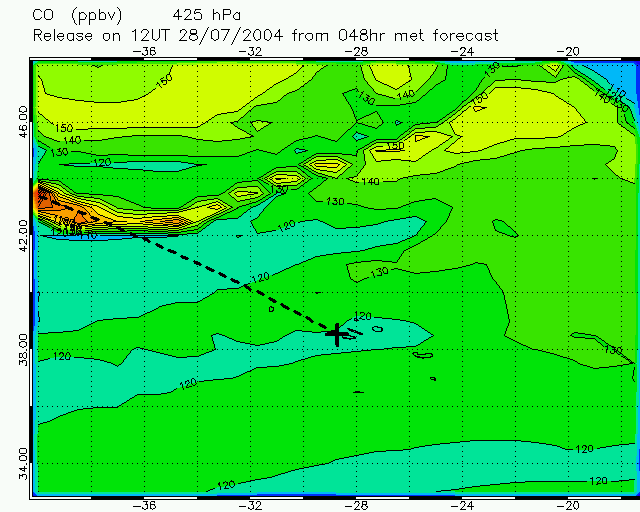
Fig 20: TOMCAT CO advected from trajectory origins highlighting location of WCB outflow along 43N.
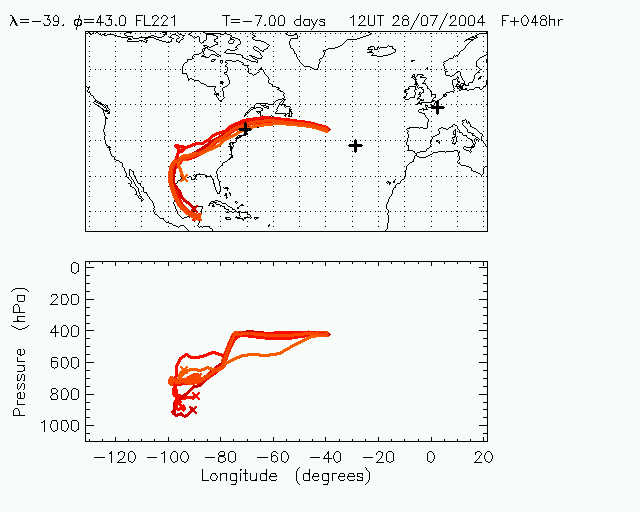
Fig 21: Back trajectories along the WCB outflow from 43N, 39W, FL220.
Previous plots of the day
Posted 26/5/04
Posted 27/5/04
Posted 28/5/04
Posted 2/6/04
Posted 3/6/04
Posted 15/6/04
Posted 16/6/04
Posted 18/6/04
Posted 25/6/04
Posted 29/6/04
Posted 6/7/04
Posted 7/7/04
Posted 11/7/04
Posted 14/7/04
Posted 21/7/04
Posted 22/7/04
Posted 26/7/04
Posted 27/7/04
Links
Home page
ITOP main page at the BADC
ICARTT forecasting page and bulletin board
NOAA Aeronomy Lab forecast products
John Methven's home page
|
|