Intercontinental Transport of Ozone and its Precursors -
Forecast Trajectories
ITOP Plots of the Day
Selected plots are posted here daily by the ITOP-UK group. They are
intended as discussion points for flight planning purposes.
In addition you can view
forward trajectories from the P3, DC8 and BA146 flight tracks during the ICARTT experiment. Posted 26/7/04.
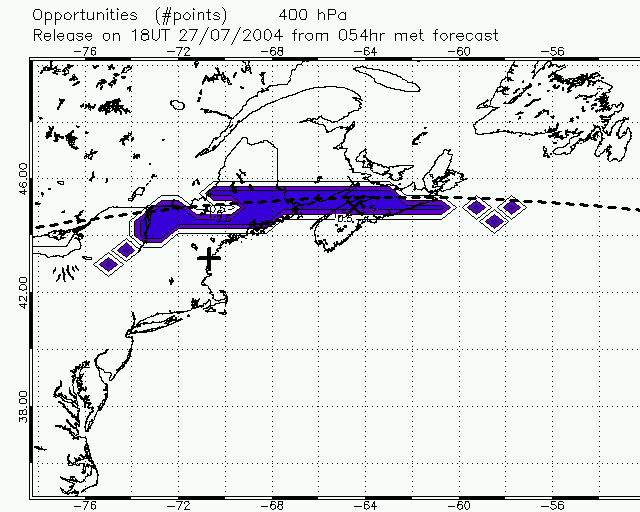
Fig.1: US domain at 18UT 27 July. Lagrangian opportunities highlighted on the 400 hPa level. If 1.5 < n <2.5, there are two-point opportunities (US-Azores or US-Europe) and if n > 2.5, there are three-point opportunities (US-Azores-Europe).
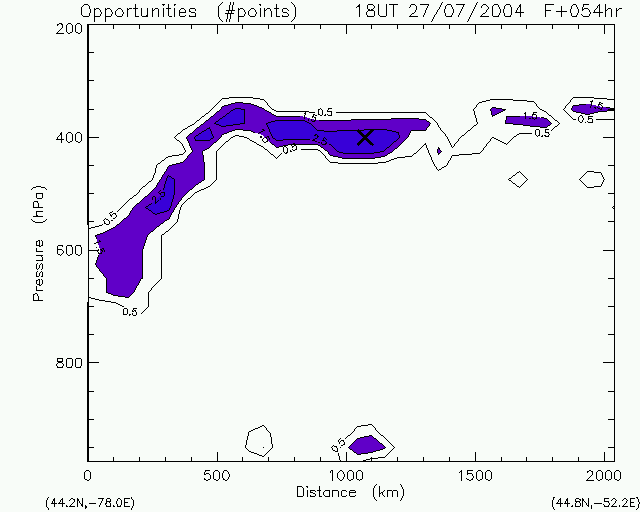
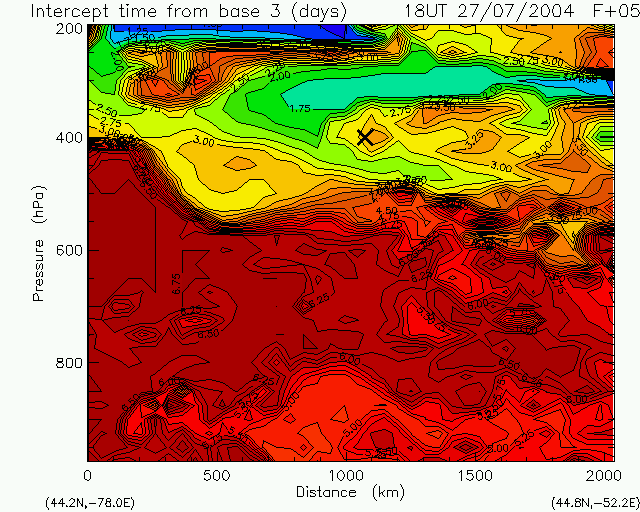
Fig.2: Section along the dashed line in Fig.1 showing Lagrangian opportunities.
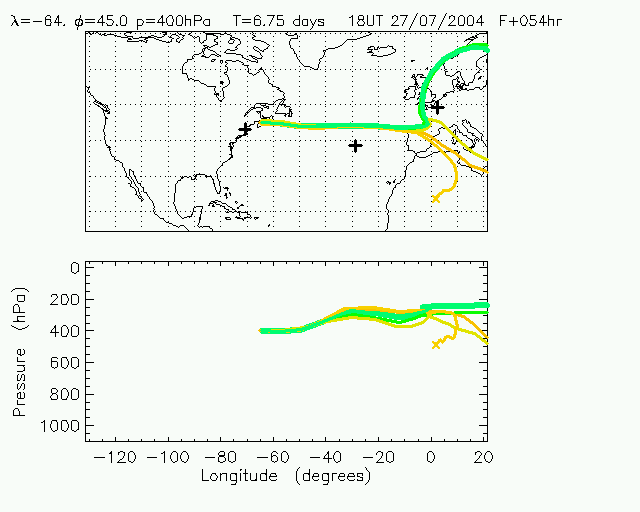
Fig.3: Forward trajectories from the cross on Figs. 1 and 2.
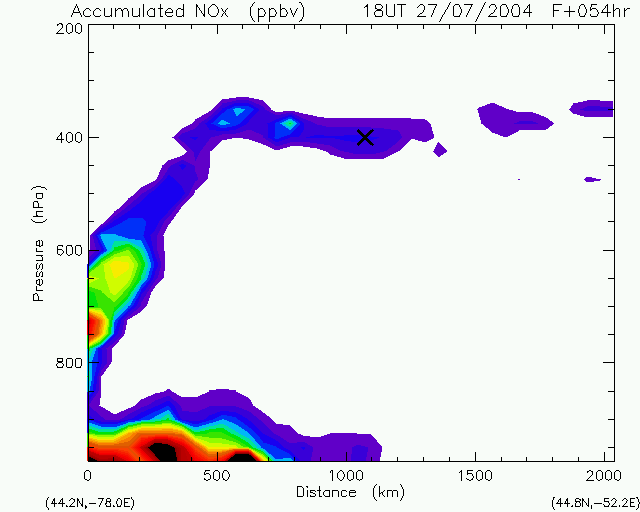
Fig.4: NOx emissions tracer shown on the same section. The best opportunities at 400hPa are to the western end of the feature (higher NOx and biogenic tracer).
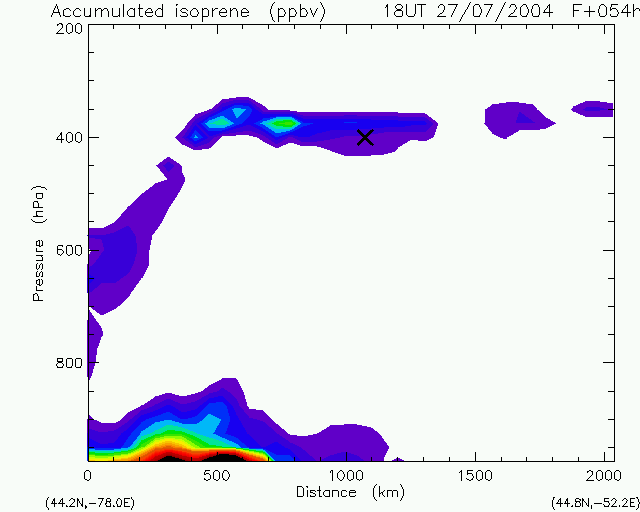
Fig.5: Biogenic emissions tracer shown on the same section.
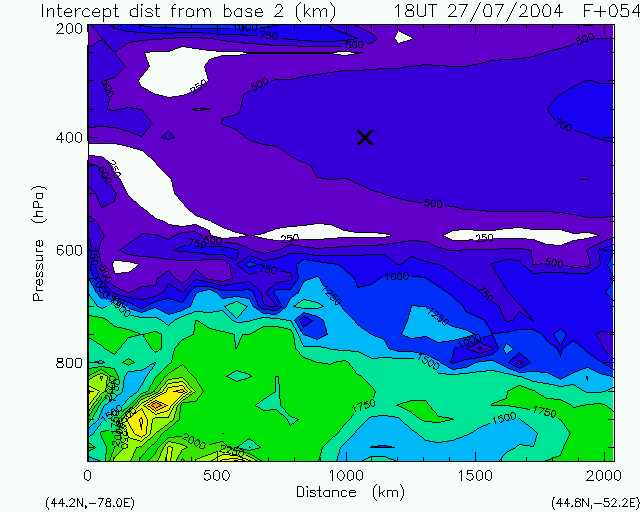
Fig.6: Section along the dashed line in Fig.1 showing closest approach of forward trajectories to Faial, Azores.
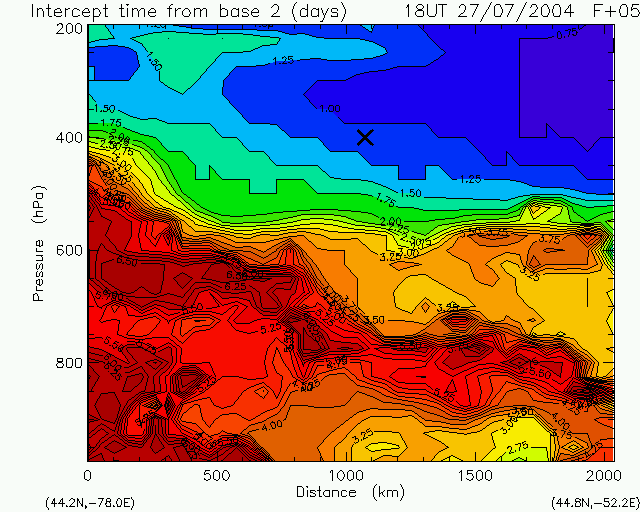
Fig.7: Section along the dashed line in Fig.1 showing the time of closest approach of forward trajectories to Faial, Azores. Varies between early evening of 28 July, during DC8-BA146 comparison flight, and morning of 29 July.
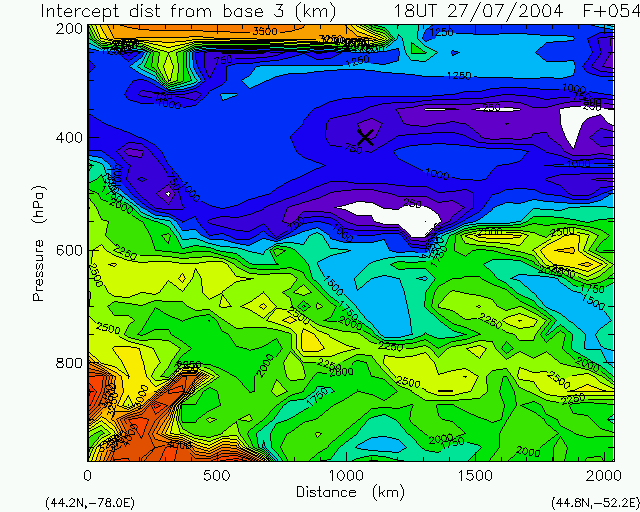
Fig.8: Section along the dashed line in Fig.1 showing closest approach of forward trajectories to Creil, France.
Fig.9: Section along the dashed line in Fig.1 showing time of closest approach of forward trajectories to Creil, France. On average the transit time is 3 days giving arrival on 30 July.