Intercontinental Transport of Ozone and its Precursors -
Forecast Trajectories
ITOP Plots of the Day
Selected plots are posted here daily by the ITOP-UK group. They are
intended as discussion points for flight planning purposes.
Posted 25/6/04.
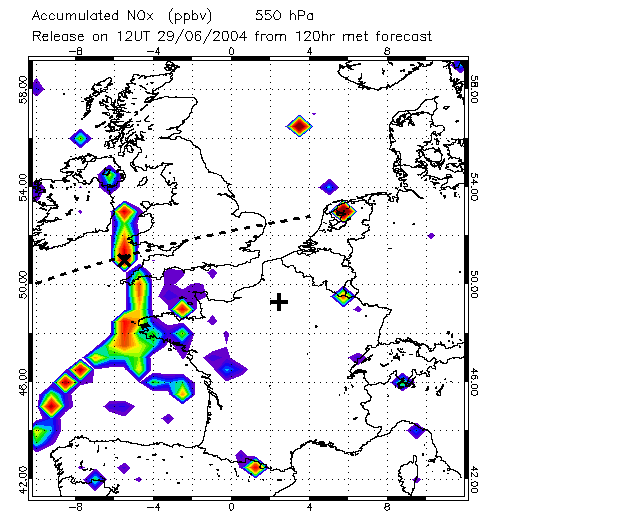
Fig.1: Possible flight on Tuesday. NOx emissions tracer at 550 hPa (FL160). Target interception north of Lands End (cross).
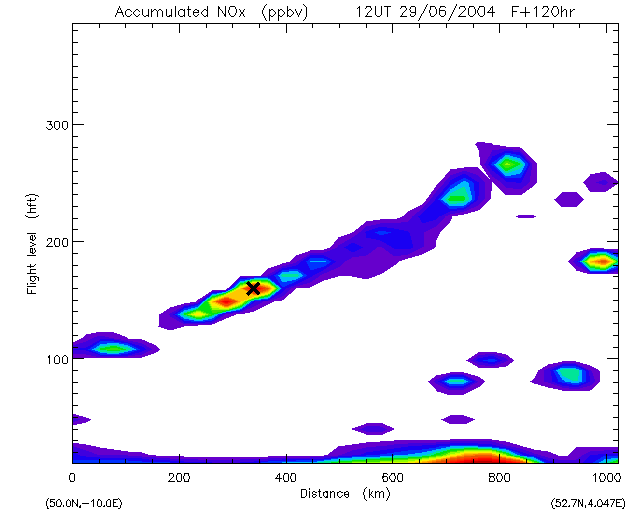
Fig.2: Section along the dashed line in Fig.1 showing NOx emissions tracer (European emissions included). Cross marks target location. Air from SE USA indicated in sloping airmass.
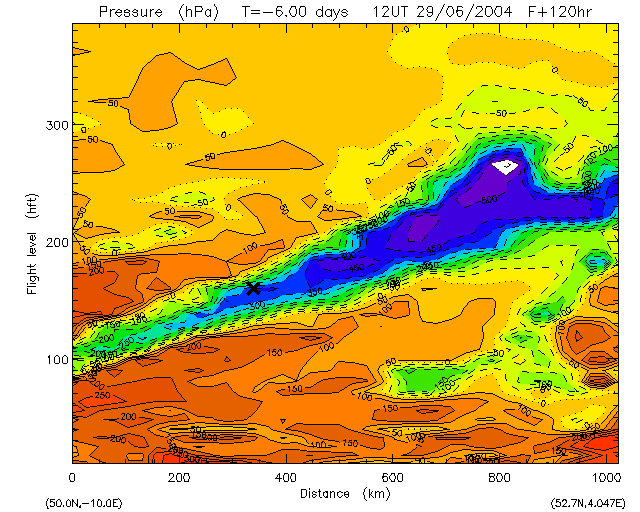
Fig.3: Change in pressure along 6 day trajectories arriving on the same vertical cross-section. Blue indicates air that has ascended.
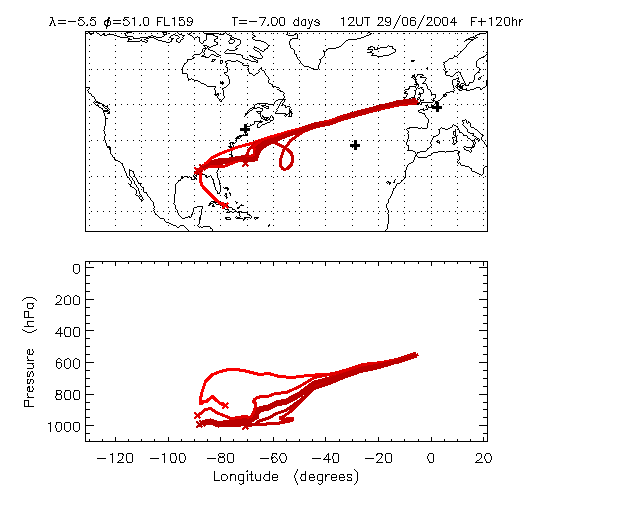
Fig.4: Trajectories back from cross on Figs. 2 and 3.
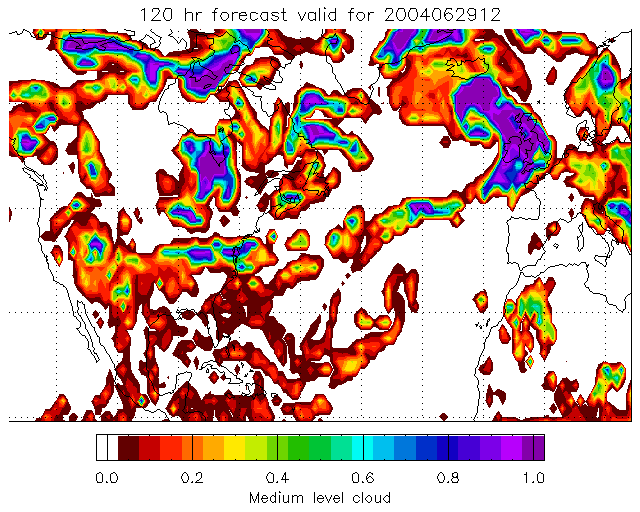
Fig.5: ECMWF forecast of mid-level cloud fraction showing cloud within ascending airmass.