|
|
|
ITOP Plots of the Day
Selected plots are posted here daily by the ITOP-UK group. They are
intended as discussion points for flight planning purposes.
Posted 26/5/04.
Flight plan for today's flight of BA146
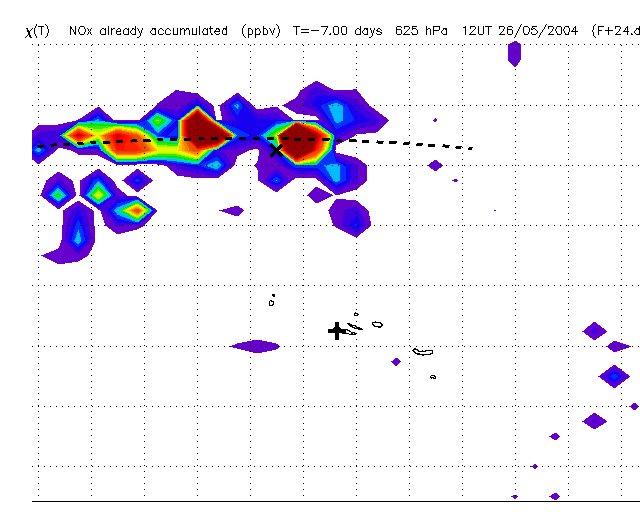
Fig.1: Showing NOx emissions tracer at 625 hPa today (using DF back
trajs from the Azores domain). This is the level of maximum pollution at
intercept point (X) but below the level of air mass which continues to France.
Horta is at the +. Grid rule spacing is 2 degrees.
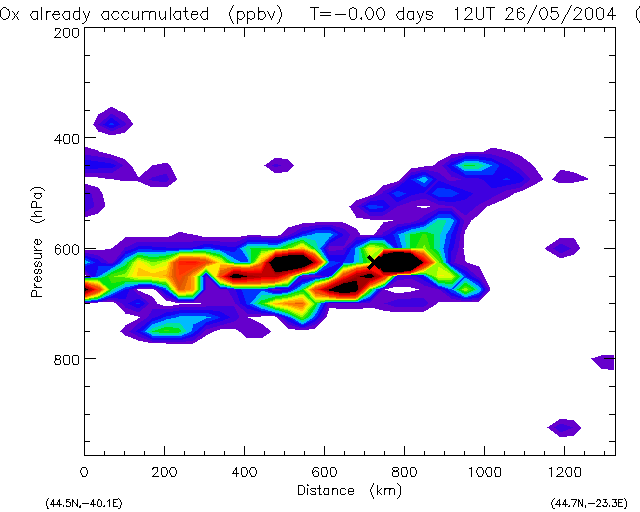
Fig.2: Section along dashed line in Fig.1 showing the polluted target layer.
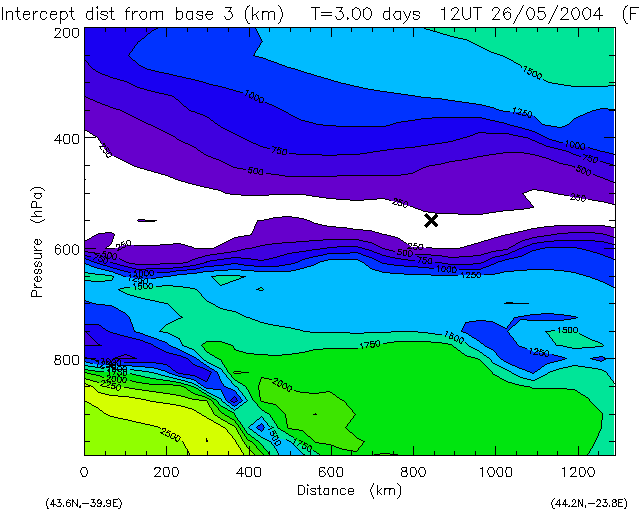
Fig.3: Section along 44N showing closest approach to Creil for forward trajs.
Best layer to target is 575 hPa, in top of polluted layer.
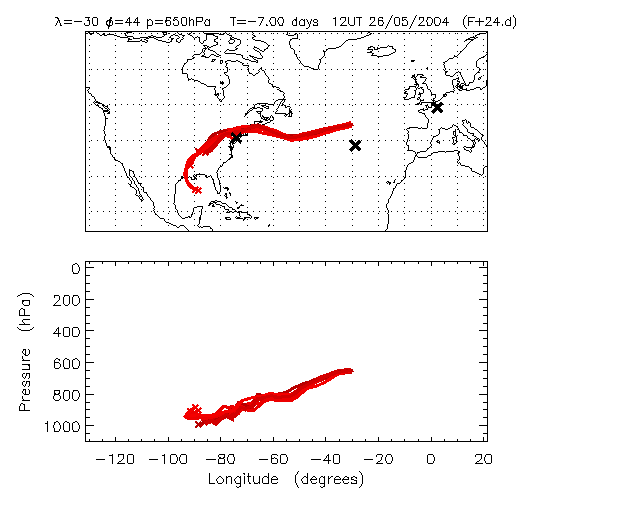
Fig.4: Back trajectories from points closest to the cross in Fig.2 and Fig.1.
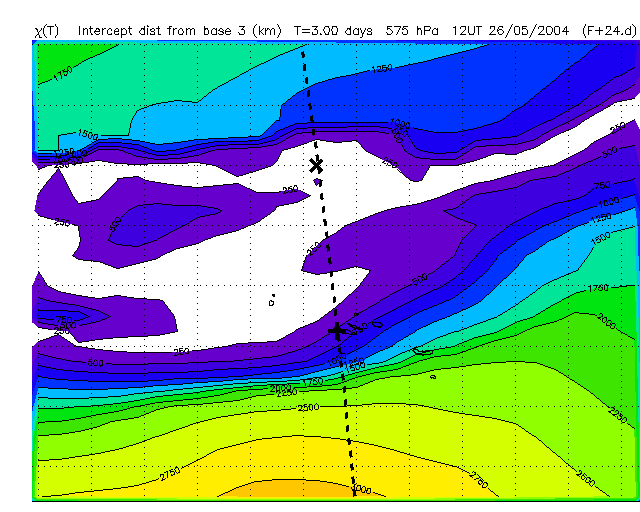
Fig.5: Closest approach to Creil for forward trajs from 575 hPa within Azores domain (Horta is the +).
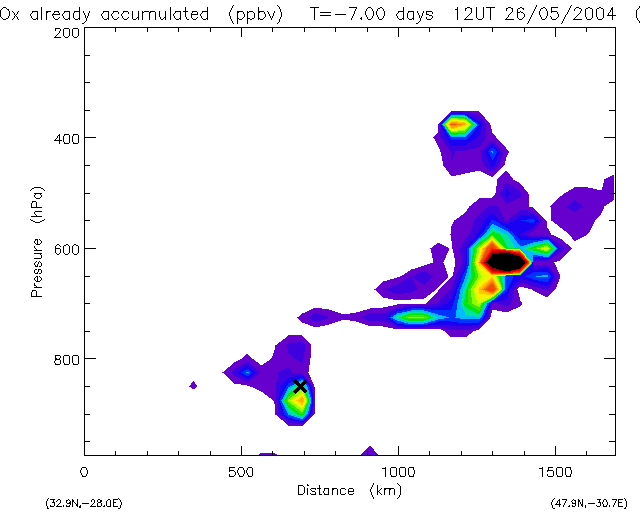
Fig.6: Section along the dashed line in Fig.5 showing the low level pollution near Horta (x=700km) and the polluted layer to the north (x=1300km, 600 hPa).
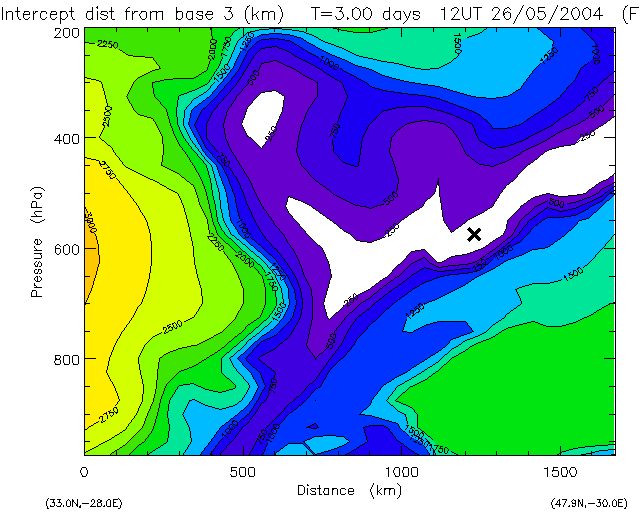
Fig.7: Section along the dashed line in Fig.5 showing the closest
approach to Creil.
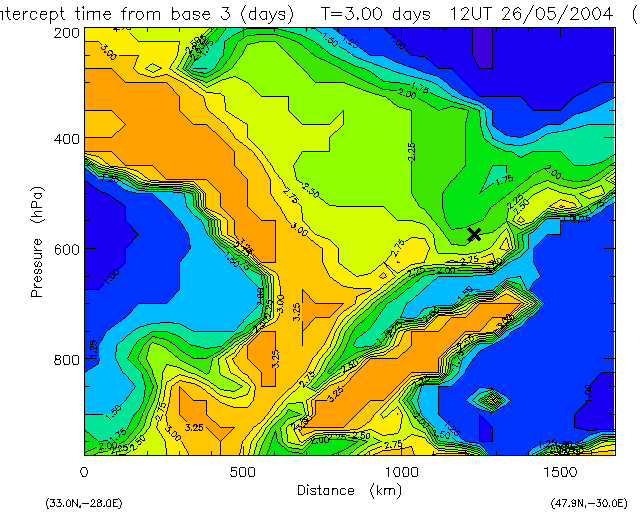
Fig.8: Section along the dashed line in Fig.5 showing the time elapsed
before closest approach to Creil.
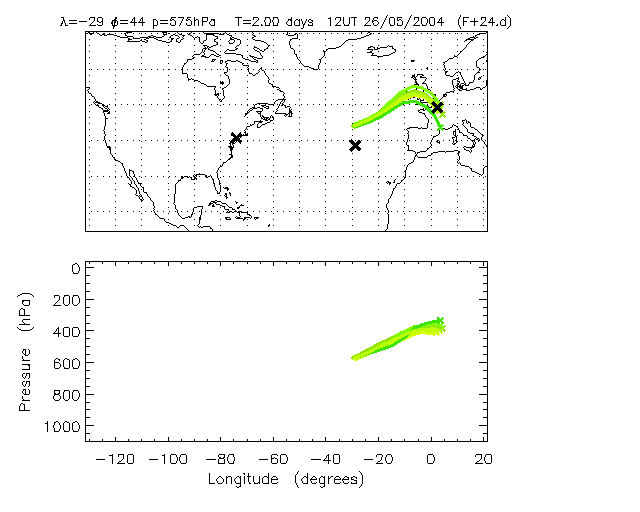
Fig.9: Trajectories forwards 2 days from initial target in flight plan.
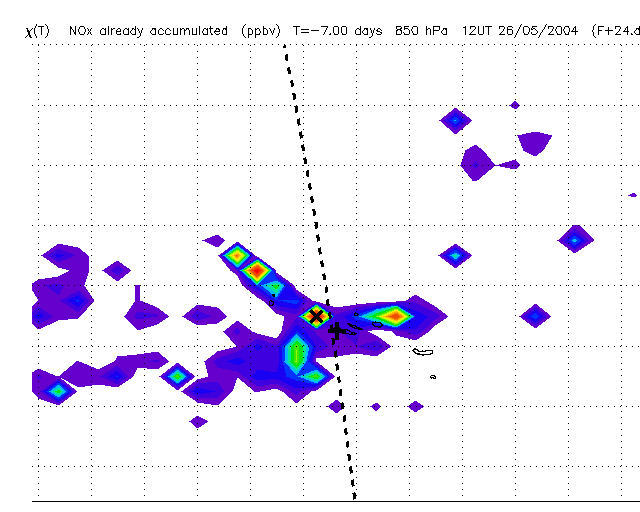
Fig.10: NOx emissions tracer at 850 hPa showing pollution very close to
Faial (the cross).
Links
Home page
ITOP main page at the BADC
ICARTT forecasting page and bulletin board
NOAA Aeronomy Lab forecast products
John Methven's home page
|
|