|
|
|
ITOP Plots of the Day
Selected plots are posted here daily by the ITOP-UK group. They are
intended as discussion points for flight planning purposes.
Posted 16/6/04.
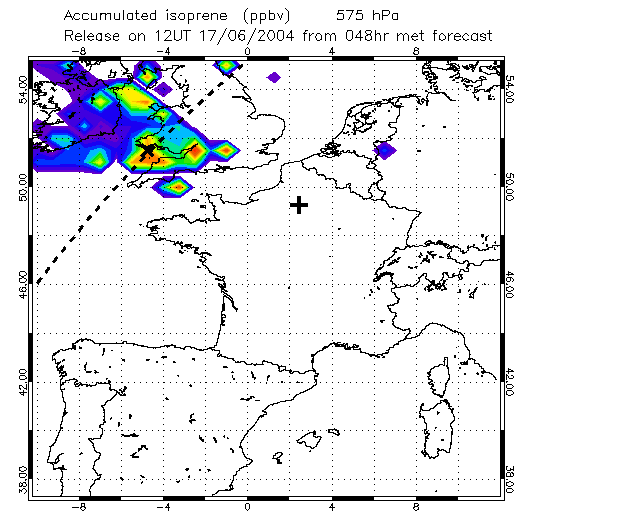
Fig.1: Isoprene emissions tracer at 575 hPa (FL150). Target interception over Bristol Channel (cross).

Fig.2: Section along the dashed line in Fig.1 showing isoprene emissions tracer (European emissions excluded). Cross marks target location. Indicated pollution levels are lower than from yesterday's forecast. Flying between FL120 and FL180 should pick up aged pollution.
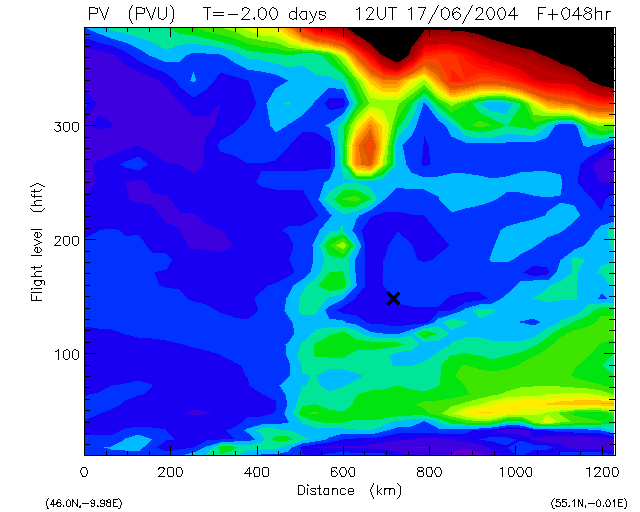
Fig.3: Section along the dashed line in Fig.1 showing PV. Note weak stratospheric intrusion to south of target pollution at about FL280.

Fig.4: 7 day back trajectories from polluted airmass (cross in
Fig.2). Airmasses above Bristol Channel now forecast to have
originated over US West Coast. Those from Mid-West and Southern US now
arriving over Wales.
Previous plots of the day
Posted 26/5/04
Posted 27/5/04
Posted 28/5/04
Posted 2/6/04
Posted 3/6/04
Posted 15/6/04
Posted 16/6/04
Links
Home page
ITOP main page at the BADC
ICARTT forecasting page and bulletin board
NOAA Aeronomy Lab forecast products
John Methven's home page
|
|