Intercontinental Transport of Ozone and its Precursors -
Forecast Trajectories
ITOP Plots of the Day
Selected plots are posted here daily by the ITOP-UK group. They are
intended as discussion points for flight planning purposes.
Posted 3/6/04.
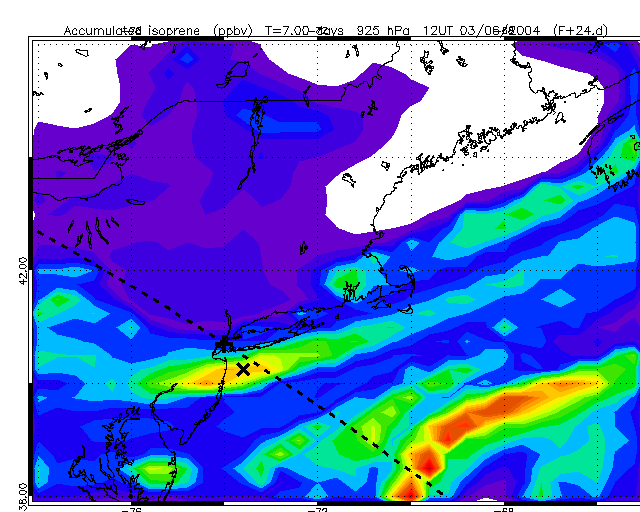
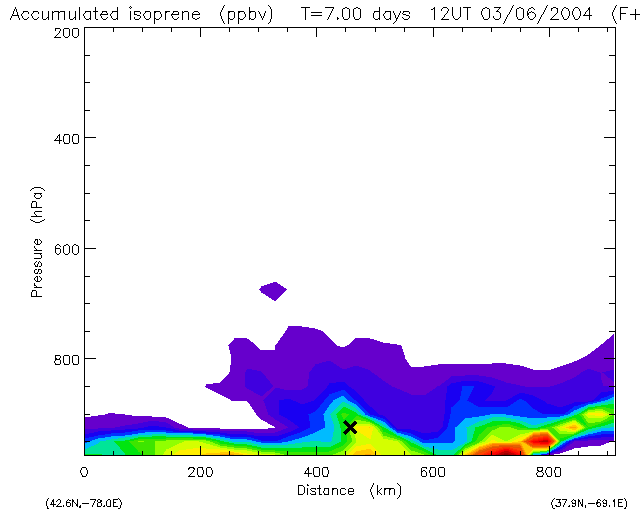
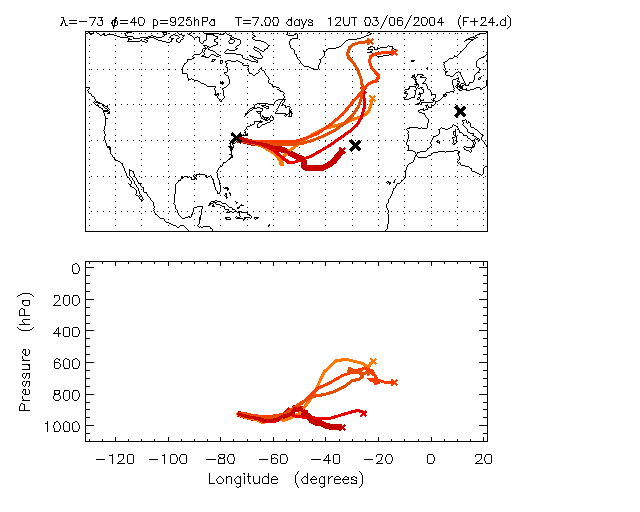
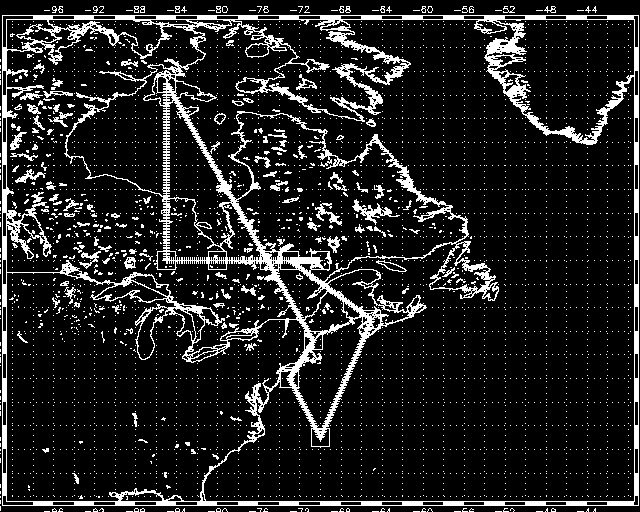
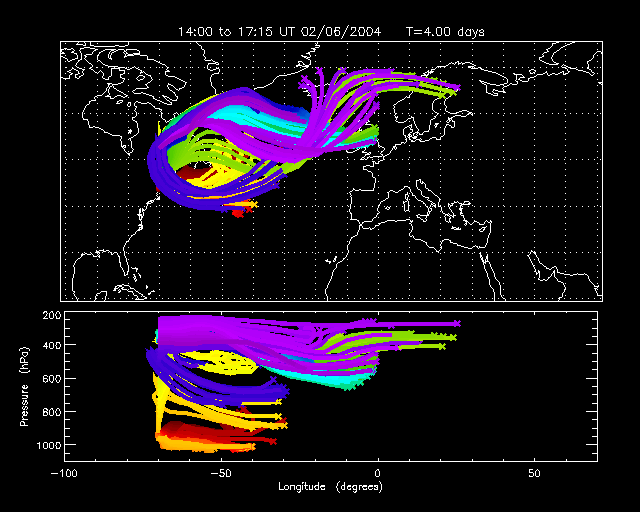
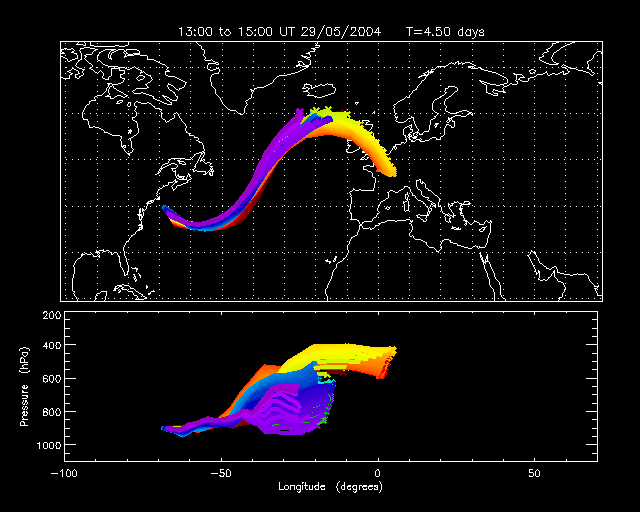
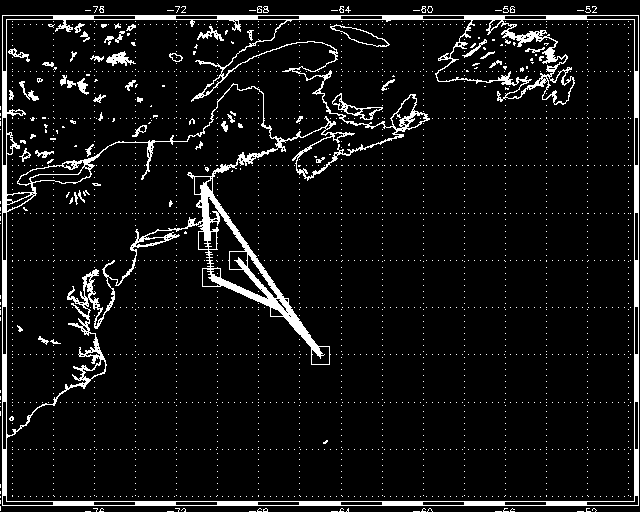
Fig.2: Section along the dashed line in Fig.1 showing isoprene emissions tracer.
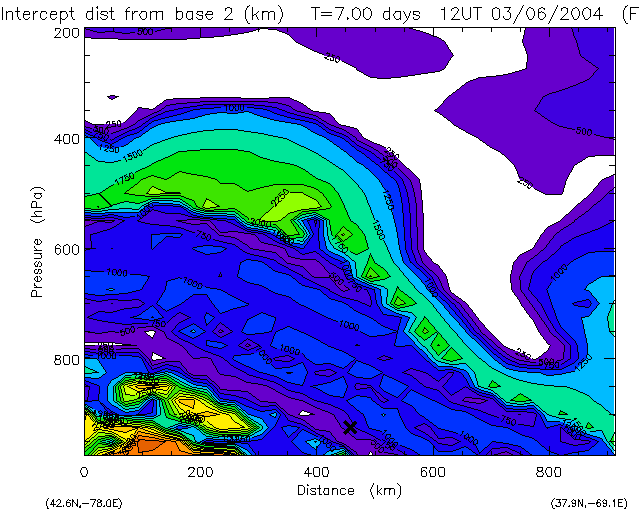
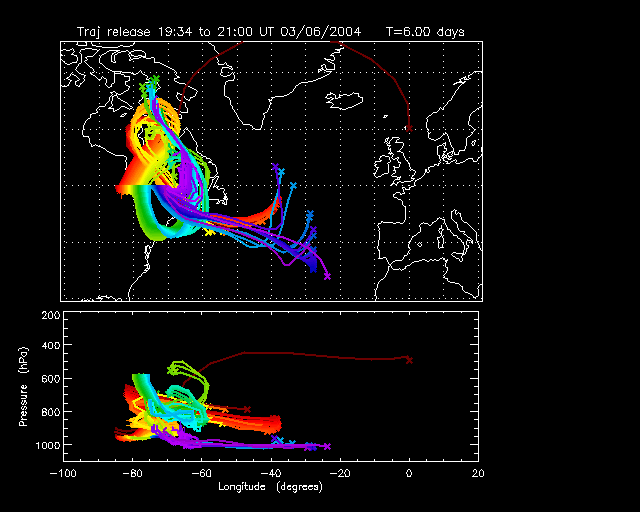
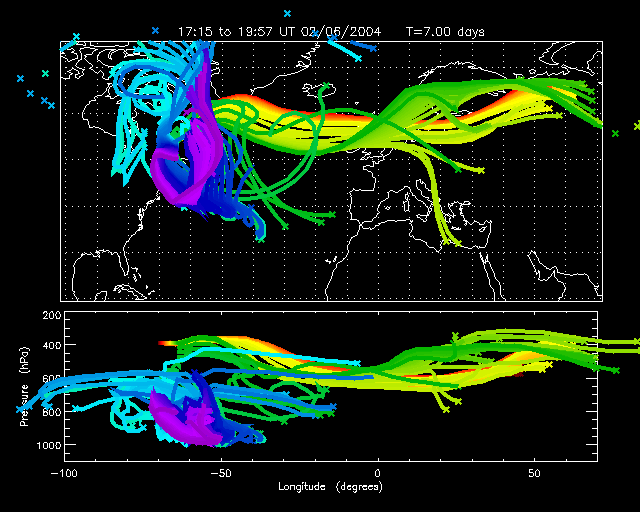
Fig.3: Section along the dashed line in Fig.1 showing closest approach to Horta. Note how polluted air trajectories pass close to Azores.
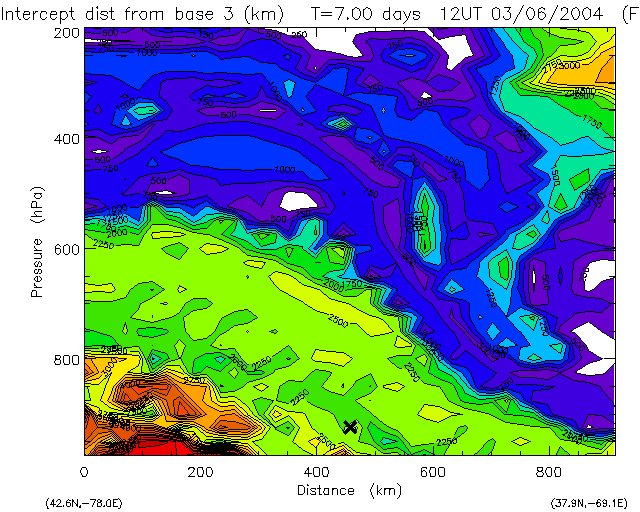
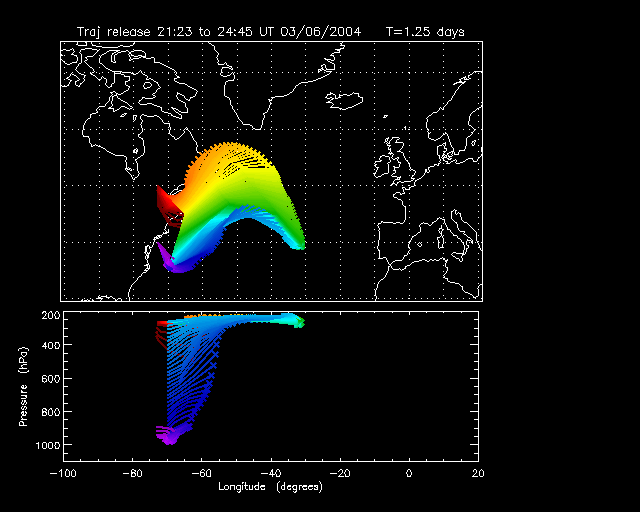
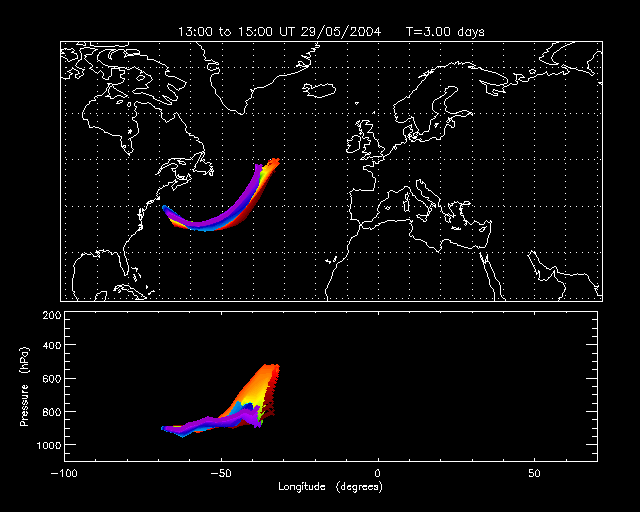
Fig.4: Section along the dashed line in Fig.1 showing closest approach to Creil. Note the mutual exclusivity between air passing near the Azores and that heading for W. Europe (i.e., lack of 3-point opportunities).