|
|
|
ITOP Plots of the Day
Selected plots are posted here daily by the ITOP-UK group. They are
intended as discussion points for flight planning purposes.
Posted 27/5/04.
Flight plan for flight of BA146 on 26/5/04
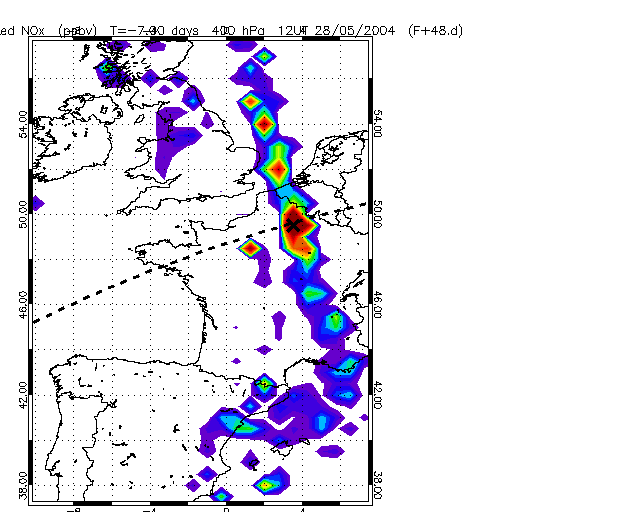
Fig.1: Showing NOx emissions tracer at 400 hPa 12 UT Friday (using DF back
trajs from the European domain). This is the level of maximum pollution at
intercept point (X).
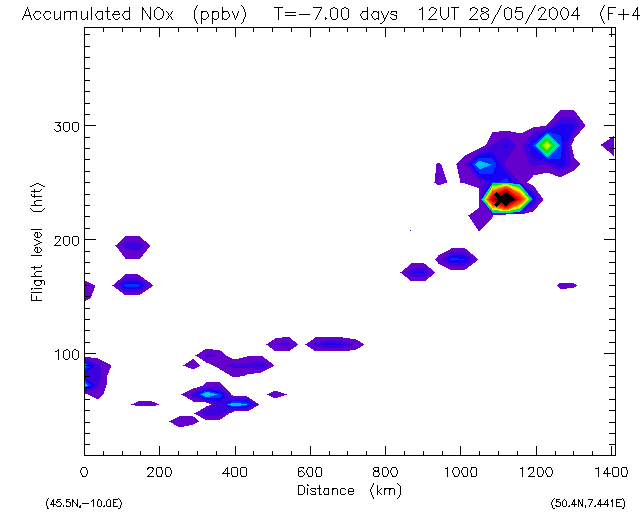
Fig.2: Section along dashed line in Fig.1 showing the polluted target layer at 400 hPa (FL235).
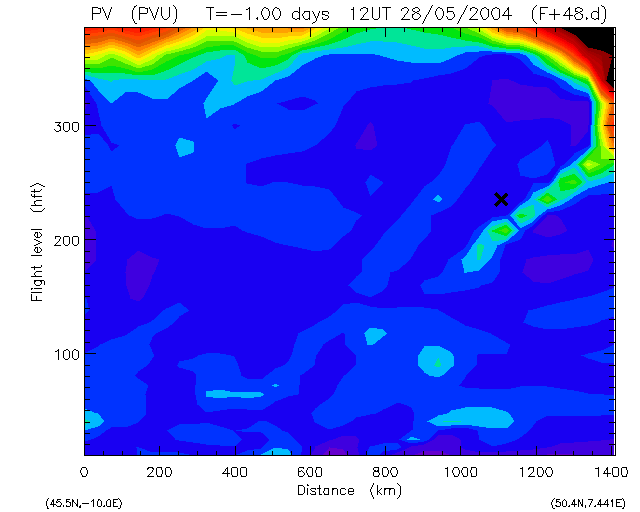
Fig.3: Section along dashed line in Fig.1 showing PV. Note that there is an old, narrow tropopause fold to the east of the target pollution (X) - you should cross dry, elevated ozone air just before target.
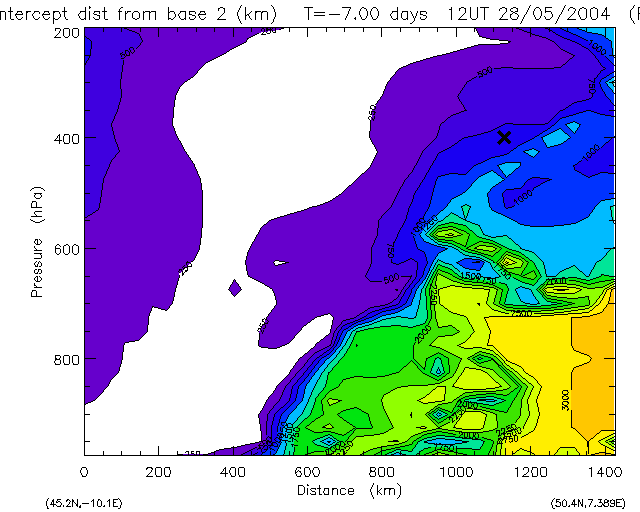
Fig.4: Section along dashed line in Fig.1 showing closest approach of
back trajectories to Horta. The target passed at about 750km from Horta
(to North).
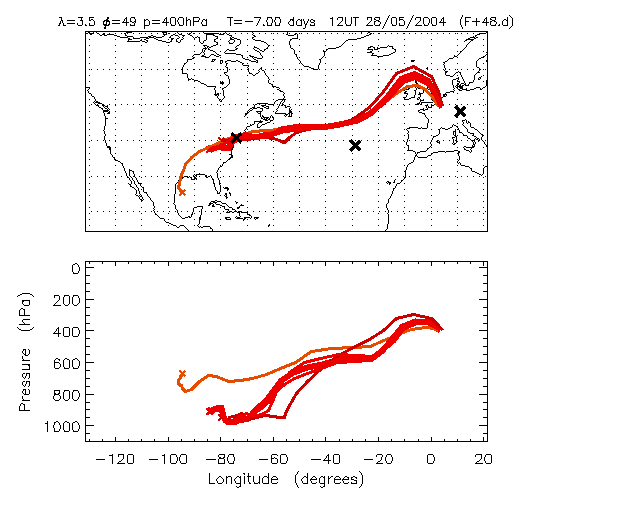
Fig.5: The back trajectories from the target air mass.
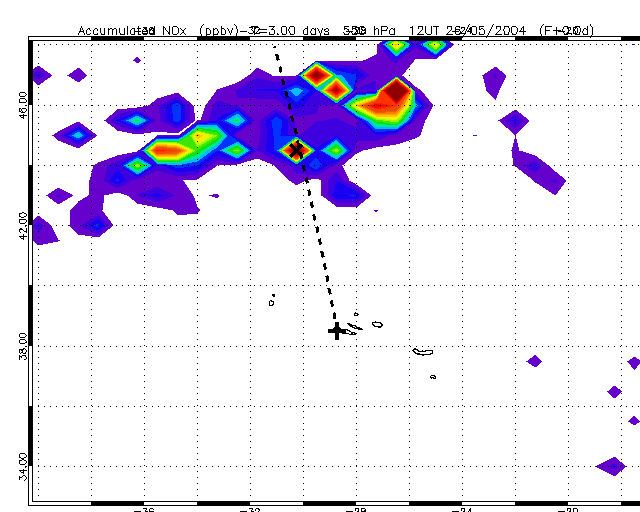
Fig.6: Showing NOx emissions tracer at 550 hPa 12 UT 26/5/04 (using DF back
trajs from the Azores domain). X marks the initial target of the BA146.
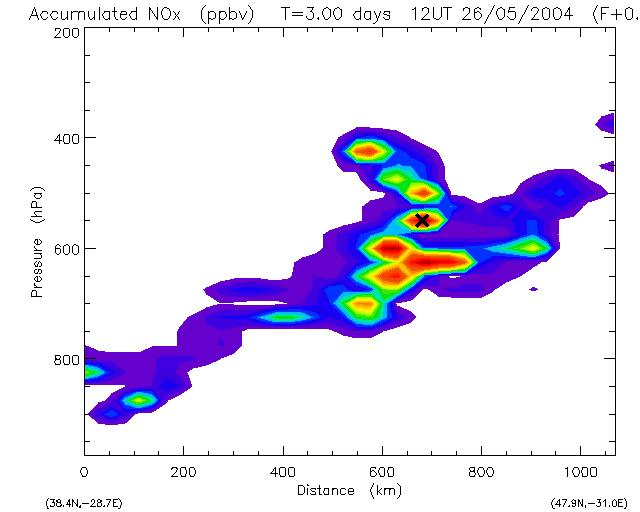
Fig.7: Section along dashed line in Fig.6 showing the polluted target
layer at 550 hPa but also pollution that would have been sampled on
flight plan at 625 hPa. Air between these levels all arrives near 400
hPa stretched out in North-South filament over France (Fig. 1).
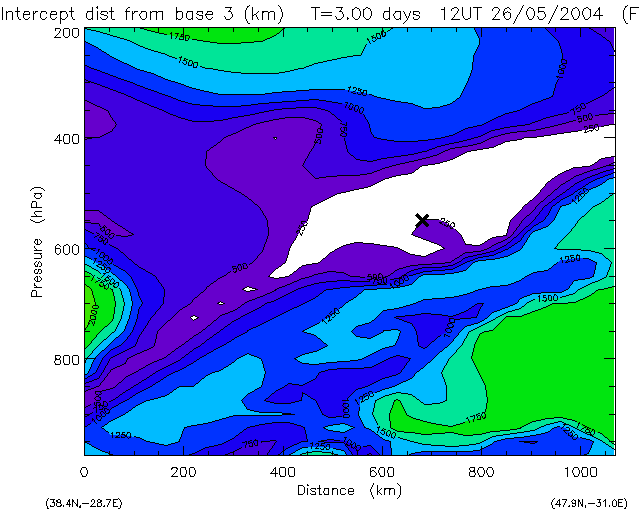
Fig.8: Section along dashed line in Fig.6 showing closest approach of forward trajectories to OBF.
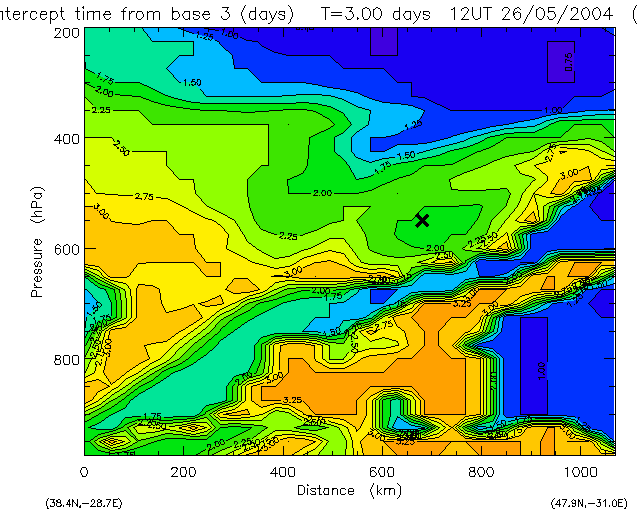
Fig.9: Section along dashed line in Fig.6 showing the forecast time of closest approach. It now indicates 2.00 days (i.e., 12UT 28/5/04 as in Fig.1)
Previous plots of the day
Posted 26/5/04
Links
Home page
ITOP main page at the BADC
ICARTT forecasting page and bulletin board
NOAA Aeronomy Lab forecast products
John Methven's home page
|
|