|
|
|
ITOP Plots of the Day
Selected plots are posted here daily by the ITOP-UK group. They are
intended as discussion points for flight planning purposes.
Posted 28/5/04.
Plots showing forward trajectories from the BA146 track on 26/5/04
using the winds forecast from 12UT 27/5/04.
The part of the track on 26/5/04 within the polluted air mass (colour
is time along track, red -> violet)
Position of trajs at 12UT 28/5/04 (North Sea)
Position of trajs at 18UT 28/5/04 (France)
Position of trajs from whole flight track at 18UT 28/5/04. Note air
on low level flight legs near Horta stays at low levels and reaches Biscay
along (and ahead) of cold front.
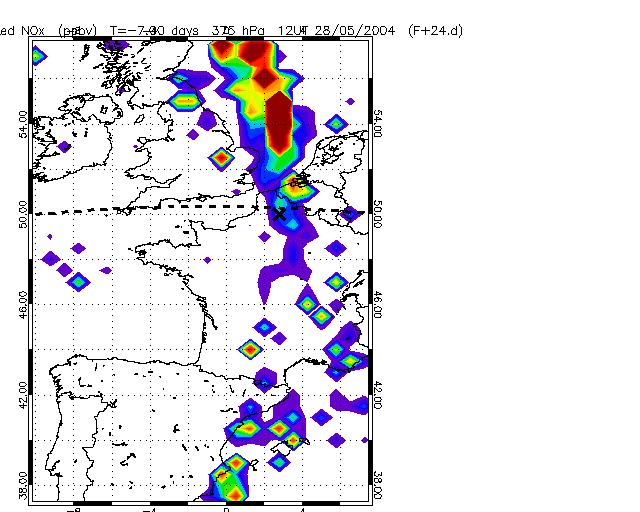
Fig.1: Showing NOx emissions tracer at 375 hPa 12 UT Friday (using DF back
trajs from the European domain). This is the level of maximum pollution.
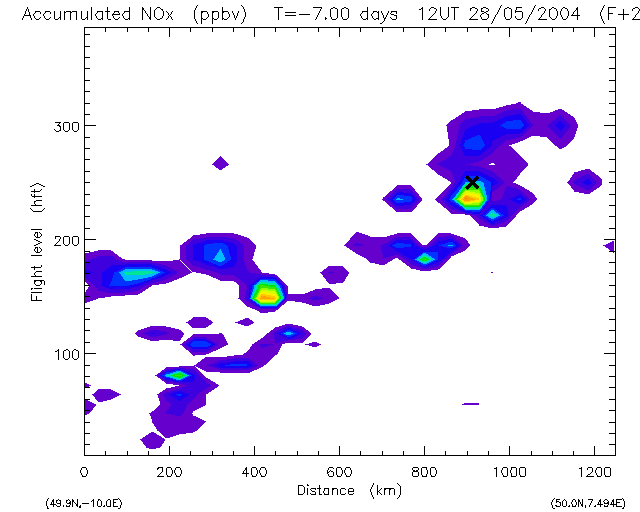
Fig.2: Section along dashed line in Fig.1 showing the polluted target layer at 375 hPa (FL250). Note also pollution throughout the lower troposphere just west of Cornwall at 12UT (x=200km). The maximum is at FL170 but the air sampled by imaginary BA146 and Pico is at low levels (FL060). This is another (weak) Lagrangian opportunity.
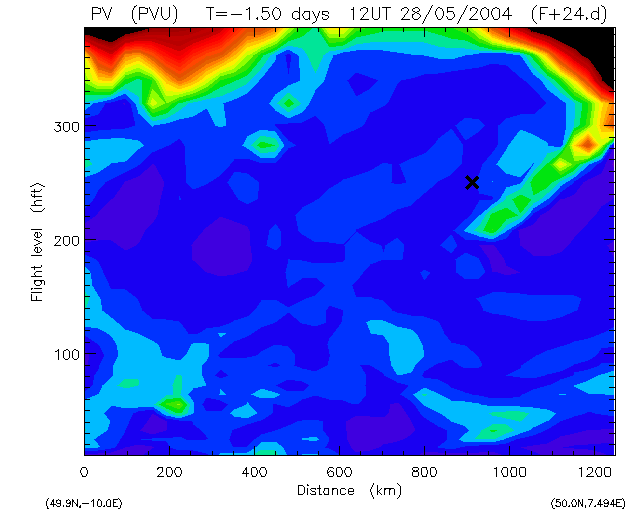
Fig.3: Section along dashed line in Fig.1 showing PV. Note that there is an old, narrow tropopause fold to the east of the target pollution (X) - you should cross dry, elevated ozone air just before target.
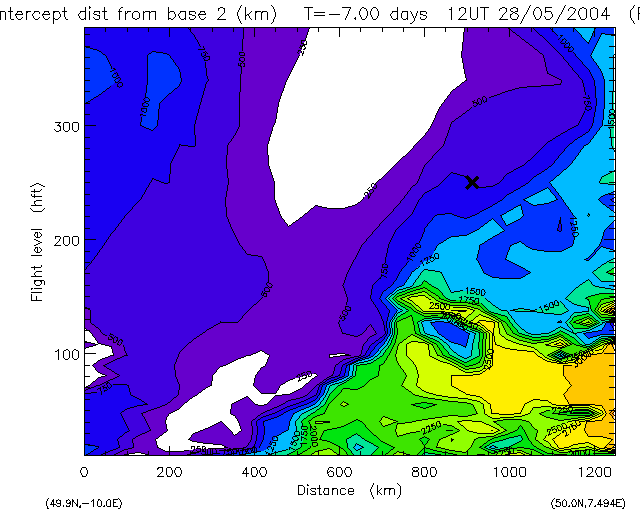
Fig.4: Section along dashed line in Fig.1 showing closest approach of
back trajectories to Horta. The target passed at about 750km from Horta
(to North).
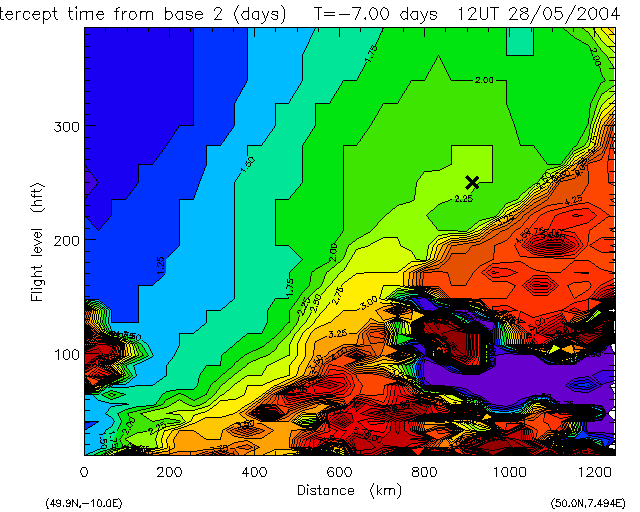
Fig.5: Section along dashed line in Fig.1 showing time elapsed since closest approach of
back trajectories to Horta. At (x=200km, FL060) the back trajectories passed very close to Horta about 2 days previously (when the BA146 flew).
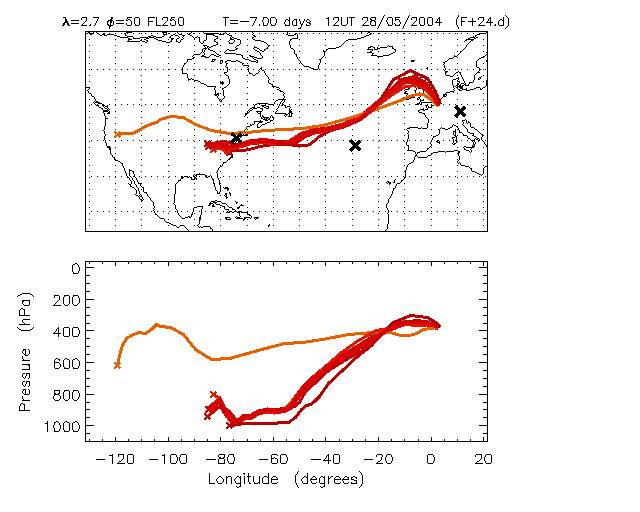
Fig.6: The back trajectories from the target air mass.
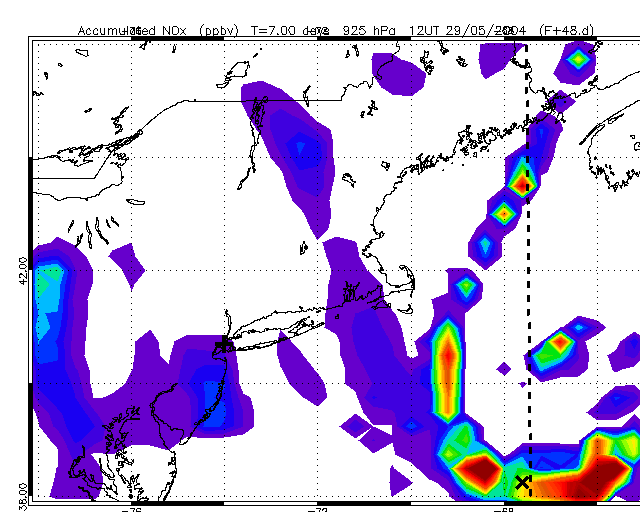
Fig.7: NOx emissions tracer at 925 hPa 12 UT Saturday (using DF back
trajs from the US domain).
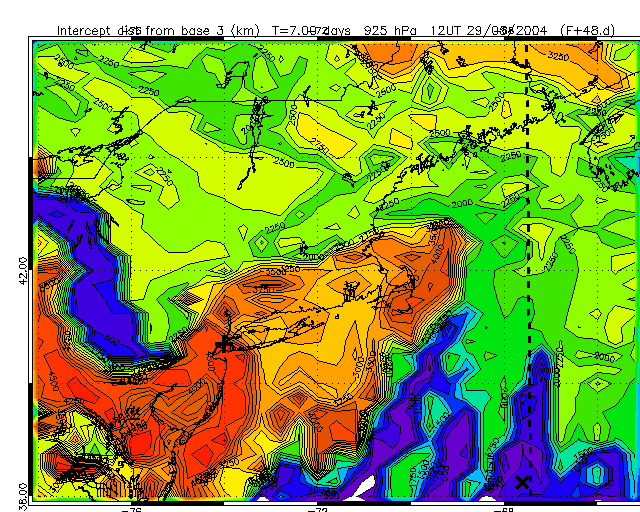
Fig.8: Closest approach to DLR for forward trajectories leaving 925 hPa.
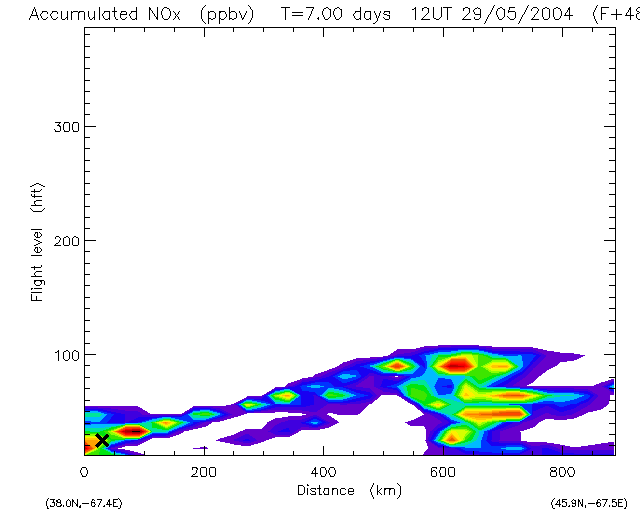
Fig.9: Section along dashed line in Fig.7 showing NOx emissions tracer up frontal surface.
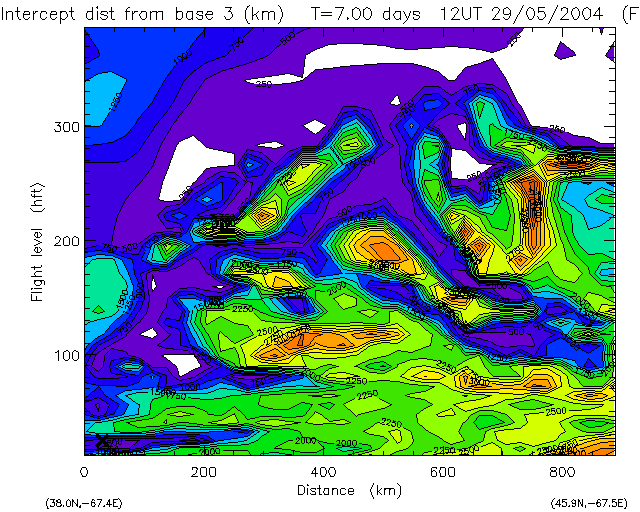
Fig.10: Section along dashed line in Fig.7 showing closest approach of
back trajectories to DLR. Only polluted air below 3000ft near surface front (X) passes within range of the Azores and Europe.
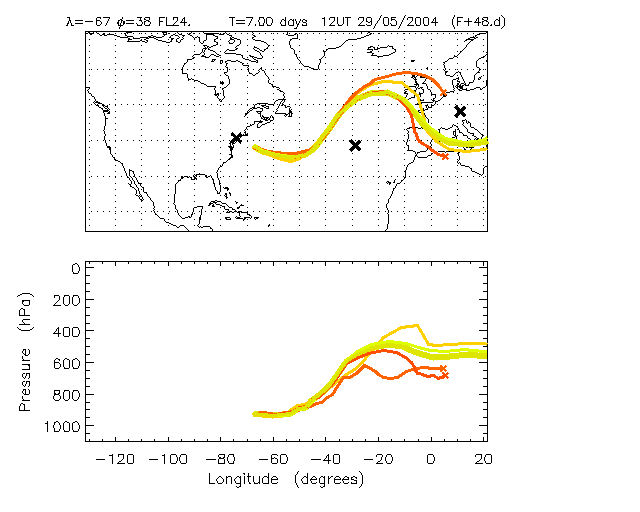
Fig.11: The forward trajectories from the target air mass (X) at about 2500ft.
Previous plots of the day
Posted 26/5/04
Posted 27/5/04
Links
Home page
ITOP main page at the BADC
ICARTT forecasting page and bulletin board
NOAA Aeronomy Lab forecast products
John Methven's home page
|
|