|
|
|
ITOP Plots of the Day
Selected plots are posted here daily by the ITOP-UK group. They are
intended as discussion points for flight planning purposes.
Posted 15/6/04.
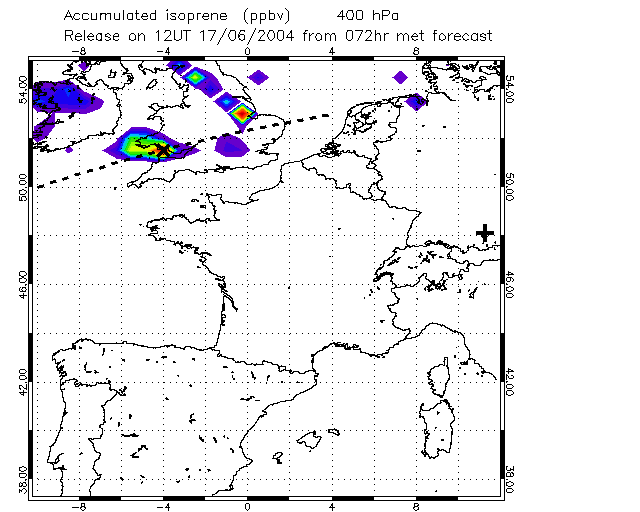
Fig.1: Isoprene emissions tracer at 400 hPa (FL235). Target interception over Bristol Channel (cross).
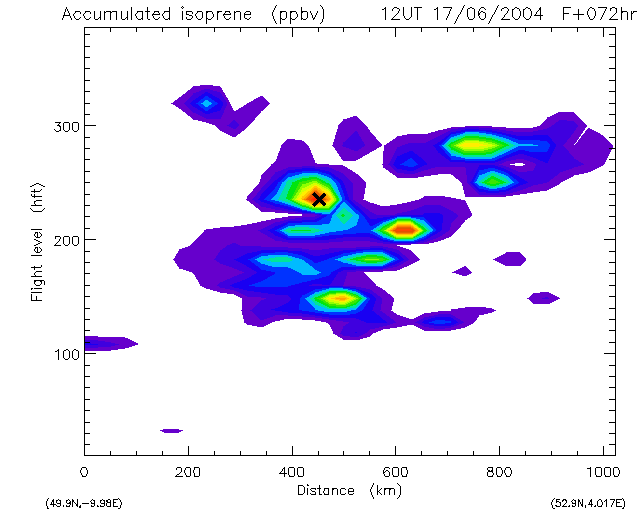
Fig.2: Section along the dashed line in Fig.1 showing isoprene emissions tracer (European emissions excluded). Cross marks target location.
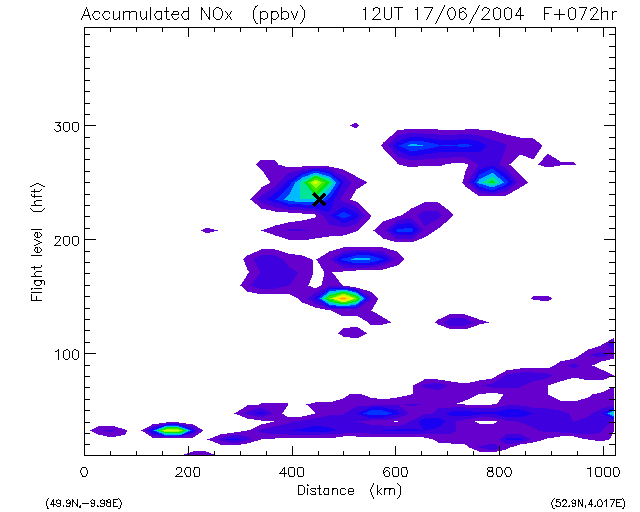
Fig.3: Section along the dashed line in Fig.1 showing NOx emissions tracer (European emissions excluded). Anthropogenic N. Am. pollution indicated to be greatest at about FL240 and FL140 but sensitive to origins of trajectories over the US and therefore level uncertain.
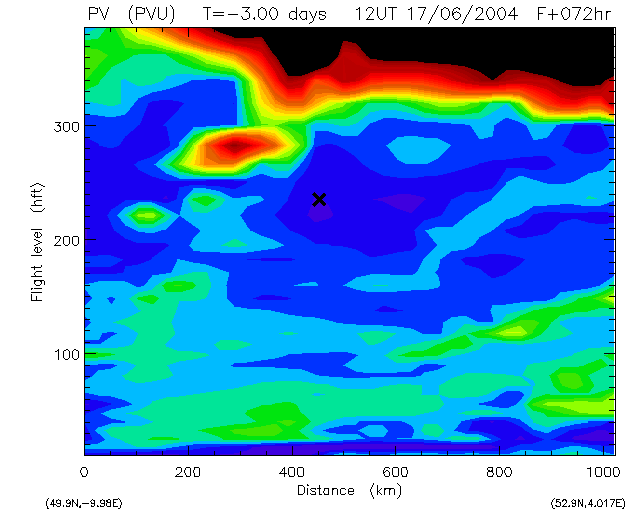
Fig.4: Section along the dashed line in Fig.1 showing PV. Note stratospheric intrusion to west of target pollution at about FL280.
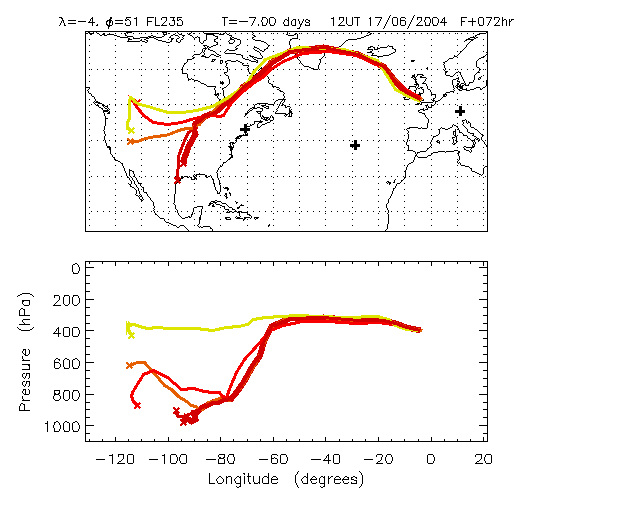
Fig.5: 7 day back trajectories from polluted airmass (cross in Fig.2).
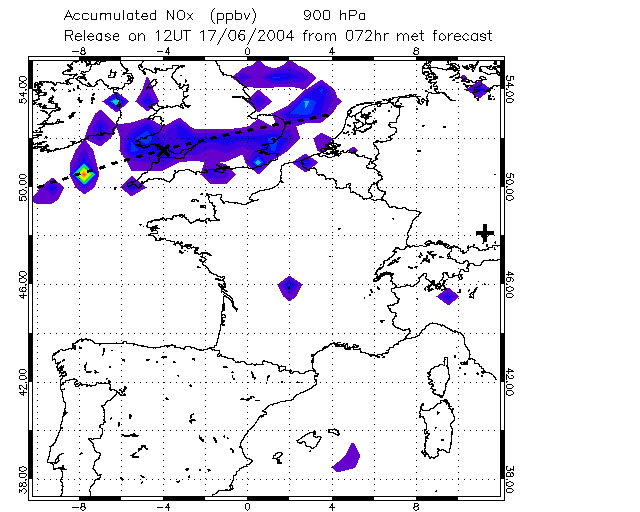
Fig.6: Low level (900hPa) NOx tracer picked up from ship emissions in the BL between Azores and UK (European emissions excluded). Probably would not be detected.
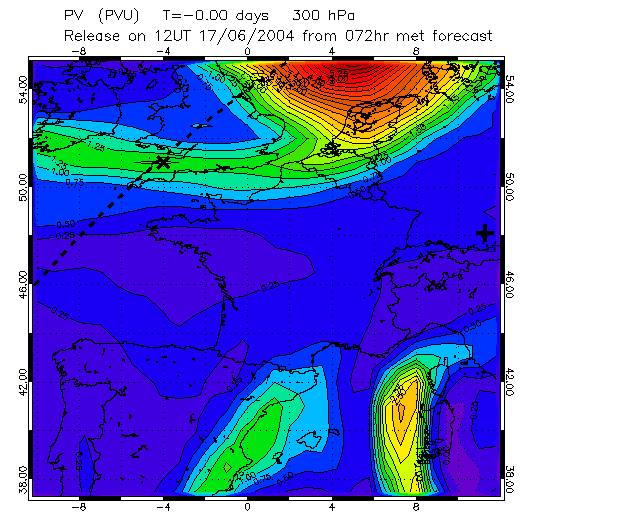
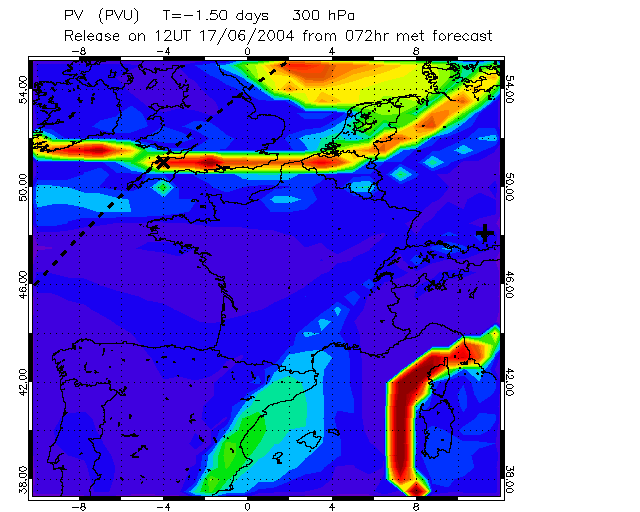
Some more plots illustrating the stratospheric intrusion:
PV on 300 hPa surface direct from ECMWF forecast.
PV on 300 hPa surface , obtained using reverse domain filling trajectories for 3D domain. The trajectories are only 1.5 days long, but this sharpens the detail considerably (assuming no mixing).
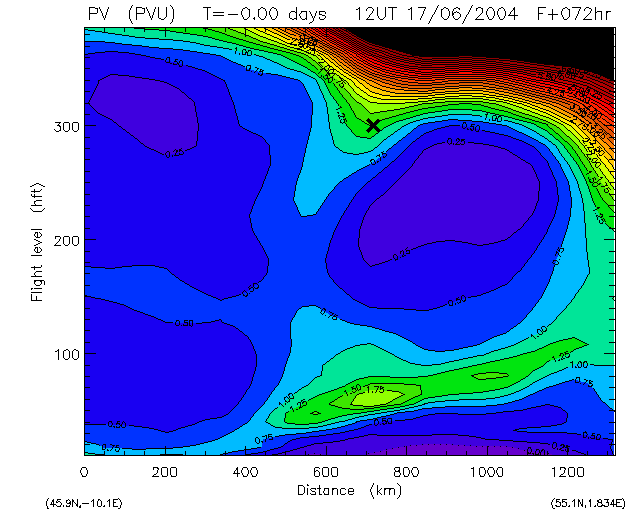
PV on section along dashed line direct from ECMWF forecast.
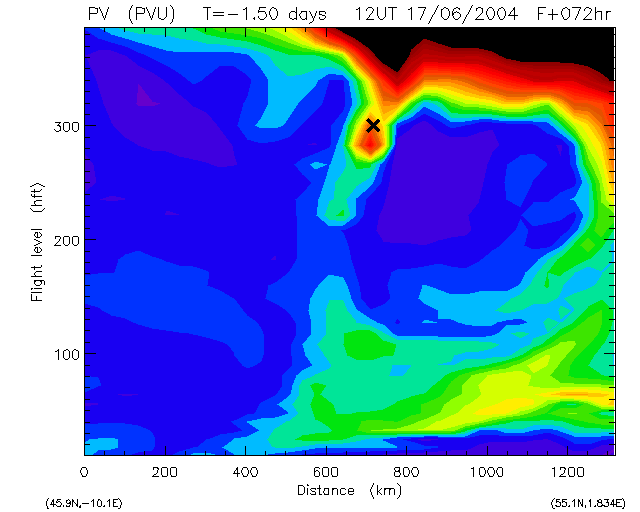
PV on section along dashed line, simulated using RDF3D.
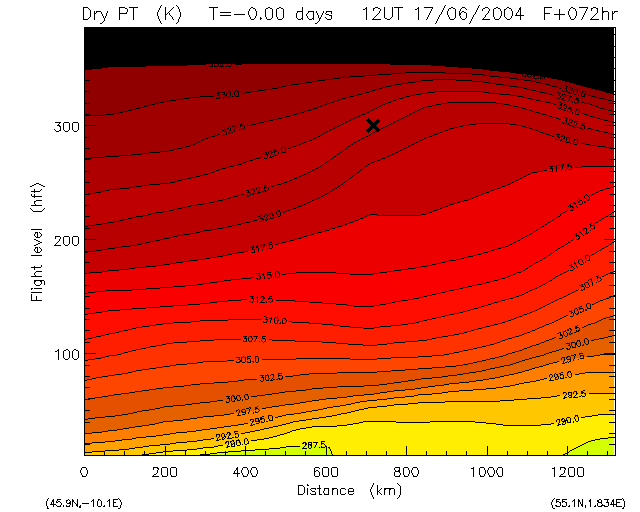
Potential temperature on section along dashed line direct from ECMWF forecast.
Previous plots of the day
Posted 26/5/04
Posted 27/5/04
Posted 28/5/04
Posted 2/6/04
Posted 3/6/04
Posted 15/6/04
Links
Home page
ITOP main page at the BADC
ICARTT forecasting page and bulletin board
NOAA Aeronomy Lab forecast products
John Methven's home page
|
|