|
|
|
ITOP Plots of the Day
Selected plots are posted here daily by the ITOP-UK group. They are
intended as discussion points for flight planning purposes.
Posted 18/6/04.
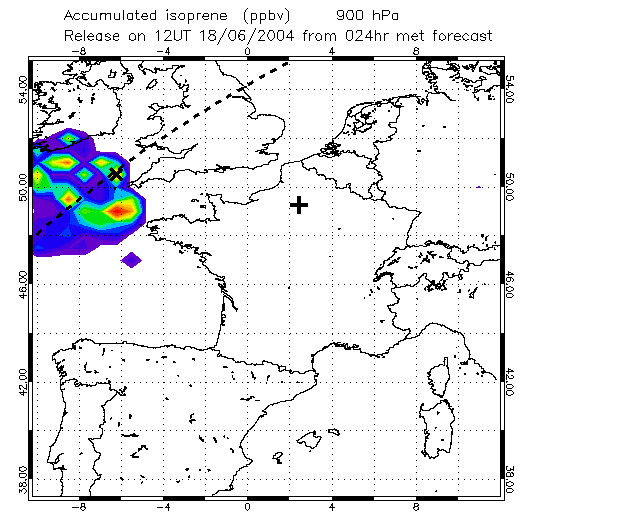
Fig.1: Friday flight. Isoprene emissions tracer at 900 hPa. Target interception west of Lands End (cross).
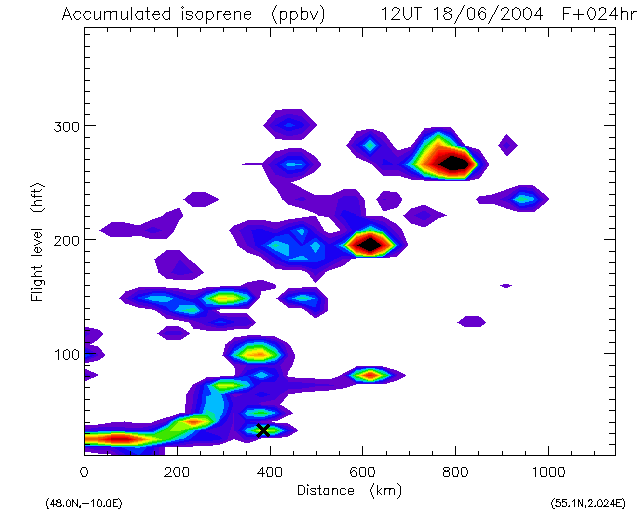
Fig.2: Section along the dashed line in Fig.1 showing isoprene emissions tracer (European emissions excluded). Cross marks target location. Air from N. American BL indicated between BL and FL100 at target.
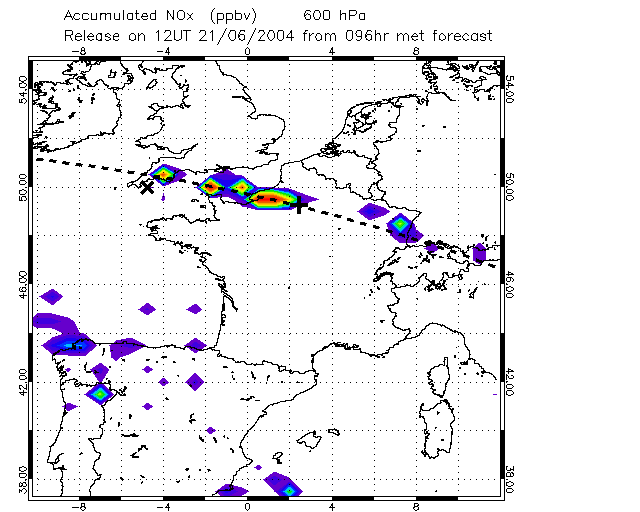
Fig.3: On Monday a very narrow filament of N. American air is forecast to be crossing over Devon. Would be hard to detect and will not be focus of flight.
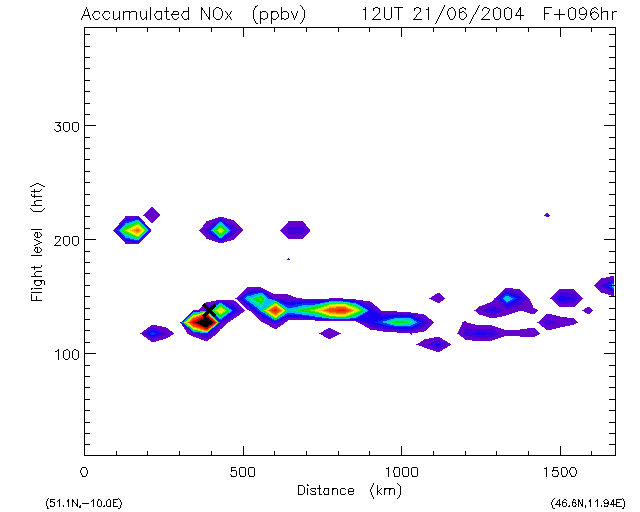
Fig.4: Section along the dashed line in Fig.3 showing aged polluted layer at about FL140.
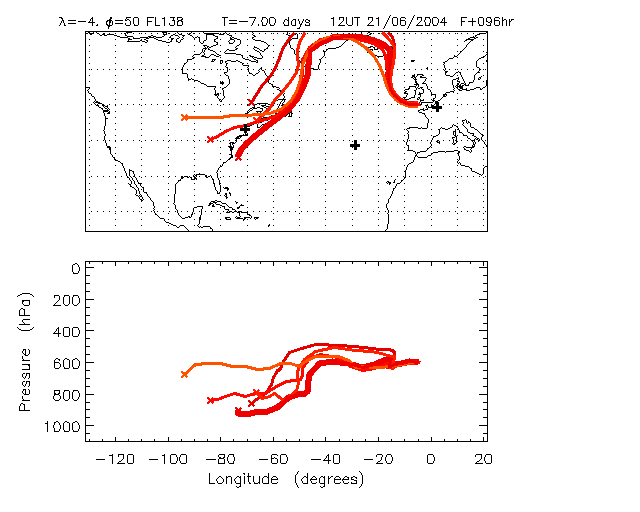
Fig.5: Trajectories back from cross on Figs. 3 and 4.
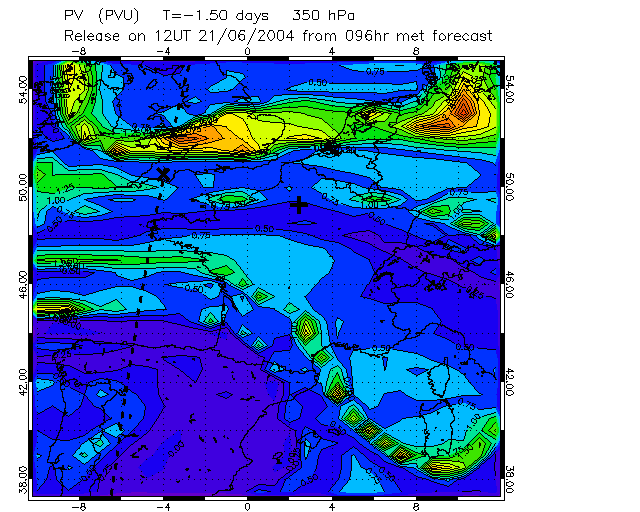
Fig.6: PV on 350hPa (FL270) showing orientation of weak tropopause folds. Note how the polluted filament is sandwiched inbetween.
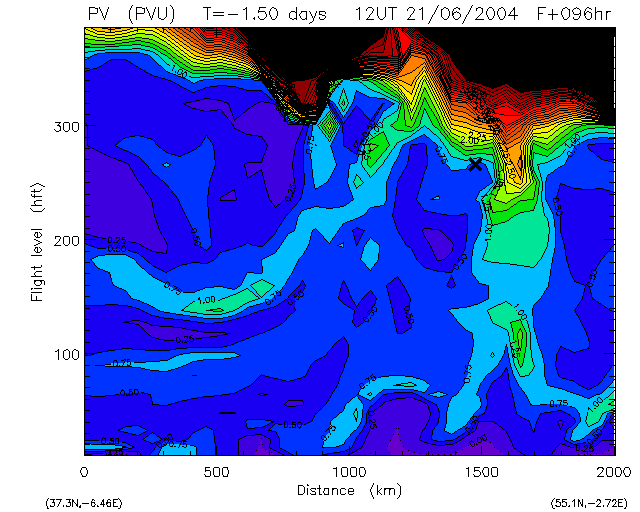
Fig.7: Section along the dashed line in Fig.6 showing PV and the
obvious lowered tropopause.
Previous plots of the day
Posted 26/5/04
Posted 27/5/04
Posted 28/5/04
Posted 2/6/04
Posted 3/6/04
Posted 15/6/04
Posted 16/6/04
Posted 18/6/04
Links
Home page
ITOP main page at the BADC
ICARTT forecasting page and bulletin board
NOAA Aeronomy Lab forecast products
John Methven's home page
|
|