|
|
|
ITOP Plots of the Day
Selected plots are posted here daily by the ITOP-UK group. They are
intended as discussion points for flight planning purposes.
Posted 6/7/04.
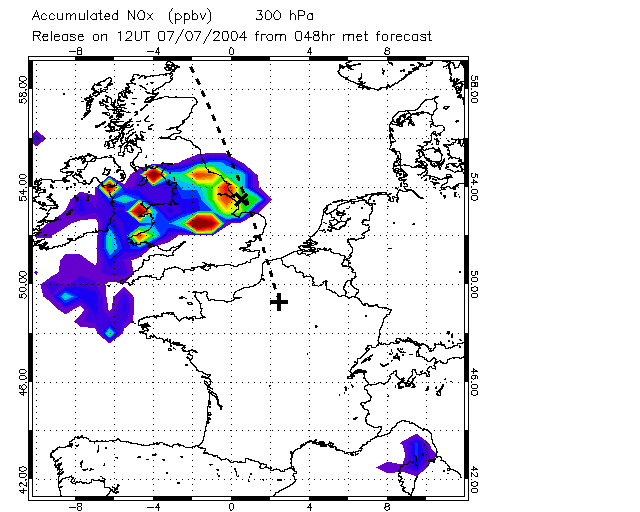
Fig.1: Comparison flight on Wednesday. NOx emissions tracer at 300 hPa
(FL300) originating from Spain. Too high for comparison flight leg but
it is the only level with significant layer of uplifted pollution
following the resolved flow. However air below is likely to have
experienced fresh emissions through convective transport within the
WCB.
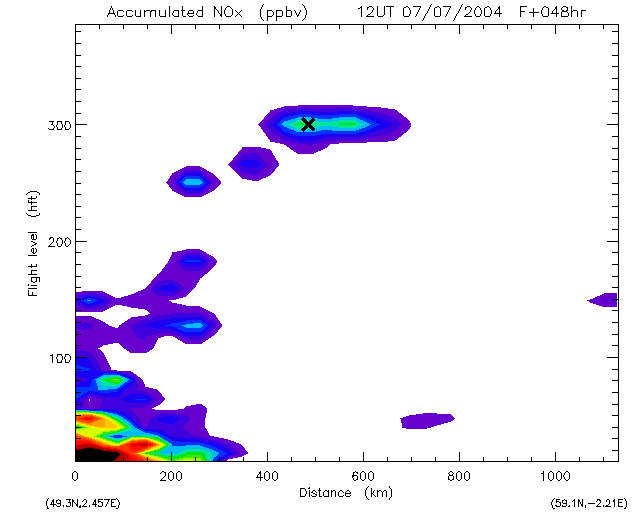
Fig.2: Section along the dashed line in Fig.1 showing NOx emissions tracer (European emissions included). Cross marks obvious layer with pollution tracer.
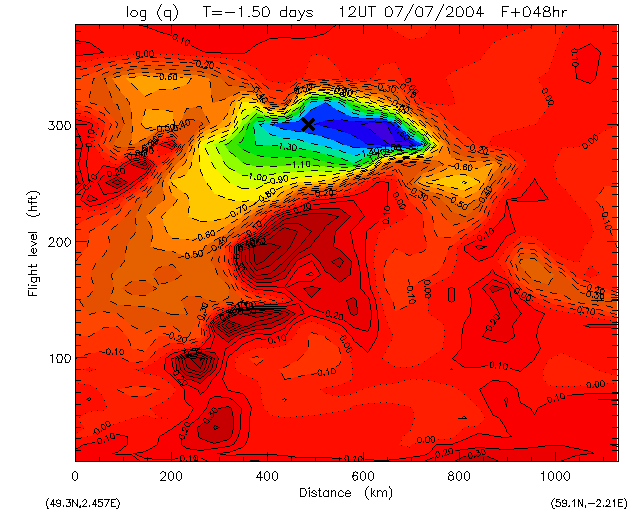
Fig.3: Change in specific humidity over the last 1.5 days following
trajectories. Negative (yellow to blue) region has experienced strong
loss of water vapour associated with ascent and condensation. Likely
to be cloudy air.
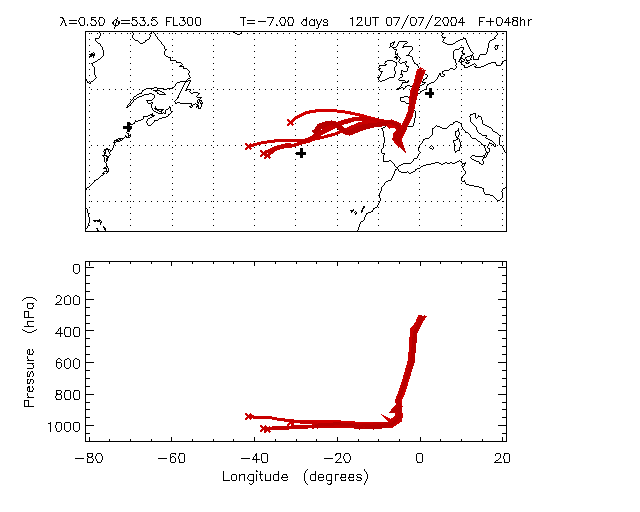
Fig.4: Trajectories back from cross on Figs. 1 and 2 showing how the ascending air has originated from the boundary layer over Spain.
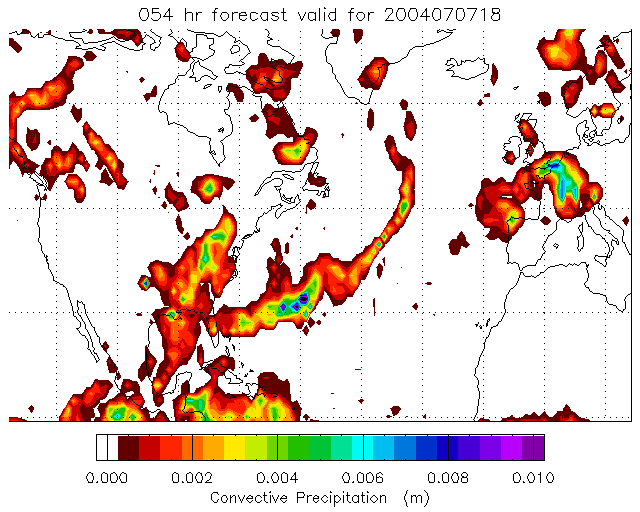
Fig.5: Convective precipitation averaged accumulated between 12UT and 18UT on 7/7/04. Rain moving towards north over period.
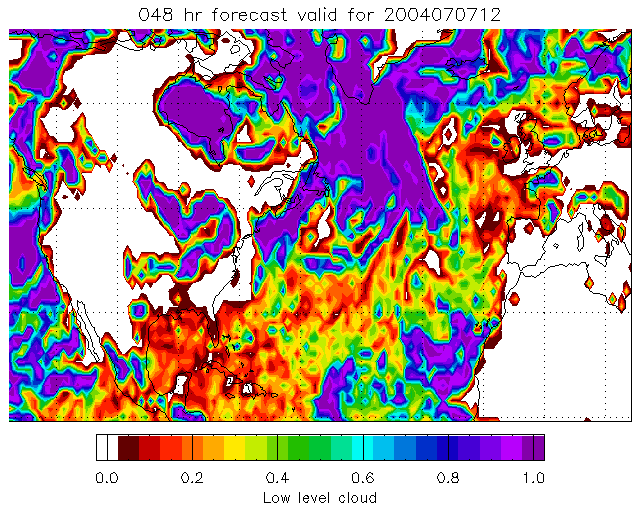
Fig.6: Low level cloud at 12UT 7/7/04.
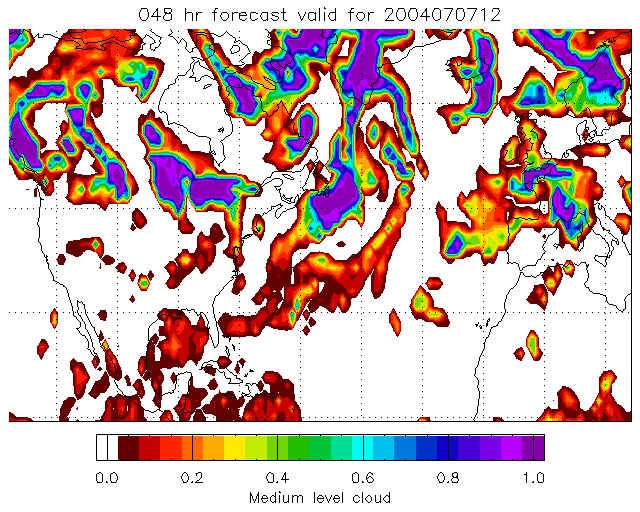
Fig.7: Mid level cloud at 12UT 7/7/04.
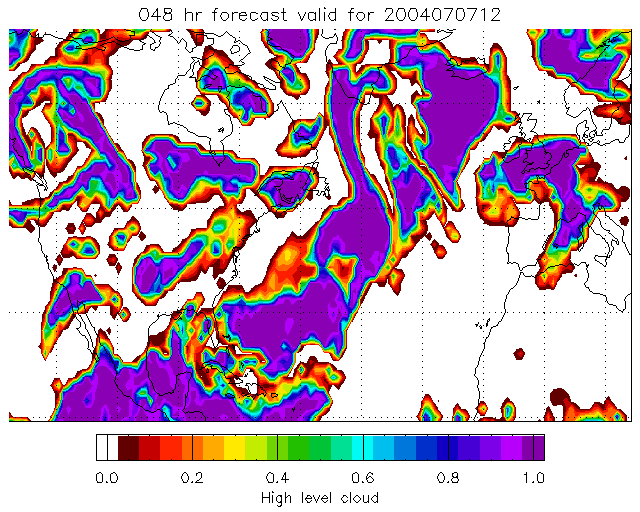
Fig.8: High level cloud at 12UT 7/7/04. Note cloud filling region where air has experienced ascent from Spain.
Previous plots of the day
Posted 26/5/04
Posted 27/5/04
Posted 28/5/04
Posted 2/6/04
Posted 3/6/04
Posted 15/6/04
Posted 16/6/04
Posted 18/6/04
Posted 25/6/04
Posted 29/6/04
Posted 6/7/04
Links
Home page
ITOP main page at the BADC
ICARTT forecasting page and bulletin board
NOAA Aeronomy Lab forecast products
John Methven's home page
|
|