|
|
|
ITOP Plots of the Day
Selected plots are posted here daily by the ITOP-UK group. They are
intended as discussion points for flight planning purposes.
Posted 29/6/04.

Fig.1: Possible flight on Wednesday. NOx emissions tracer at 375 hPa (FL250). Target interception north of Cornwall and Devon (cross).
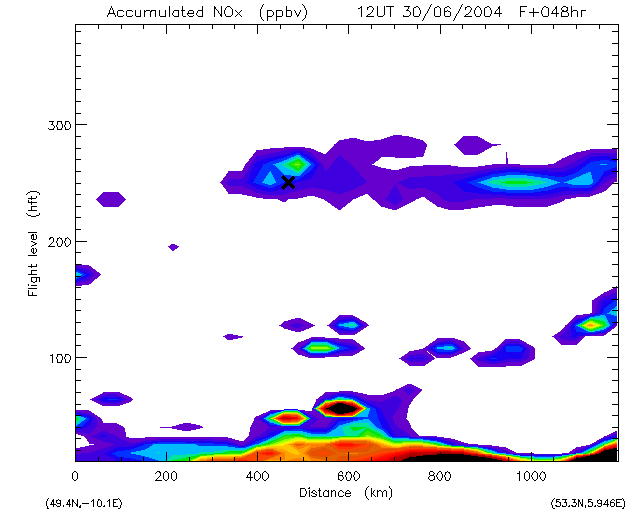
Fig.2: Section along the dashed line in Fig.1 showing NOx emissions tracer (European emissions included). Cross marks target location in obvious layer with pollution tracer (low levels in NOx but more pronounced in isoprene emissions tracer).
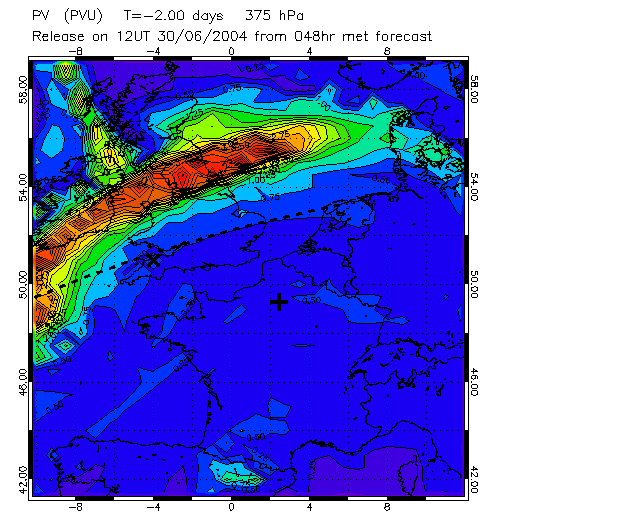
Fig.3: PV on FL250 showing a tropopause fold running parallel and to the north of the polluted layer.
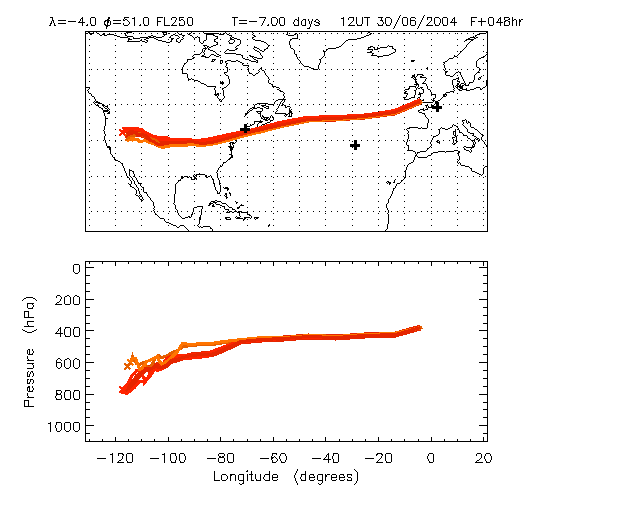
Fig.4: Trajectories back from cross on Figs. 1 and 2. Generally back trajectories from polluted layer originate from US West Coast. More than 6 days old.
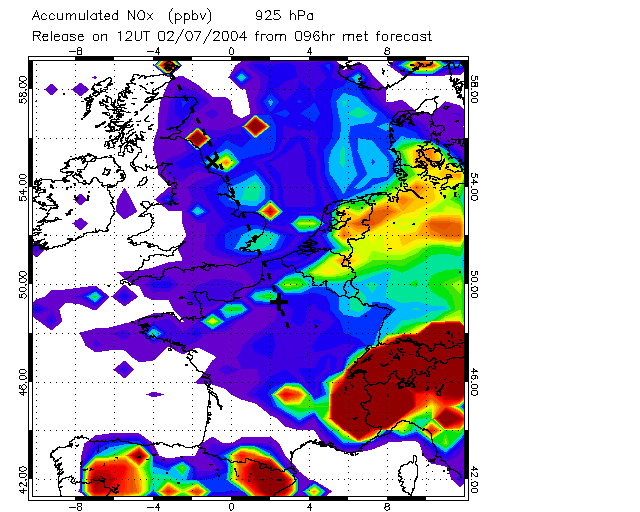
Fig.5: Possible flight on Friday. NOx emissions tracer at 925 hPa. Boundary layer runs along East coast off Teesside and Tyneside (cross).
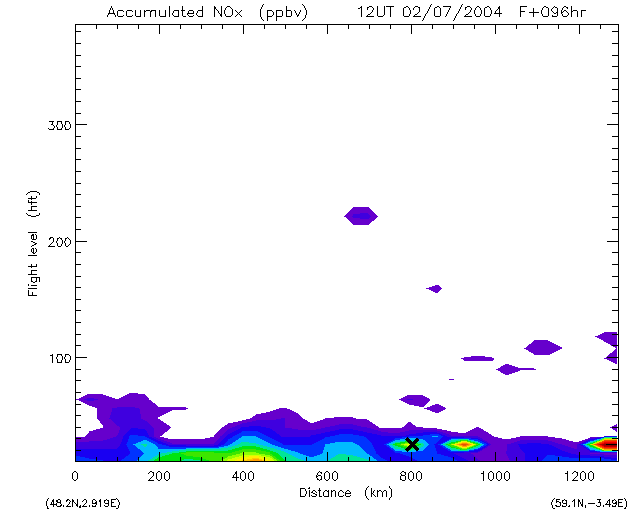
Fig.6: Section along the dashed line in Fig.5 showing NOx emissions tracer (European emissions included). Emissions picked up from London, Manchester/Leeds, NE and Central Scotland can be seen.
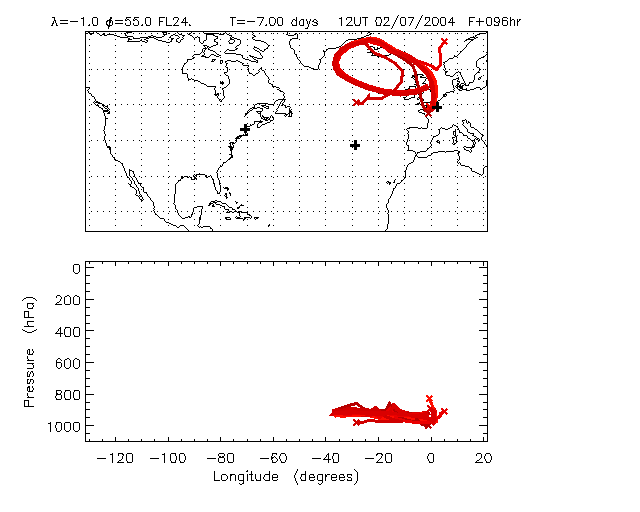
Fig.7: Trajectories back from cross on Figs. 5 and 6.
Previous plots of the day
Posted 26/5/04
Posted 27/5/04
Posted 28/5/04
Posted 2/6/04
Posted 3/6/04
Posted 15/6/04
Posted 16/6/04
Posted 18/6/04
Posted 25/6/04
Posted 29/6/04
Links
Home page
ITOP main page at the BADC
ICARTT forecasting page and bulletin board
NOAA Aeronomy Lab forecast products
John Methven's home page
|
|