Intercontinental Transport of Ozone and its Precursors -
Forecast Trajectories
ITOP Plots of the Day
Selected plots are posted here daily by the ITOP-UK group. They are
intended as discussion points for flight planning purposes.
Posted 11/7/04.
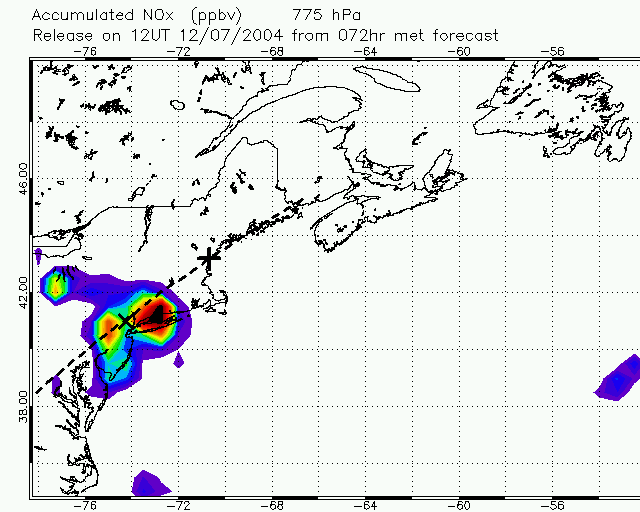
Fig.1: Nox emissions tracer over US domain at 775hPa.
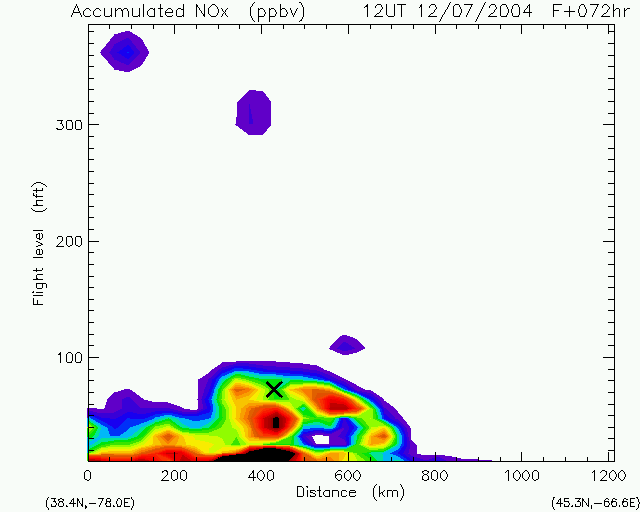
Fig.2: Section along the dashed line in Fig.1 showing NOx emissions tracer. Cross marks layer which also passes within range of the Azores and Europe.
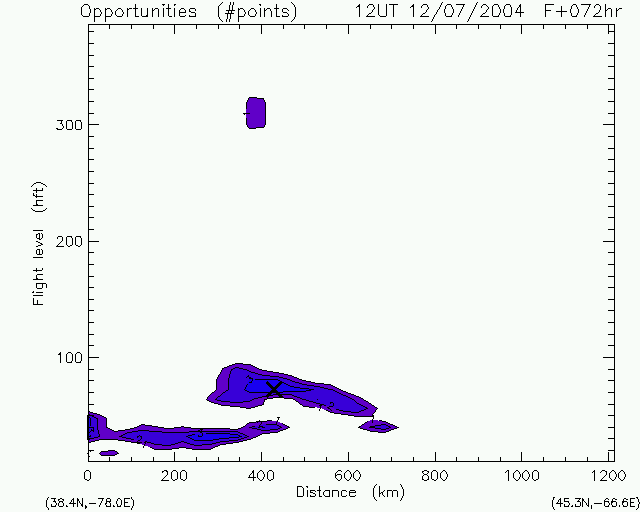
Fig.3: Same section but showing Lagrangian opportunities.
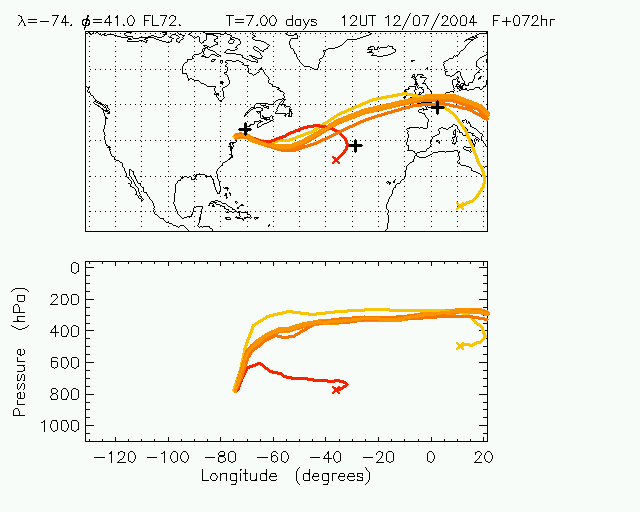
Fig.4: Trajectories forward from cross on Figs. 1 and 2 showing path past Azores (range about 1000km) and towards UK.
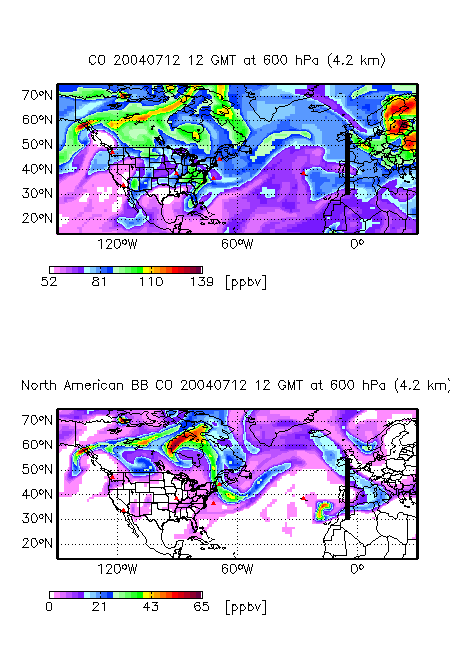
Fig.5: GEOS-chem forecasts showing total CO and biomass burning CO for 12/7/04 at 600hPa.
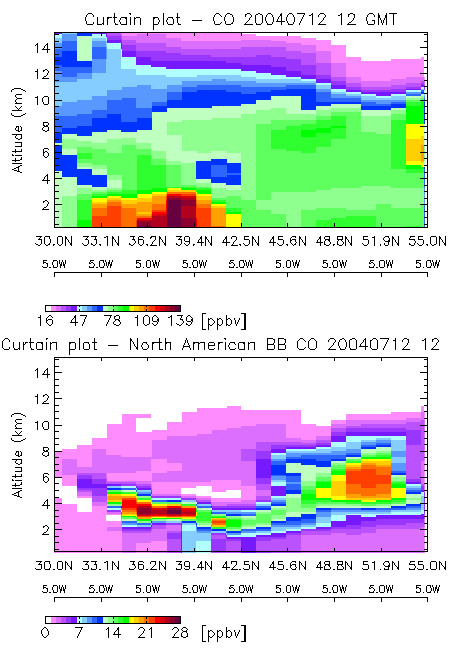
Fig.6: GEOS-chem forecasts showing total CO and biomass burning CO along section shown on Fig.5.