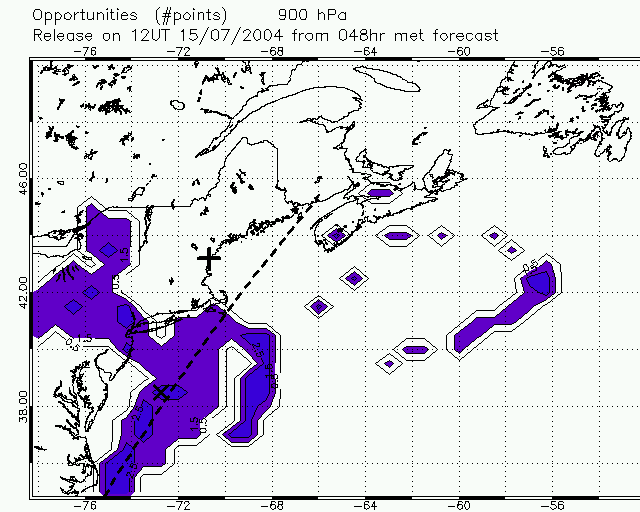
Fig.2: Lagrangian opportunities - number of bases (n). Wherever n>1.5 the forward trajectories pass within range of the Azores (and NOx emissions tracer > threshold). Wherever n>2.5 the trajs pass within range of the Azores and Creil.
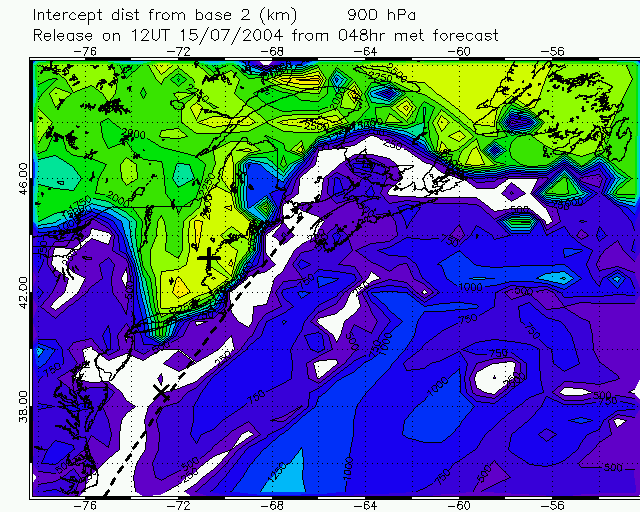
Fig.3: Closest approach of forward trajectories to Horta (Azores).
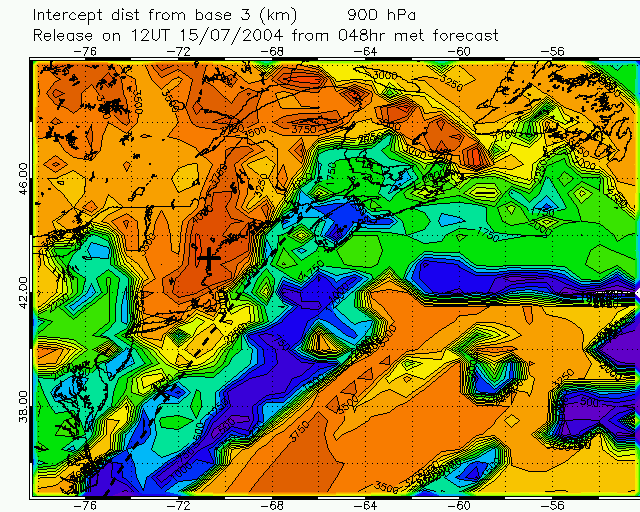
Fig.4: Closest approach of forward trajectories to Creil (France).
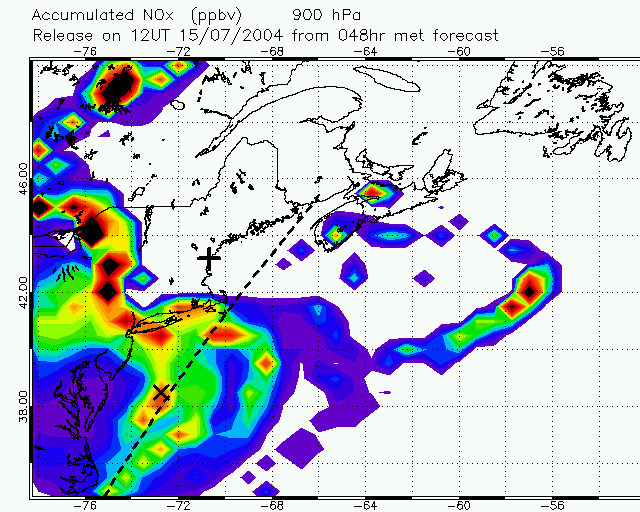
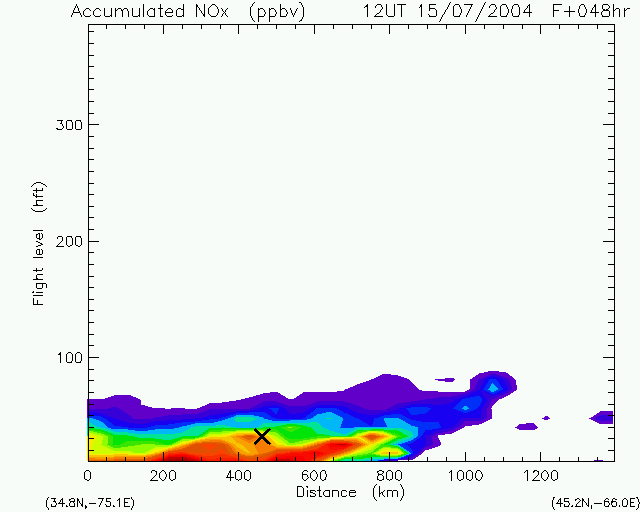
Fig.5: Section along the dashed line in Fig.1 showing NOx emissions tracer. Cross marks layer which also passes within range of the Azores and Europe.
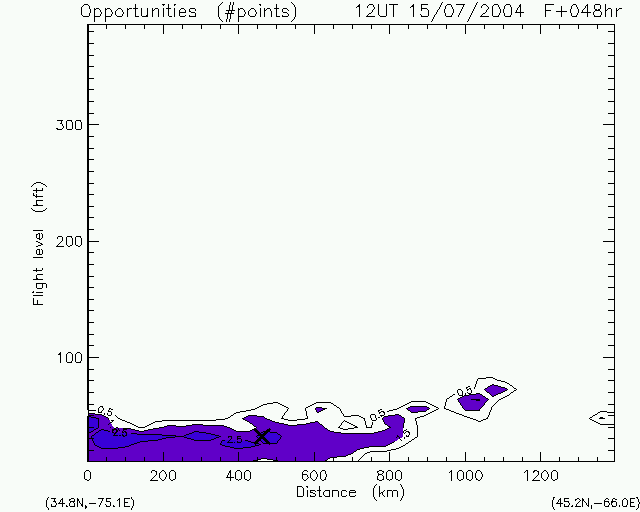
Fig.6: Same section but showing Lagrangian opportunities.
Fig.7: Trajectories forward from cross on Figs. 1 and 5 showing a split close to the Azores. Those to the south of section 5 (see also fig 4) head towards the UK, those on the north of the section curve into the Azores High.