|
|
|
ITOP Plots of the Day
Selected plots are posted here daily by the ITOP-UK group. They are
intended as discussion points for flight planning purposes.
In addition you can view
forward trajectories from the P3, DC8 and BA146 flight tracks during the ICARTT experiment.
Posted 21/7/04.
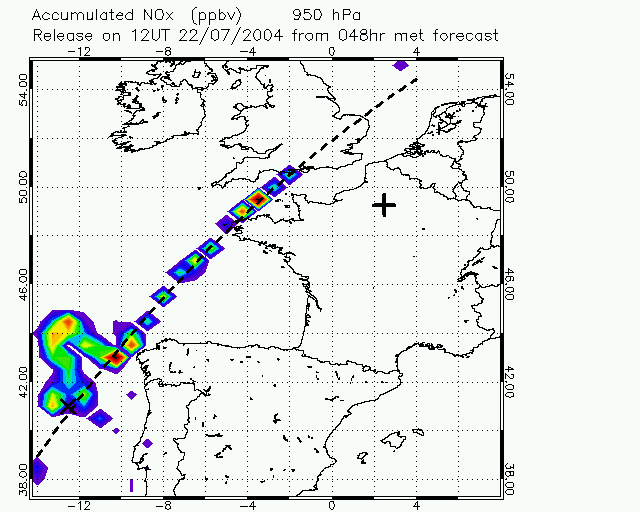
Fig.1: Flight on 22 July. NOx emissions tracer over European domain at 950hPa (12UT). The cross marks the air that has already been sampled by the P3 on 15/7/04 off the coast of New York and by the BA146 on 19/7/04 at 46N, 23W.
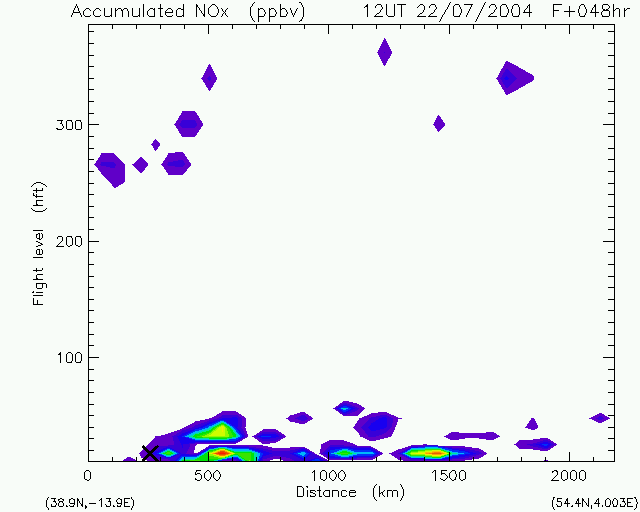
Fig.2: Section along the dashed line in Fig.1 showing NOx emissions tracer. Cross marks layer which has already been sampled. Please note that the bottom of the y-axis is 1000ft.
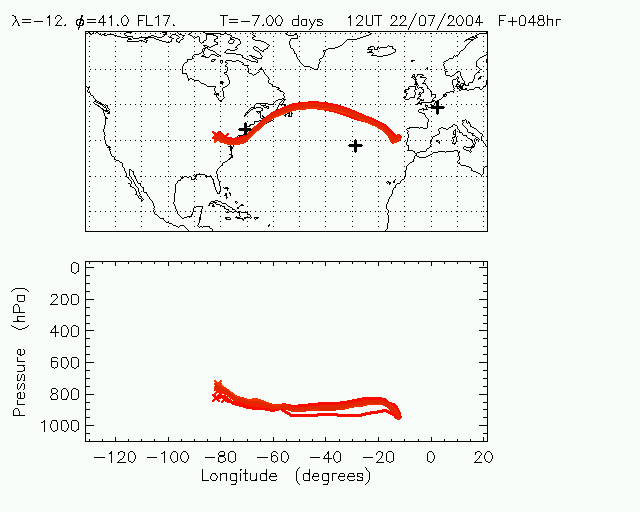
Fig.3: Back trajectories from the cross on Figs. 1 and 2.
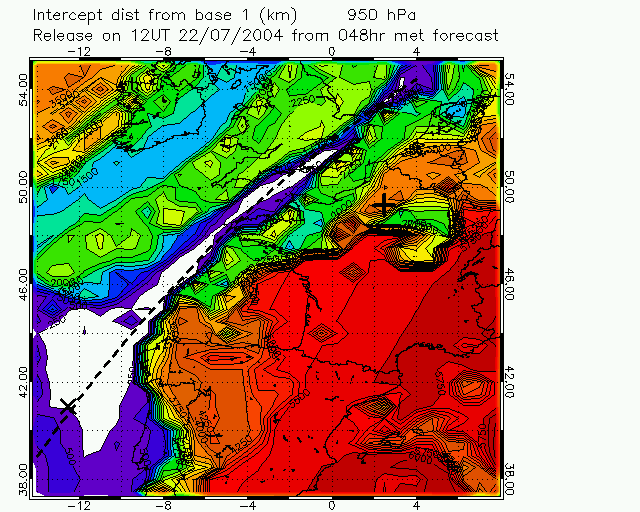
Fig.4: Closest approach of back trajectories to Pease, New Hampshire.
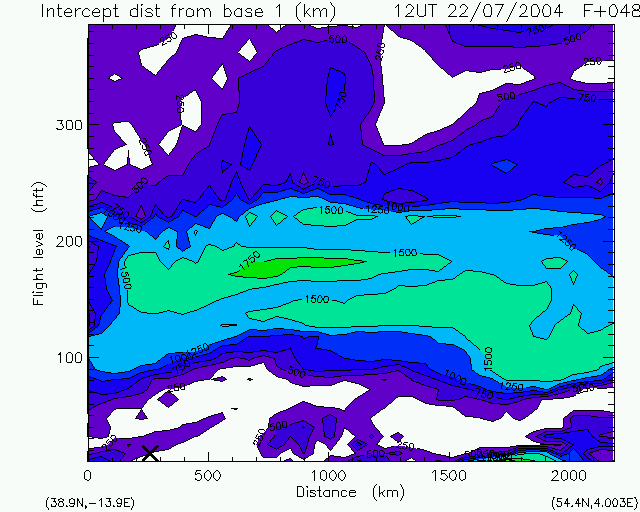
Fig.5: Section along the dashed line in Fig.4 showing closest approach of back trajectories to Pease.
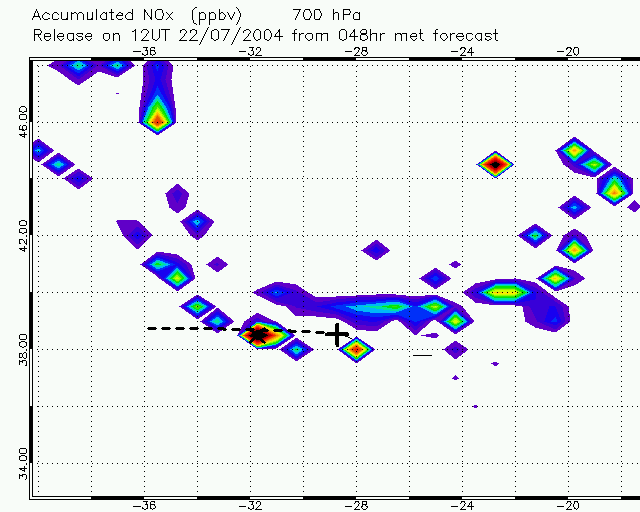
Fig.6: Flight on 22 July. NOx emissions tracer over Azores domain at 700hPa (12UT).
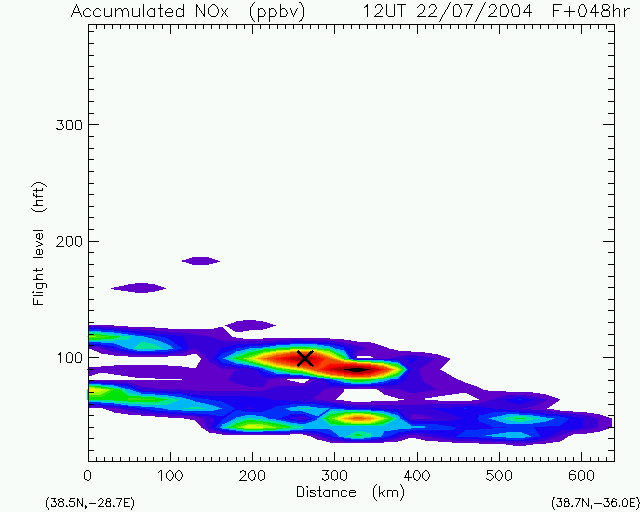
Fig.7: Section along the dashed line in Fig.6 showing NOx emissions tracer. Cross marks layer is heading for France.
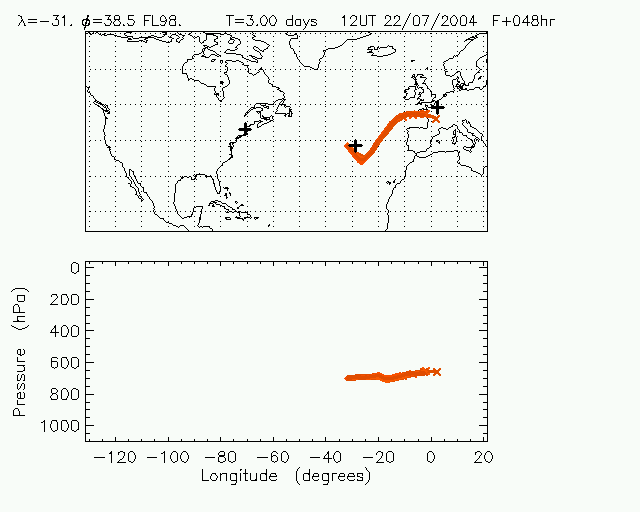
Fig.8: Forward trajectories from the cross on Figs. 6 and 7.
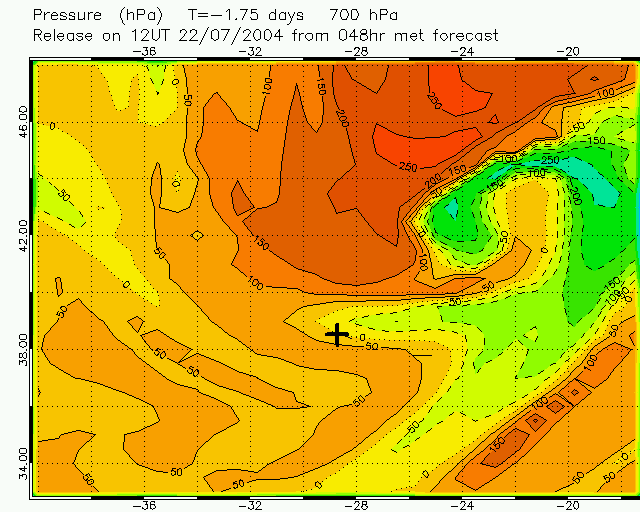
Fig.9: Flight on 22 July. Change in pressure along 1.75 day back trajectories showing regions of recent ascent (green) and descent (red). A frontal wave cyclone to the NE of Faial is clearly seen. The American pollution lies within the warm conveyor belt and along the cold front behind to the west (over Faial).
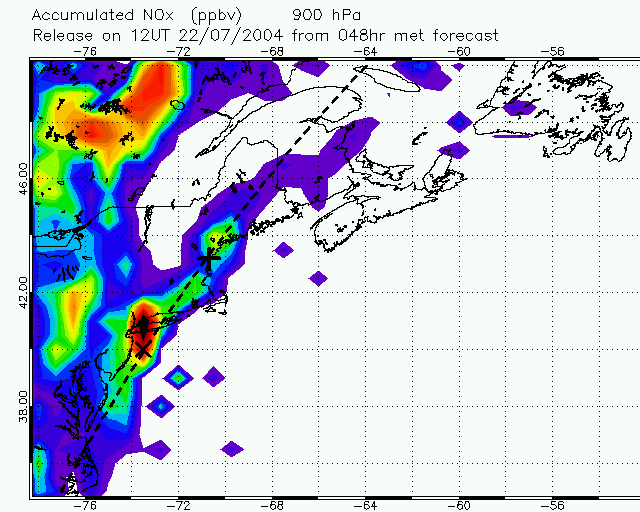
Fig.10: Flight on 22 July. NOx emissions tracer over US East coast domain at 900hPa (12UT).
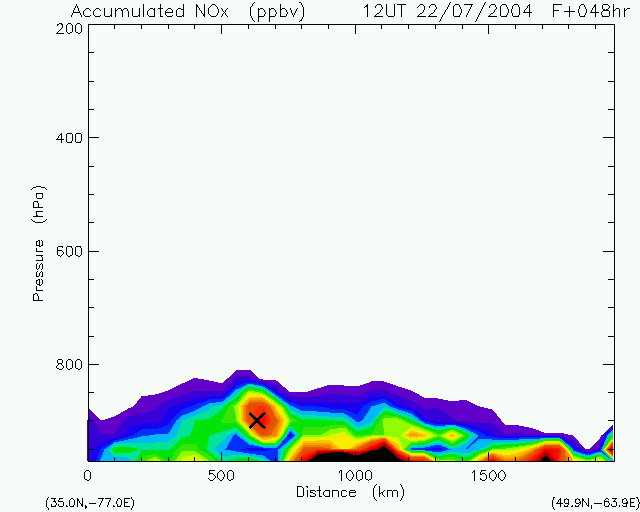
Fig.11: Section along the dashed line in Fig.10 showing NOx emissions tracer.
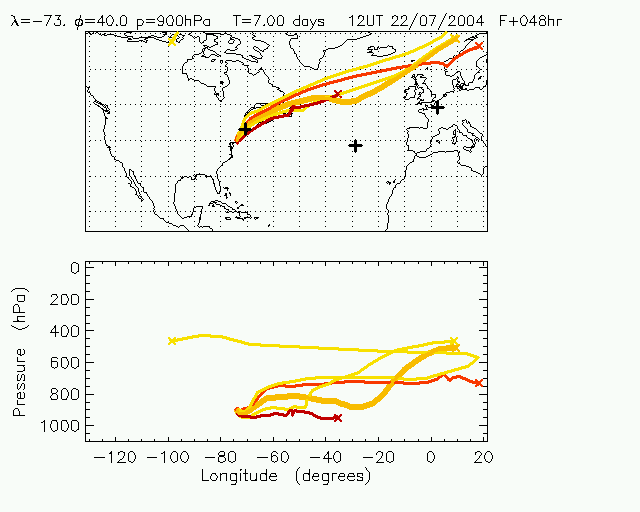
Fig.12: Forward trajectories from the cross on Figs. 10 and 11. Heading out of range of BA146 in Azores and probably DLR Falcon in Creil.
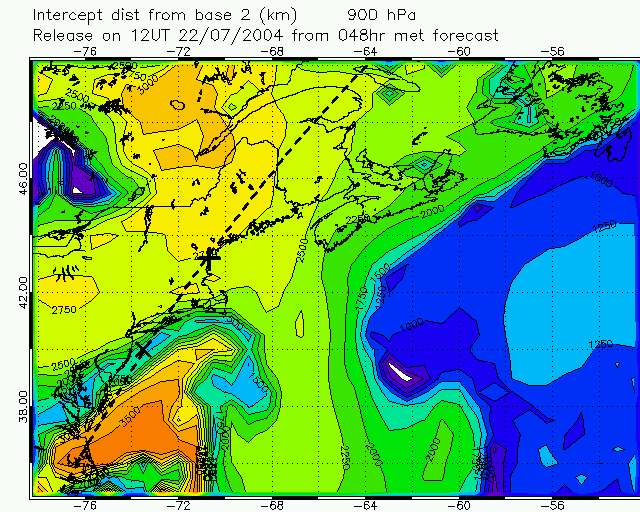
Fig.13: Flight on 22 July. Closest approach of forward trajectories from 900hPa to Faial, Azores.
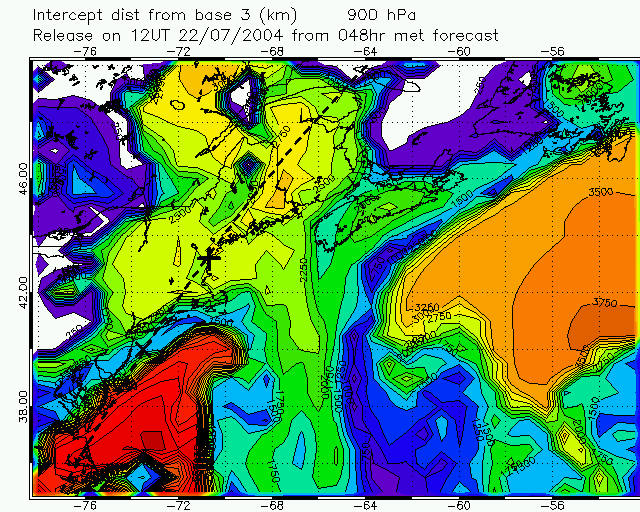
Fig.14: Flight on 22 July. Closest approach of forward trajectories from 900hPa to Creil, France.
Forward trajectories from the P3, DC8 and BA146 flights during the ICARTT experiment.
Previous plots of the day
Posted 26/5/04
Posted 27/5/04
Posted 28/5/04
Posted 2/6/04
Posted 3/6/04
Posted 15/6/04
Posted 16/6/04
Posted 18/6/04
Posted 25/6/04
Posted 29/6/04
Posted 6/7/04
Posted 7/7/04
Posted 11/7/04
Posted 14/7/04
Posted 21/7/04
Links
Home page
ITOP main page at the BADC
ICARTT forecasting page and bulletin board
NOAA Aeronomy Lab forecast products
John Methven's home page
|
|