Intercontinental Transport of Ozone and its Precursors -
Forecast Trajectories
ITOP Plots of the Day
Selected plots are posted here daily by the ITOP-UK group. They are
intended as discussion points for flight planning purposes.
In addition you can view
forward trajectories from the P3, DC8 and BA146 flight tracks during the ICARTT experiment. Posted 31/7/04.
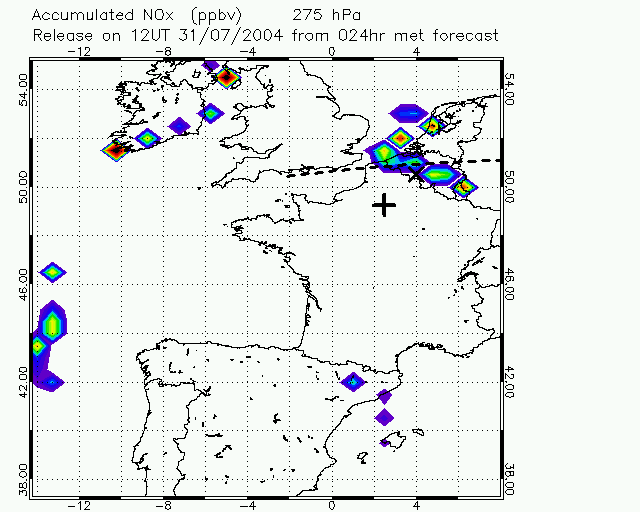
Fig.1: European domain at 12UT 31 July. NOx emissions tracer on 275hPa (FL320). The cross marks the pollution exported within the WCB.
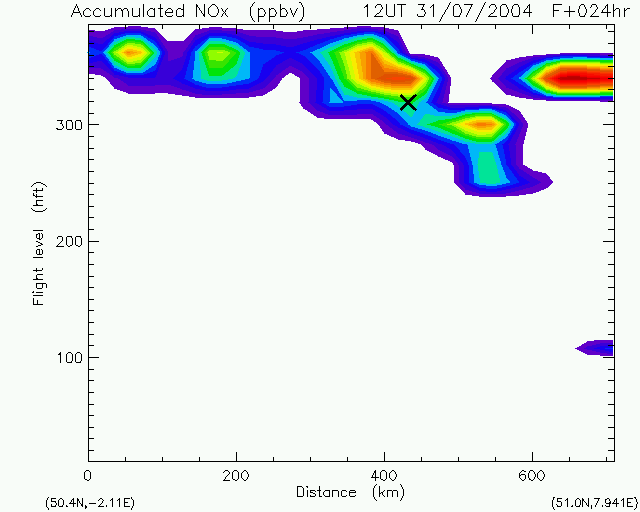
Fig.2: Section along the dashed line in Fig.1 showing accumulated NOx. The part of the WCB sampled by the BA146 on 29 July is at FL250-FL300 (the lowest portion).
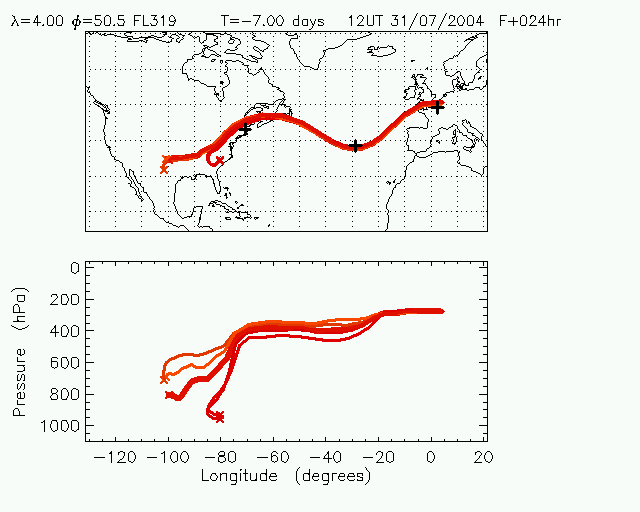
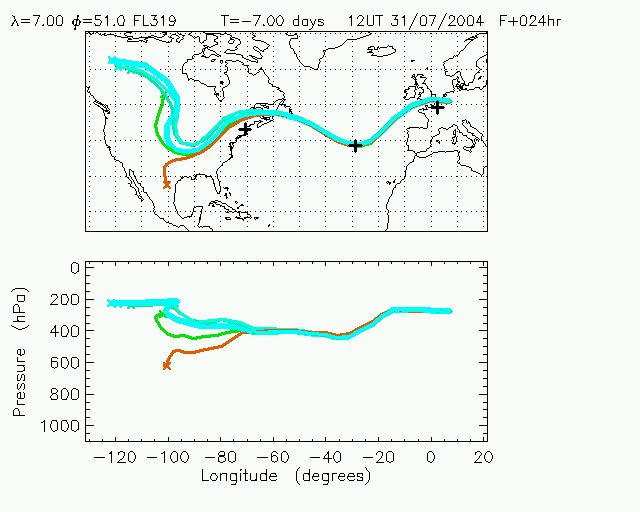
Fig.3: Back trajectories in the WCB (the cross on Fig. 1). Join the dots between Pease, Faial and Creil!
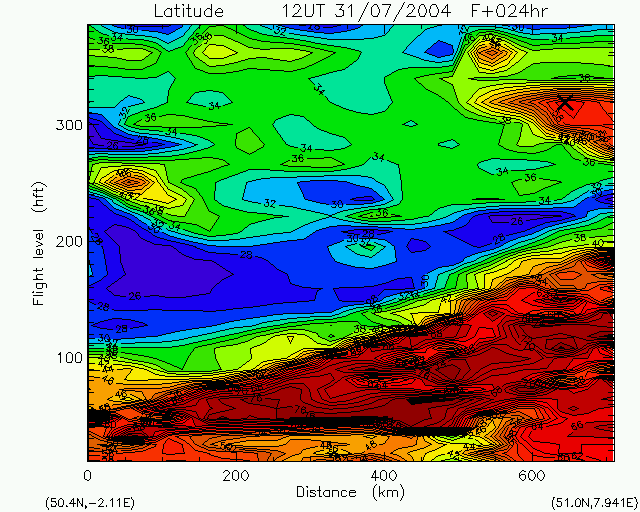
Fig.4: Latitude of trajectory origins 7 days before arrival. Air from over Canada containing forest fire emissions is marked by the cross (FL280-FL320). The part sampled by the BA146 on 29 July would be at FL280.
Fig.5: Back trajectories from the cross in Fig.4 tracing back towards Northern Territories where forest fires are burning.