
September 2014:
Has global warming taken a holiday?
Observations covering the past few decades have shown a decline in the rate at which the Earth's surface has been warming (see graph below). Yet recent research involving the University of Reading, the Met Office and NASA shows that if anything the Earth is gaining heat at an increasing rate. How can this be the case?
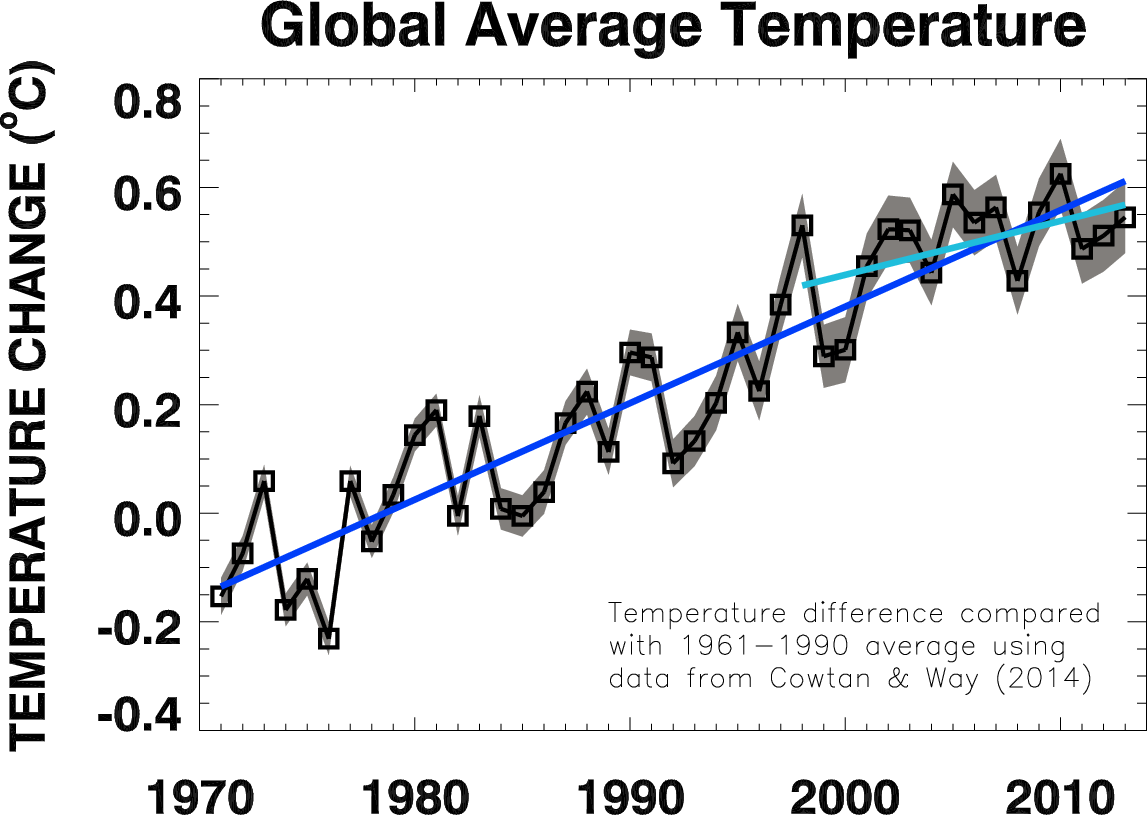
Observed changes in global annual average surface temperature relative to 1961-1990 from the HadCRUTv4 dataset which is updated to account for gaps in data coverage (version 2.0 Long Reconstruction).
As we all know from boiling up our pan of vegetables for dinner you have to put in quite a bit of energy to raise the temperature of water: approximately 4000 Joules to heat a kilogram of water by 1 degree Celsius. And it turns out that Earth's capacity to take up heat is primarily determined by our vast oceans, all 1.4 billion billion tons of them (1.4×10²¹ kg).
As greenhouse gas concentrations continue to rise, the efficiency at which Earth can cool to space through infra-red radiative emission decreases. This sends the planet out of balance, with more energy arriving through absorbed sunlight than leaving through infra-red radiation. The heating effect is modified by knock-on effects which can amplify or reduce the warming effect through vicious cycles or "feedbacks". For example, as the atmosphere warms, observations and basic physics indicate that moisture content in the air becomes larger. This increases the strength of the greenhouse effect, and therefore the overall heating effect, still further. Inexorable rises in greenhouse gas concentrations have driven a radiative imbalance which has led to global warming at the surface that has been amplified by the associated increases in atmospheric moisture over the last 40 years.
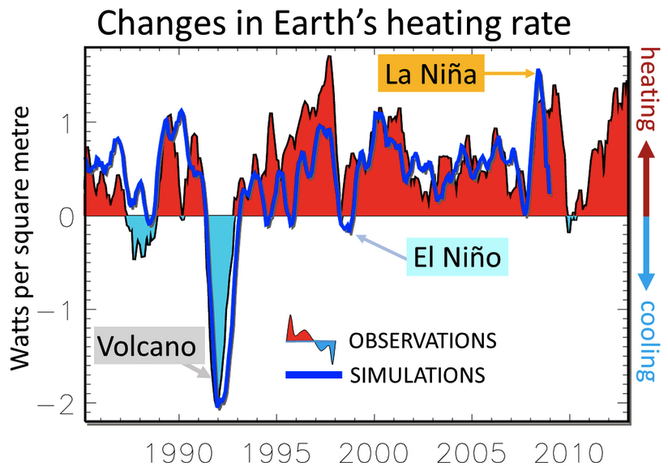
Changes in Earth's yearly average heating rate in observations and simulations 1985-2013. Shown here are an average of 9 simulations which applied observed surface temperatures and were adjusted to match the observed average heating rate over the 2005-2010 period. Earth loses heat following large volcanic eruptions such as Mt. Pinatubo in 1991 and during the strongest El Niño events such as 1998 while the heating rate becomes larger during La Niña episodes.
So what explains the more recent diminishing rate of surface warming? A number of small volcanic eruptions (which act to make the planet more reflective) and a slightly weaker sun in the 2000s compared to the late 1990s are thought to have offset some of the heating effect of rising greenhouse gas concentrations. However, our recent analysis of satellite data, ocean measurements and detailed simulations (see illustration above) indicates that Earth's heating rate has not diminished over the period 1985-2012. And if anything it has increased. Currently heat is accumulating at a rate approximately equivalent to every person worldwide using 20 kettles each to continuously boil the oceans. That's a big tea party.
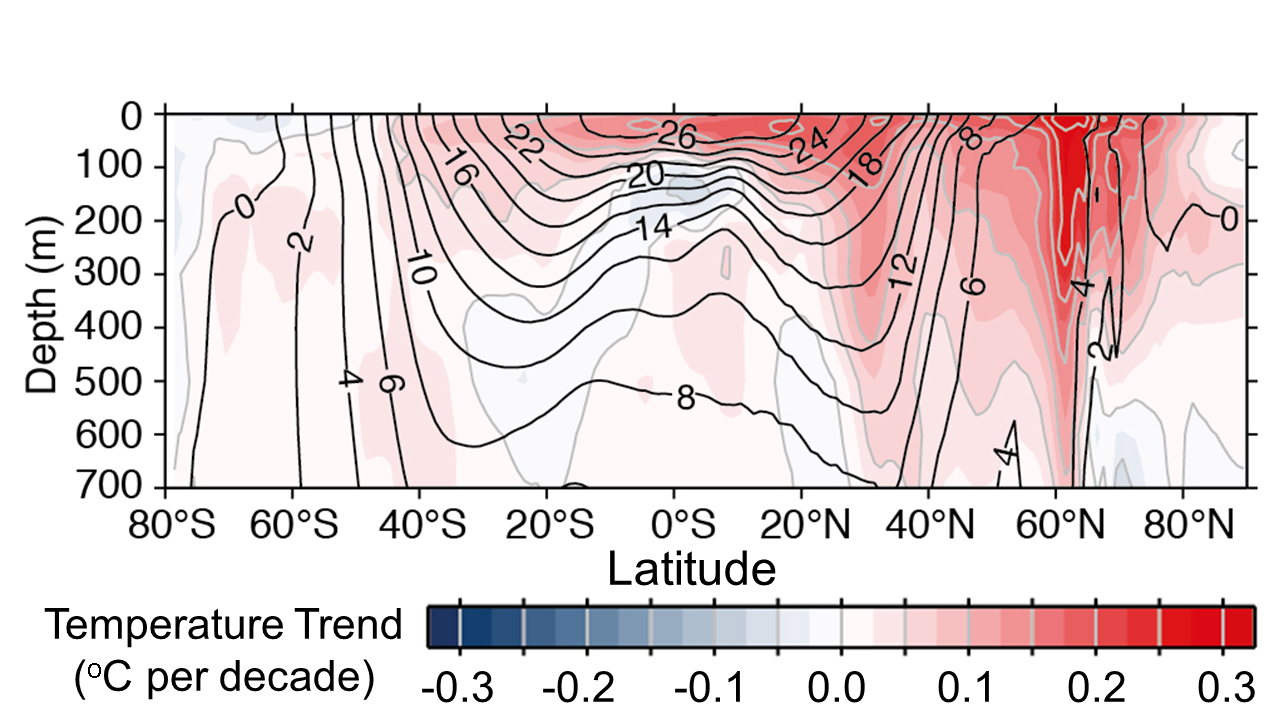
Observed warming rate (in degrees Celsius per decade) in the upper 700 metres of the ocean averaged over lines of latitude for the period 1971-2010 (colours) with average ocean temperature also shown (black contour lines in degrees Celsius). Source: IPCC (2013) Working Group 1 assessment report, Figure 3.1b.
If this accumulated heat was distributed evenly throughout the oceans, temperatures would rise by a paltry 0.017 degrees Celsius each decade(*). But only the upper layers of the ocean are well mixed over the course of a year or a decade and exchanging energy between the surface layers and the deep sea can be a glacially slow processes for much of ocean. Observations and simulations demonstrate that the upper ocean (see diagram above) has warmed up much more than deeper layers with some parts of the deep abyss (down below 4 kilometres) and the 2-3 kilometer deep layer in the Indian and Pacific oceans apparently blissfully unaware that anything untoward is occurring at the surface!
Recent research indicates that natural fluctuations within the ocean are stealing some of the heat from the surface layers thereby depriving the atmosphere of the ocean surface warmth. Changes in the Pacific and Atlantic oceans have been implicated as the prime suspects. Debate continues as to whether strengthening winds in the Pacific has helped to bury heat just a few hundred metres below the surface or if slow changes in the global ocean circulation is causing greater uptake at deeper levels in the North Atlantic and Southern Oceans. These ocean basins are fully interconnected and recent unusual changes in the tropics also influence remote locations such as Europe and the Arctic via atmospheric "bridges". In such a complicated system it can, however, be all too easy to conclude that the tail is wagging the dog.
It has been long known that surface temperatures will not rise smoothly in response to increasing greenhouse gas concentrations; other heating and cooling factors including changes in the sun, volcanic eruptions and particle "aerosol" pollution influence Earth's overall heating rate. And natural fluctuations within our vast oceans from one decade to the next determine what proportion of that heat warms the surface layers and what part is gobbled up by deeper levels. Understanding these processes are vital in gauging the likely rates of global and regional warming associated with human activities, important for how we plan for and adapt to future climate change. These are important topics of research being tackled here by members of the University of Reading's Walker Institute and Meteorology department and worldwide as detailed in the latest assement by the Intergovernmental Panel on Climate Change.
* - If the Earth is heating at 0.6 Watts per square metre and there are 5.1×10¹⁴ square metres globally, the build up of heat is about 3×10¹⁴ Joules of energy per second which is 9.5×10²² Joules per decade. Making a rough approximation, assuming the specific heat capacity of sea water is about 3900 Joules per kg per degrees Celsius and the total mass of the oceans is 1.4×10²¹ kg this would mean that it would take 5.5×1024 Joules (5.5 trillion trillion Joules) to heat the entire ocean by 1 degrees Celsius. Then we simply divide the heating rate (9.5×10²² Joules per decade) by 5.5×1024 Joules per degrees Celsius to get 0.017 degrees Celsius per decade (so it would take about 600 years to raise the temperature by 1 degrees Celsius). In reality most of this energy has been heating the upper few hundred metres (see diagram above), explaining why temperatures have been rising at around ten times this rate since 1970.
A growing list of journal articles discussing aspects of the slowdown in global average surface warming are available on the NERC funded DEEP-C project website.
Richard P. Allan Location: Department of Meteorology (2U15)
