
October 2013:
40 years of Climate Change
I have just completed my 40th year on the planet!

During this short time I became interested in weather following the snowy winter of 1981/82 in Hertfordshire, England, and soon became fascinated by past climate change when ice sheets spread over much of the UK. I learnt about the greenhouse effect in the late 1980s and how human activity was increasing its potency and that pretty much lead me to where I am now, working on understanding variability and change in Earth's climate and teaching what I've learnt and am continuing to learn to students.
During these 40 years, apart from the most obvious changes (specifically that there is less dogs muck on the pavements than there used to be) there have been substantial alterations to our planet that are generally less noticeable.
1) The world population has nearly doubled from just under 4 billion in 1973 to over 7 billion today.
2) A relatively rich minority of this population has disproportionally contributed to a rapid rise in carbon dioxide (CO2) in the atmosphere (see for example slide 43 of Kevin Anderson's talk illustrating Pareto's 80:20 rule). Since 1973 CO2 levels have risen by about 20% from below 330 parts per million by volume (ppm) to nearly 400 ppm (see Mauna Loa record). Atmospheric CO2 concentrations would have risen to much higher levels but for the large proportion of emissions that have been absorbed by the oceans, causing them become less alkaline.
3) The enhanced greenhouse effect from rises in atmospheric CO2 and other greenhouse gases that are also long lived and therefore well mixed in the atmosphere, such as methane and nitrous oxide, have impeded the natural planetary cooling effect through emission of infra-red radiation to space, leading to heating. Around a quarter of this heating has been offset by cooling from aerosol particle pollution which causes more sunlight to be reflected back to space. The overall influence of human activity over the last 40 years has been to cause a steady increase in heating of the planet, estimated in the recent working group I of the 2013 IPCC report as 1.25 Watts per square metre in 1980 (1.25 Joules of energy per second for each of the 510,072,000,000,000 square metres covering the global surface) rising to 2.29 Watts per square metre in 2011.
4) As the planet warms in response to this heating effect (termed a radiative forcing of climate since the radiative energy balance of the planet is being altered) some of this energy is lost to space. The remainder has caused energy to rapidly accumulate, primarily in the oceans. Despite the recent slowdown in warming of the planet's surface over the last 15 years, the oceans have continued to heat up, currently at a rate equivalent to each human on the planet using twenty 2kW kettles to continuously boil the sea.
5) The warming oceans heat up the air above. Global surface air temperatures have risen by about 0.5oC since 1973 (see Met Office observations and the top panel of the graph below). This doesn't sound much but it is actually about 10% of the global temperature change between now and the last glacial period
when ice sheets reached as far as Britain (for example simulations of the last glacial maximum 20,000 years ago show global temperatures around 5oC colder than today)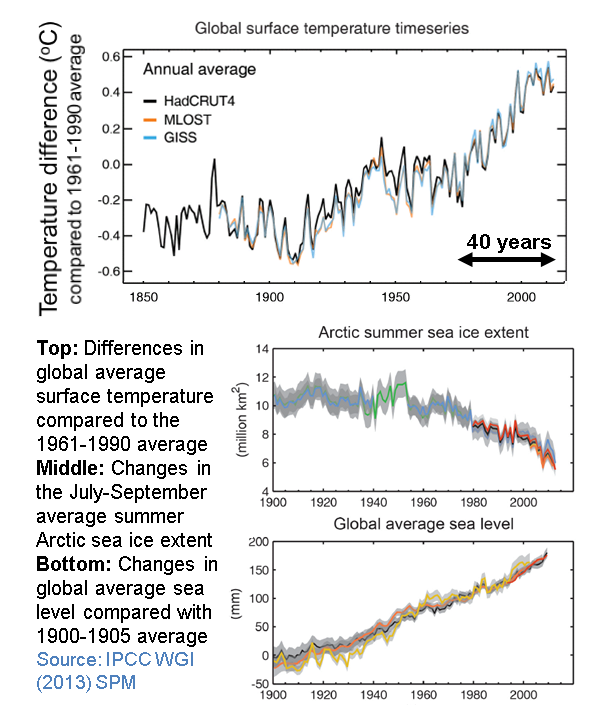
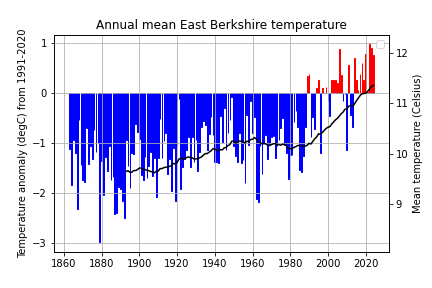
6) Some regions of the planet have warmed more than the global average. Reading and East Berkshire have warmed by nearly 1oC over this period. The Arctic has also warmed substantially and observations indicate around a 40% drop in September Arctic sea ice extent since 1973 - see graph above, middle panel - and ice volume has probably reduced by an even greater extent.
7) Warming oceans have expanded in volume causing sea levels to rise. Melting glaciers over recent decades have added water to the oceans also contributing to the observed increase in sea level over the last 40 years of about 8cm - see graph above, bottom panel.
Given that many of these changes are occurring far away and are averages of many observations it is difficult to notice these changes personally and trust must be placed with the thousands of scientists who have been involved in making and collecting measurements, applying quality controlling and carefully interpreting, evaluating and improving them over time (see for example the Met Office Hadley Centre observations page).
Even more oblique are the projections of future climate change that will arise from our continued emissions of greenhouse gases. As a scientist, presenting a graph showing rising temperature and changing rainfall patterns for the 2080s or 2040s (see IPCC 2013 working group I Summary for Policymakers Figures 7-9) is simple but conceptualising what it will mean to people living in these decades is difficult. What is certain is that when I (hopefully) celebrate my son's 40th birthday in 2045 the world will be a very different place and climate change will also be noticeable over large regions of the globe.
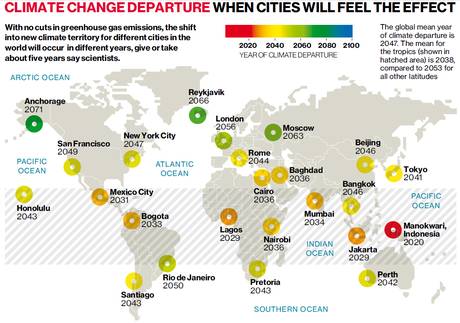
The emergence of climate change from natural year to year fluctuations is likely to affect tropical regions first (see recent research looking at the time of emergence of climate change from natural variability by Camilo Mora and Ed Hawkins for example). The diagram below from the Independent article discussing the Mora research shows what years selected cities are likely to really notice the effects of climate change. As I look forward to the next 40 years, what is certain is that weather and climate will continue to fascinate me, surprise me and, increasingly, concern me.
Richard P. Allan Location: Department of Meteorology (2U15)
