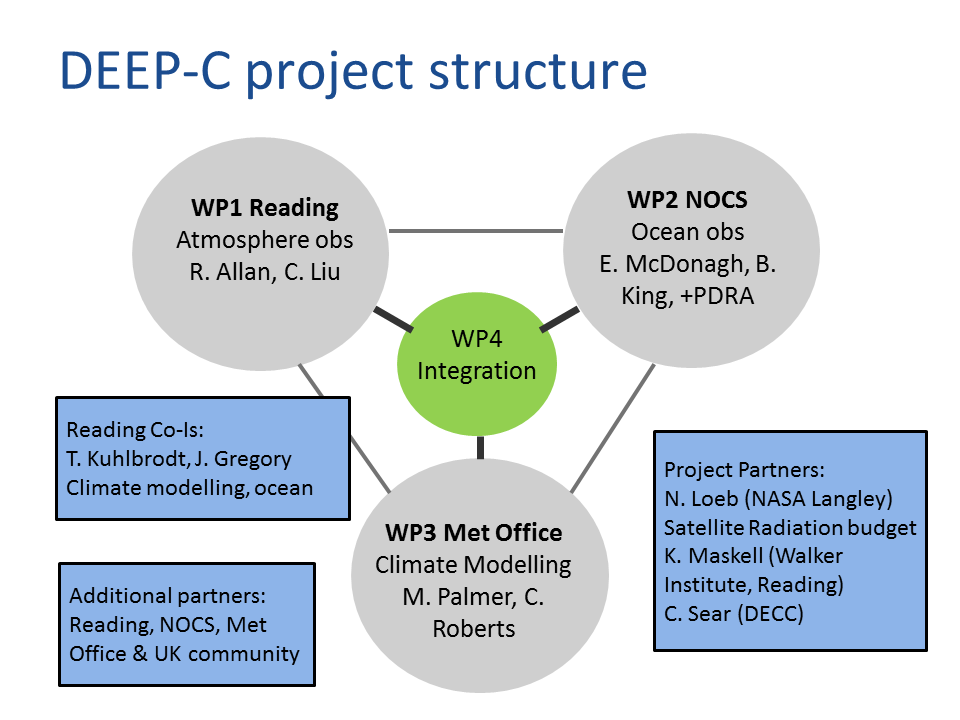
DEEP-C project
The Diagnosing Earth's Energy Pathways in the Climate system (DEEP-C) consortium is a 4-year project that is tackling the questions:
(1) What mechanisms explain the reduced global surface warming rate since around 2000
(2) Where is the excess energy due to rising greenhouse gas concentrations currently accumulating in the climate system?
We are using satellite observations, measurements below the sea surface (including the deep ocean) and detailed simulations of the atmosphere and ocean, combining expertise from the University of Reading, the National Oceanography Centre (NOC) Â Southampton and the Met Office.
The project is funded by the Natural Environment Research Council (NERC) and runs from March 2013 - April 2017, involving partnerships with the NASA Langley Research Center and the UK Department for Energy and Climate Change (DECC) and collaboration with the National Centre for Earth Observation, the National Centre for Atmospheric Sciences-Climate and the Walker Institute for Climate Systems Research.
A more detailed outline of the rationale and work plan for DEEP-C is provided in the Project Proposal. Here are some further project links:
[PROJECT DESCRIPTION| LINKS | JOURNAL PAPERS | LATEST NEWS]
Meetings
10th October 2016 - 8th DEEP-C meeting, Reading (Harry Pitt Seminar Room 10:30am-4pm)
18th March 2016 - 7th DEEP-C meeting, Met Office
6th November 2015 - 6th DEEP-C meeting, NOC-Southampton
9th June 2015 - 5th DEEP-C meeting, University of Reading
20th October 2014 - 4th DEEP-C meeting, Met Office
26th March 2014 - NOC-Southampton
27th September 2013 - Met Office
Monday 22nd April 2013 - Kick-Off meeting with project partners, Department of Meteorology, University of Reading (ESSC seminar room, 10:30am-4:30pm)
[PROJECT DESCRIPTION| LINKS | LATEST NEWS]
Team members
[PROJECT DESCRIPTION| LINKS | LATEST NEWS]
Partner Publications
Abraham et al. (inc. M.D. Palmer), A review of global ocean temperature observations: Implications for ocean heat content estimates and climate change, Rev. Geophys, 51, 450-483, doi:10.1002/rog.20022.
Allan, R. P. (2017), Global energy budget: Elusive origin of warming slowdown, Nature Climate Change, in press, doi: 10.1038/nclimate3282.
Allan, R. P., C. Liu, N. G. Loeb, M. D. Palmer, M. Roberts, D. Smith and P.-L. Vidale (2014) Changes in global net radiative imbalance 1985-2012, Geophysical Research Letters, 41, 10.1002/2014GL060962.
Allan, R. P., C. Liu, M. Zahn, D. A. Lavers, E. Koukouvagias and A. Bodas-Salcedo (2014) Physically consistent responses of the global atmospheric hydrological cycle in models and observations, Surv. Geophys., 35, 533-552, doi:10.1007/s10712-012-9213-z
Allan, R.P. (2011), Combining satellite data and models to estimate cloud radiative effect at the surface and in the atmosphere, Meteorological Applications, 18, p.324-333, doi:10.1002/met.285.
Cheng, L., K. E. Trenberth, M. D. Palmer, J. Zhu and J. P. Abraham (2016) Observed and simulated full-depth ocean heat-content changes for 1970-2005, Ocean Science, 12, p.925-935, doi:10.5194/os-12-925-2016
Desbruyères, D. G., S. Purkey, G. J. Johnson, E. L. McDonagh and B. A. King (2016), Deep and Abyssal Ocean Warming from 35 years of Repeat Hydrography, GRL, DOI: doi: 10.1002/2016GL070413
Desbruyères, D. G., E. L. McDonagh, B. A. King, F. K. Garry, A. T. Blaker, B. Moat and H. Mercier (2014) Full-depth temperature trends in the Northeastern Atlantic through the early 21st century, GRL: 10.1002/2014GL061844
Desbruyères, D. G., E. L. McDonagh, B. A. King, V. Thierry, (2017) Global and full-depth ocean temperature trends during the early twenty-first century from Argo and repeat hydrography doi:10.1175/JCLI-D-16-0396.1
Hyder and co-authors (2018) Critical Southern Ocean climate model biases traced to atmospheric model cloud errors, Nature Communications, 9, 3625, doi: 10.1038/s41467-018-05634-2. PDF | Supplementary
Kuhlbrodt, T., R.S. Smith, Z. Wang and J.M. Gregory (2012): The influence of eddy parameterizations on the transport of the Antarctic Circumpolar Current in coupled climate models. Ocean Modelling, 52-53, 1-8, doi:10.1016/j.ocemod.2012.04.006
McCarthy, G.D., B. A. King, P. Cipollini, E. L. McDonagh, J. R. Blundell, and A. Biastoch, On the sub-decadal variability of South Atlantic Antarctic Intermediate Water (2012) Geophys. Res. Lett., 39, L10605.
Otto, A. et al. inc. Gregory, J.M. (2013) Energy budget constraints on climate response, Nature Geosciences, doi:10.1038/ngeo1836
Palmer, M.D. (2012), Climate and Earth's Energy Flows, Surv in Geophysics, doi: 10.1007/s10712-011-9165-8.
Palmer, M.D. (2017) Reconciling Estimates of Ocean Heating and EarthÇs Radiation Budget, Current Climate Change Reports, doi: 10.1007/s40641-016-0053-7
Palmer, M.D. and D.J. McNeall (2014) Internal variability of Earth's energy budget simulated by CMIP5 climate models, Environ. Res. Lett. 9, 034016, doi:10.1088/1748-9326/9/3/034016
Palmer, M.D., D.J. McNeall and N.J. Dunstone (2011) Importance of the deep ocean for estimating decadal changes in Earth's radiation balance, Geophys. Res. Lett.. 38, L13707.
Palmer, M.D., C. D. Roberts, et al. (2015) Ocean heat content variability and change in an ensemble of ocean reanalyses, Climate Dynamics, doi: 10.1007/s00382-015-2801-0
,Roberts, C.D., M.D. Palmer, D. McNeall and M. Collins (2014) Quantifying the likelihood of a continued hiatus in global warming, Nature Climate Change doi:10.1038/nclimate2531
Roberts, M. J. and co-authors inc. Pat Hyder (2016) Impact of ocean resolution on coupled air-sea fluxes and large-scale climate, GRL, doi:10.1002/2016GL070559
Roberts, C., M. Palmer, R. P. Allan, D. Desbruyeres, P. Hyder, C. Liu, D. Smith (2017), Surface flux and ocean heat transport convergence contributions to seasonal and interannual variations of ocean heat content, J Geophys. Res.- Oceans, doi: 10.1002/2016JC012278. draft PDF
Liu, C. Allan, R. P., P. Berrisford , M. Mayer , P. Hyder, N. Loeb , D. Smith , P.-L. Vidale, J. Edwards (2015) Combining satellite observations and reanalysis energy transports to estimate global net surface energy fluxes 1985-2012, J. Geophysical Research, doi: 10.1002/2015JD023264
Loeb, N. G., J. M. Lyman, G. C. Johnson, R. P. Allan, D. R. Doelling, T. Wong, B. J. Soden and G. L. Stephens (2012), Observed changes in top-of-the-atmosphere radiation and upper-ocean heating consistent within uncertainty, Nature Geoscience, 5, 110-113, doi:10.1038/ngeo1375.
Loeb, N. G., H. Wang, A. Cheng, S. Kato, J. T. Fasullo, K.-M. Xu and R. P. Allan (2015) Observational Constraints on Atmospheric and Oceanic Cross-Equatorial Heat Transports: Revisiting the Precipitation Asymmetry Problem in Climate Models, Climate Dynamics, 10.1007/s00382-015-2766-z
Lyman, J.M. et al. inc. M.D. Palmer (2010) Robust Warming of the Global Upper Ocean, Nature, 465, 334-337.
Smith, D. (2013) Has global warming stalled? Nature Climate Change 3, 618-619 doi: 10.1038/nclimate1938
Smith, D., R. P. Allan, A. C. Coward, R. Eade, P. Hyder, C. Liu, N. G. Loeb, M. D. Palmer, M. Roberts, and A. A. Scaif (2015) Earth's energy imbalance since 1960 in observations and CMIP5 models, Geophysical Research Letters, 10.1002/2014GL062669,
.von Schuckmann, K. et al. inc. M. D. Palmer (2016) An imperative to monitor Earth's energy imbalance, Nature Climate Change doi: 10.1038/nclimate2876
[PROJECT DESCRIPTION| LINKS | LATEST NEWS]
DEEP-C NEWS
April 2017 - Elusive origin of warming slowdown Nature Climate Change News & Views
March 2017 - Final DEEP-C meeting in Exeter and publication of topical collection on Global Energy Budgets in Current Climate Change reports
March 2016 - Met Office DEEP-C partners publish perspectives in Nature Climate Change and the World Meterorological Organisation State of the Climate (p.22-23) on the imperative to monitor Earth's energy imbalance (see also Climate Lab Book blog).
September 2015 - Members of the DEEP-C team contributed to a CLIVAR meeting Energy Flow Through the Climate System at the UK Met Office.
August 2015 - New advances in estimating energy flows in the climate system and their links to biases in rainfall published by the DEEP-C project. A new method for estimating surface fluxes has been published in the Journal of Geophysical Research while an important new study lead by Norman Loeb published in Climate Dynamics demonstrates a link between biases in energy flows and biases in rainfall in climate models.
July 10th 2015 - Richard Allan commented on recent Science paper by Nieves et al on the BBC Radio 4 Today program
July 2015 - Project PIs attended the Our Common Future under Climate Change meeting (see Met Office blog and also poster detailing additional DEEP-C work
June 2015 - DEEP-C work presented at Imperial College Seminar and NCAS group meeting
March 2015 - An update on the hiatus in global warming at the Earth's surface- Current Weather and Climate Discussions, Department of Meteorology: PDF
February 2015 - Work by DEEP-C Met Office partners exploited thousands of years of climate model simulations to quantify there is a 1 in 6 chance of the current hiatus continuing for another 5 years but notes that surge in surface warming (particularly over the Pacific, Arctic, southern Africa and South America) is more probable. See Roberts et al. (2015) Nature Climate Change.
January 2015 - DEEP-C work suggests small drop in Earth's heating rate from 1999-2005 and indicates that peak in ocean heating rate in the early 2000s in some ocean datasets is likely to be spurious. See Smith et al. (2015) GRL.
October 2014 - Improved observations of ocean heating and sea level rise
September 2014 - Is global warming on holiday?
August 2014 - Article and comment on recent paper indicating the role of the Atlantic in determining the hiatus
August 2014 - Changes in global net radiative imbalance 1985-2012 published in Geophysical Research Letters. See also NCAS, and Nature Climate Change highlights and blogs from Carbon Brief and Climate Lab-book

July 2014 - Research on changes in Earth's energy budget was presented at AMS Atmospheric Radiation conference in Boston (as part of the Tony Slingo symposium) and at the GEWEX International Science conference in The Hague.
April 2014 - DEEP-C results were presented at the EGU meeting in Vienna.

April 2014 - DEEP-C results were presented and discussed at the Royal Society International Scientific Seminar on Causes of Recent Temperature Trends and Implications for Projections at the Kavli Royal Society International Centre, Chicheley Hall, UK, 2-3rd April 2014.
March 2014 - New DEEP-C publication in Environmental Research Letters demonstrating important role of internal ocean variability in decadal changes in Earthy's energy imbalance and global surface temperature trends (Palmer and McNeall, 2014; see also Guardian article).
February 2014 - "Where has the warming gone?" talk to the Royal Meteorological Sociaty South East Group by Richard Allan.
February 2014 - Comment on recent Nature Climate Change paper by England et al. which implicates strengthening Pacific trade winds in causing the global warming hiatus (see also Guardian article).
August 2013 - Comment on recent Nature paper by Kosaka and Xie demonstrating the role of natural variability in the Pacific ocean in explaining the recent slowdown in global surface warming (see also BBC and Independent articles).
July 2013 - Press briefing at the Science Media Centre on the recent slowdown in global surface warming (see briefing note). Read More...
May 2013 - First DEEP-C publication (Prof. Gregory) Energy budget constraints on climate response, Nature Geosceinces (see also Science Media Centre | Guardian)
May 2013: Article on DEEP-C and how scientists measure Earth's temperature by Roz Pidcock from Carbon Brief
April 2013 - Meeting with DECC partners in London to discuss project
April 2013 - Science Media Centre briefing
April 2013 - DEEP-C Kick-Off Meeting at the University of Reading
March 2013 - Comments on misleading article in Daily Mail
[PROJECT DESCRIPTION| LINKS | LATEST NEWS]
DEEP-C DATA
Top of atmosphere and surface energy fluxes produced as part of DEEP-C are available as text and NetCDF files at the following website. [DEEP-C Version 5 data | DEEP-C Version 4 data]Useful Links
Here is a growing list of links to journal papers, blogs and web links that are of relevance to the DEEP-C project which hopes to investigate in detail the flows of energy in the climate system and mechanisms influencing the recent hiatus in global mean surface warming.
[See Project Description above]
Web links
ARGO free-drifting ocean profiling floats
Clivar Carbon and Hydrographic Data Office (CCHDO)
Clouds and the Earth's Radiant Energy System (CERES)
European Centre for Medium-range Weather Forecasts (ECMWF) Interim Reanalysis (ERA Interim)
Reports
Met Office reports on the recent pause in global warming
IPCC 2013 Working Group I assessment of Climate Change
Discussion in Media/Blogs
Is the global warming "hiatus" over? by Kevin Trenberth @ConversationUK [August 2015]
Conversation article discussing role of Atlantic vs Pacific as drivers of hiatus [August 2014]
Highlight of energy balance paper [August 2014]
Dynamical retardation of tropical warming Blog by Isaac Held [April 2014]
Hiatus in context - Nature Geosciences Editorial [February 2014]
Pause for Thought - about communicating the surface warming slowdown by Hawkins et al [Nature Climate Change, 2014]
Attempt to explain the warming slow-down with Arctic data gaps is only a small step towards reconciling observed and expected warming (Judith Curry) [Nature Geosciences N&V 30 January 2014].
Case of the missing heat perspective by Jeff Tellefson [Nature 15 Jan 2014].
ClimateLabBook and here | skepticalscience.com/ | sciencemediacentre.org | Bad Astronomy | carbonbrief.org | Myles Allen | RealClimate
JOURNAL PAPERS : Energy imbalance/ocean heating | Modelling | Unforced Variability | Radiative Forcing | Circulation | Other relevant papers including Hemispheric Heat Flux Asymmetry | Feedbacks |
Energy imbalance
Minobe et al. (2025) npjClim. Atmos. Sci.: positive decadal trend in Earths Energy Imbalance and switch from long La Niña to El Niño explain exceptional warming up to 2023/2024
Lee et al. (2025) Nature Clim.: increase in the persistence of SST anomalies across the global ocean since 1982 due to reduced efficiency of heat uptake by deeper ocean layers
Hansen et al. (2025) Environment: SPSD: Aerosol cooling and climate sensitivity has been underestimated, the magnitude of predicted damage has not been communicated and the cost of carbon should be accounted for
Forster et al. (2024) ESSD: Indicators of Global Climate Change 2023 annual update
Goessling et al. (2024) Science: Record low Earth albedo due to declining low cloud added to El Niño effects in explaining record 2023 global temperatures
Li et al. (2024) Comm. Earth Env.: Acceleration in global surface heating from 0.22 Wm-2 1961 to 1994 to 0.8 Wm-2 1995 to 2022 based on combining CMIP6 simulations with surface radiation observations
Olonscheck & Rugenstein (2024) GRL: coupled models underestimate energy imbalance trend 2001-2022 with more realistic models having lower climate sensitivity
Johnson & Purkey (2024) GRL: 0.042±0.013 Wm-2 heating of deep (2000-4000m) and 0.025±0.004 Wm-2 abyssal (4000-6000m) ocean (0.068±0.016 -2 in total) based on Deep Argo and ship-based observations from 1980s-2010s
Tselioudis et al. (2024) Clim. Dyn.: expansion of the subtropical dry zone, poleward displacement of the midlatitude storm zone and narrowing of the tropical intertropical convergence zone (ITCZ) region 19842018 based on ISCCP cloud data with CERES shortwave cloud radiative warming trend of 0.12 W/m2/decade (2000-2016) due to low-latitudes that doubles to 0.24 W/m2/decade when extending up to 2022 but opposing changes seen in ISCCP due to more shortwave reflection at high latitudes.
Hakuba et al. (2024) Surv. Geophys.: Ocean heat uptake 2005-2019 varies between 0.40+-0.12 and 0.96+-0.08 Wm-2 rate of increase between -0.03+-0.13 (reanalysis product) and 1.1+-0.6 Wm-2/decade (satellite product).
Cheng et al. (2024) Rev Earth Env.: 0.37-1.6 W/m2 ocean heating 2022 to 2023, strongest in southern and Atlantic oceans with accelerating global heating rate of 0.14-0.18 W/m2/dec 19602023
Cheng et al. (2024): Upper 2000m ocean heated from 2022 to 2023 by 5-14 ZJ (0.3-0.9 Wm-2 with a rise in global SST of 0.23oC
Kuhlbrodt et al. (2024) BAMS: Unprecedented ocean warmth in the context of an elevated net global energy imbalance of +1.9 W/m2 (September 2022-August 2023) as part of a remarkably large upward trend with extreme North Atlantic SST and Southern Ocean sea-ice extent in 2023 similar to future projections at a global warming level of 3.0oC
Hansen et al. (2023) OOCC: global warming in the pipeline
Miniere et al. (2023) Sci. Rep.: accelerated heating of 0.1-0.2 W m-2/decade of oceans with 0.010-0.016 W m-2/decade increase for land/cryosphere/atmosphere since 1960
Montillet et al. (2023): Preface to JGR special issue on Monitoring the Earth Radiation Budget
Samset et al. (2023) Commun. Earth Environ.: Steady global surface warming of 0.18oC/decade from 1973 to 2022 but increased warming rate after 1990 with warming rate increase of 0.012oC/decade per decade
Shackleton et al. (2023) Nature Geosci.: Bethnic δ18O
proxy for Earth's Energy Budget over last 150,000 yearsForster et al. (2023) ESSD: Indicators of Global Climate Change 2022: annual update of large-scale indicators of the state of the climate system and human influence
Nitzbon et al. (2023) GRL: between 1980 and 2018, about 0.006 Wm-2 heated permafrost globally, of which 44% was used to melt ground ice
Von Shuckmann et al. (2023) ESSD: heat accumulating in the climate system reached record values at an increasing pace (0.48±0.1 1971-2020 increasing to 0.76±0.2 for 2006-2020), spread between the ocean (89%), land (6%), cryosphere (4%) and atmosphere (1%).
Stephens et al. (2022) Proc. Roy. Soc.: increased energy imbalance driven by decreases in reflected sunlight in clear and cloudy scenes whereas in models it is primarily cloudy with an overestimated darkening of the surface
Marti et al. (2022) ESSD: 0.52-0.96 Wm-2 heating 2002-2019 based on space altimetry/gravimetry
Cheng et al. (2022) Adv. Atmos. Sci.: ocean heating continues in 2021 despite La Nina
Goode et al. (2021) GRL: 0.5 Wm-2 global decrease in reflected sunlight 1998-2017 based on Earthshine measurements consistent with CERES satellite observations
Bagnell & DeVries (2021) Nature Comms: reconstruction of ocean heating suggests roughly balanced Earth energy budget (-0.16 to 0.06?Wm-2) in most of late 20th century but increase in past three decades to 0.5-0.76 Wm-2.
Loeb et al. (2021) GRL: Satellite and Ocean Data Reveal Marked Increase in Earths Heating Rate
Cuesta-Valero et al. (2021) Clim. Past: 0.13 Wm-2 continental heat flux 19932018 (0.04 Wm-2 as contribution to global mean)
Cuesta-Valero et al. (2021) ACPD: CMIP5 ensemble overestimates ocean heat uptake by 0.16 Wm-2 and underestimates the continental heat storage by 0.017 Wm-2 and the cryosphere heat content by 0.01 Wm-2 1972-2005
Von Schuckmann et al. (2020) ESDD: Earth's Energy Imbalance of 0.47+-0.1 Wm-2 (19712018), increasing to 0.87+-0.12 Wm-2 (20102018), is taken up by ocean (89%), land (6%), melting of ice (4%) melting of grounded and the atmosphere (1%). A decrease in CO2 concentration from 410ppm to 350ppm is estimated to be required to re-balance Earth's energy budget.
Vanderkelen et al. (2020) GRL: Total net heat uptake by inland waters is 3.6% of continental heat uptake over industrial period and 0.0008 Wm-2 1991-2020, similar to 0.0009 Wm-2 by reservoir expansion.
Resplanday et al. 2019 Sci. Rep.): independent indirect measure of ocean warming equivalent to heating of Earth by 0.3-1.3 Wm-2 for 1991-2016 based on atmospheric O2 and CO2 observations consistent with previous estimates but with large uncertainty after correction to method
Meyssignac et al. (2019) Frontiers Marine Sci.: review on measuring ocean heating to estimate Earth's energy imbalance [0.4-1.0 Wm-2 imbalance, 93% in the ocean]
Baggenstos et al. (2019) PNAS: Earth's energy imbalance since last glacial show positive imbalance of 0.2 Wm-2 with peaks of 0.4 Wm-2 coinciding with weakened AMOC
Zanna et al. (2019) PNAS: global ocean absorbed heat during 1955-2017 at a rate of 0.30±0.06 Wm-2 in the upper 2000 m and 0.028±0.026 Wm-2 below, with large decadal fluctuations and an increase in ocean heat content during 1921-1946 as large as 1990-2015 (0.36 Wm-2).
Resplandy et al. (2018) Nature RETRACTED (see Resplanday et al. 2019 Sci. Rep.): independent indirect measure of ocean warming equivalent to heating of Earth by 0.7-0.9 Wm-2 for 1991-2016 based on atmospheric O2 and CO2 observations consistent with previous estimates after correction to method
Dewitte & Clerbaux (2018) Rem. Sens.: large increases in OLR since 1980s based on different satellite records with rather high sensitivity estimated as ~3 W/m2/K with implied low climate sensitivity
Loeb et al. (2018) MDPI Climate: 0.83 Wm-2 reduction in reflected sunlight due to low cloud changes after end of slowdown period with additional clear-sky effects from reduced Chinese and N American aerosols that contributed to rapid global warming
Hu et al. (2018) Clim. Dyn.: increased evaporation and more clouds linked to slowing in surface warming (although ERA Interim fluxes may not be realistic)
Nerem et al. (2018) PNAS: sea level rise accelerating by 0.84 mm/yr per decade in agreement with climate models & energy budget estimatesreconstructions
Loeb et al. 2018: CERES EBAF v4.0 - global cloud radiative effect -18 Wm-2, uncertainty of 2.5 Wm-2 1x1 degree monthly all-sky, about double for clear-sky. Trend in net imbalance of +0.35 Wm-2 per decade mostly due to clear-sky SW. [see also Kato et al. (2018) J. Clim for EBAF surface v4.0]
Dieng et al. 2017 IJOC: Energy imbalance 20032013 0.5 W m-2 (in situ measurements), 0.68 W m-2 (ocean reanalysis) & 0.65 W m-2 (global sea level budget, all +/-0.1 W m-2).
Yi et al. (2017) GRL: Rate of sea level rise acelerated 0.27 mm/yr each year during 2005-2015 due to thermal expansion (44%), reduced land water storage (41%) and melting of land ice (15%)
Storto et al. (2017) GRL: assimilation of CERES data to constrain ocean heat content data (but large heating below 1500m looks suspicious?)
Hedemann et al. (2017) Nature Climate: Modest changes in upper ocean mixed layer heat budget due to ocean/atmosphere fluctuations can generate significant slowing in global surface warming and may elude observational detection (News & Views: Allan, 2017)
Cheng et al. (2017) Sci. Adv.: 200 billion kilowatt heating of Earth since 1960, mostly after 1980, affecting deeper ocean since 1990s, variation close to Allan et al. (2014) GRL
Palmer, M.D. (2017) Current Climate Change Reports: Improvements in satellite sensor calibration, estimates of total solar irradiance and more comprehensive sampling of the global oceans (e.g. Deep Argo) are key aspects to reducing uncertainties in future observations of Earth's energy imbalance.
Johnson and Birnbaum (2017) GRL: building El Nino temporarily increases ocean heat uptake (1oC warming in Nino3.4 over a year increases Earth's energy uptake by 0.2 Wm-2)
Johnson et al. (2016) Nature Climate Change: improved estimate of Earth's energy imbalance of +0.6 to +0.8 Wm-2 due to better ocean sampling
Trenberth et al. (2016) J. Clim: Earth's energy imbalance from multiple sources
Richardson et al. (2016) Nature Climate: reconciling observation-based/simulated transient climate sensitivity (TCR) through consistent sampling of surface temperature (TCR~1.7oC at 2xCO2)
von Schuckmann et al. (2016) Nature Climate Change: An imperative to monitor Earth's energy imbalance perspective
Cuesta-Valero et al. (2016): many CMIP5 models underestimate observed continental heat accumulation of 0.01 Wm-2 (for global area, 1950-2000) by nearly factor of 10.
Xie et al. (2015) Nature Geoscience: top-of-the-atmosphere radiation and global mean surface temperature less tightly coupled for natural decadal variability than for greenhouse-gas-induced response.
Loeb et al. (2015) Clim. Dyn.: Observed imbalance of 0.6 Wm-2 determined by southern hemisphere. Climate model biases in cross equatorial energy transports linked with precipitation biases.
Liu et al. (2015) JGR: New satellite-based estimates of global net surface energy fluxes 1985-2012
Johansson et al. (2015) Nature Clim.: the hiatus is primarily attributable to ENSO-related variability and reduced solar forcing. Including observations over the hiatus reduces most likely climate sensitivity only slightly and the lower bound of the 90% range remains around 2 °C.
Marotzke and Forster (2015) Nature: observed/simulated 15 year surface temperature trends since 1900 dominated by internal variability so claims that climate models systematically overestimate the response to radiative forcing are unfounded. [see also critique by Nic Lewis and response from Marotske and Forster]
Smith et al. (2015) GRL: Peak ocean heating rate in the early 2000s is likely spurious based on analysis of satellite data and CMIP5 simulations since 1960.
Allan et al. (2014) GRL:, increase in Earth's heating rate from 0.34 Wm-2 for earlier 1985-1999 period up to 0.62 Wm-2 for 2000-2012 despite slowing in rate of surface warming.
Trenberth et al. (2014) J. Climate: Energy imbalance of 0.5-1.0 Wm-2 in last decade from reanalyses/simulations/satellite data; discrepancies remain bertween satellite data and ocean opbservations (e.g. 2008-09).
Trenberth and Fasullo (2013) Earth Futures: importance in Pacific Decadal "Oscillation" in explaining slowing in surface warming trend since 2000
Otto et al. (2013) Nature Geosci.: Latest estimates of radiative forcing and ocean heating consistent with climate model equilibrium climate sensitivity; recent decade suggest minority of models may underestimate rapidity of climate response up to point of CO2 doubling.
Loeb et al. (2012) Nature Geosci.: Observations show Earth contunued heating (at 0.5 Wm-2) since 2000
Levitus et al. (2012) GRL: ocean heat content and thermosteric sea level change since 1955
Hansen et al. (2011) ACP: Observed heating of 0.6 Wm-2 2005-2010; discusses contribution of changes in rate of radiative forcing increase and errors in ocean heat uptake.
Church et al. (2011) GRL: increasing sea level and ocean heating consistent; aerosol forcing (as a residual term) may have increased in the late 1990s
Allan, R.P. (2011) Met. Apps.: Observed variations in 60S-60N mean net radiative fluxes since 1985; influence of volcanoes + ENSO but no evidence of decerease over the period
Lyman et al. (2010) Nature: observed ocean heating rate down to 700m 1993-2008
Trenberth (2009) COES: a nice discussion of the many factors linking Earth's energy imbalance, heating and sea level rise ["...melting ice is a factor of 40-70 times more effective than thermal expansion in raising sea level when heat is deposited in upper 700 m..."]
Schwartz 2007 JGR: effective heat capacity (14 Wm-2 per oC/yr) and depth of ocean heating (148m) based on 0-3000m ocean heat content data and global surface warming from 1956-2002
See also: Energy imbalance/ocean heating | Modelling | Unforced Variability | Radiative Forcing | Ocean heating | Other relevant papers
Modelling
Li et al. (2024) Comm. Earth Env.: AMOC weakening affects regional imbalance in mitigation scenario, while Southern Ocean becomes primary mode of energy exchange
Kawaguchi et al. (2024) GRL: new simple model for surface downward longwave accounting for cloud, temperature inversions and direct CO2 effects
Gregory et al. (2024) Clim. Dyn.: Simple model for ocean heat uptake
Steinert et al. (2024) GRL: CMIP6 models underestimate continental heat uptake due to too shallow land models that should be at least 170m to avoid inaccurate partitioning of radiative forcing
Olonscheck & Rugenstein (2024) GRL: climate models underestimate Earth energy imbalance trends 2001-2022 due to warming pattern effect as well as physics deficiencies with smaller bias models displaying lower climate sensitivity
Armour et al. (2024) PNAS: an unexpected observed pattern of surface temperature change since 1980s has reduced rate of global warming and its continued evolution will be an important factor in the magnitude of future climate change
Oh et al. (2024) Nature Clim.: slow release of deep ocean heat deptermines lingering pattern of warmth in multi-century mitigation scenario with southward shift in tropical rain belt
Bell et al. (2023) Phys. Ocean.: Use of DEEP-C in evaluating HadGEM3-GC3.1 coupled climate model
Schmidt et al. (2023) Frontiers Clim.: CERESMIP - model intercomparison with updated forcings from 2000 to at least end of 2021 to assess changes in Earth's energy balance.
Fajber et al. (2023) PNAS: gradients in evaporation determine poleward heat transport in idealised model simulations
Li et al. (2023) Earth & Space Sci.: CMIP6 models underestimate atmospheric net shortwave and longwave fluxes aand have more energy entering or less energy leaving the climate systems at TOA over the Northern Hemisphere land, Southern Hemisphere ocean and the polar regions compared to CERES EBAF, while the contrary applies in other regions;
Zhang et al. (2023) GRL: higher SST in CMIP6 than CMIP5 partly explained by stronger clear-sky downward longwave radiation from water vapour
Dong et al. (2022) Clim. Dyn.: recent decadal trends in surface solar radiation over Europe predominantly driven by anthropogenic aerosol emission reductions and their effect on atmospheric scattering, with an additional influence from SST/sea ice and greenhouse gas changes with a more equal contribution from all drivers to changes over the North Atlantic
Yang et al. (2022) Clim. Dyn.: two box model to show how negative feedback and greater ocean vertical mixing can generate a temporary pause in global warming
Labe & Barnes (2022) GRL: Warming slowdown events linked to ocean heat content patterns consistent with changing phase in inter-decadal Pacific variability based on machine learning applied to a large CESM ensemble
Dittus et al. (2021) Earth's Future: anthropogenic aerosols linked to north Pacific cooling through Rosby wave response though models may not represent the magnitude of the effect
Schedderboom & McDonald (2021) JGR: improved representation of Southern Ocean stratocumulus in CMIP6 but compensating errors remain
Misios et al. (2021) ERL: Similar patterns of tropical precipitation and circulation changes under solar and greenhouse gas forcingRaghuraman et al. (2021) Nature Comms: observed increase in Earth's heating since 2000 explained by human influence on forcing and feedback processes that particularly affect reflection of sunlight
Mayer et al. (2021) J. Clim: ERA5 energy and moiture transports improved over ERA-Interim
Wei et al. (2021) Sci. China Earth Sci.: CMIP6 models show smaller acceleration of global warming in early 21st century than CMIP5 but do not capture observed slower rate of warming
Sinha et al. (2020) J. Clim: persistence of hiatus and surge events linked to ocean heat uptake
Wild (2020) Clim. Dyn.: energy balance in CMIP6 - uncertainty of ~10-20 Wm-2 globally remains in components (particularly for latent heat flux) but improvement in clear-sky SW and reduced bias in surface downward SW and LW
Sinha et al. (2020) J. Clim.: an artifical hiatus is introduced into a model experiment with heat trapped just above the thermocline that following termination warms the column above and a sustained period of elevated SST
Olonscheck et al. (2020) GRL: internal variability broadly consistent with observed regional SST trends
Gastineau et al. (2019) Clim. Dyn.: modelling confirms increased heat uptake by Pacific with enhanced heat transport into the Indian Ocean when observed 1998-2012 wind stress is prescribed
Ceppi & Gregory (2019) Clim. Dyn.: new energy balance framework links climate sensitivity with surface temperature as well as SST-pattern related atmospheric stability
McGregor et al. (2018) Nature Clim.: Model bias in Atlantic SST explain smaller than observed Pacific trade wind response to Atlantic warming
Proistosescu et al. (2018) GRL: Feedbacks to CO2 forcing distinct from interannual variability where wind-driven air-sea fluxes independent of temperature are a critical
Deser et al. (2017) GRL: internal variability also key in determining hiatus in boreal winter warmimg
Yao et al. (2017) Nature Climate: rates of global surface warming not exclusively linked to east Pacific SST
Wang et al. (2017) J. Clim: global surface temperature weakly linked to decadal internal variability - closer links with tropospheric mean temperatures
Känel et al. (2017) GRL: some hiatus decades linked to warming in East Pacific and reduced ocean heat uptake implying distinct feedbacks
Burgman et al. (2017) GRL: shortwave low cloud feedbacks in E. Pacific explain much of SST/circulation variability of last 16 years
Medhaug and Drange (2016) Clim. Dyn.: Decadal-scale upper 700m ocean heat anomalies, of ~7.5 × 10²¹ J comparable to the ocean heat uptake needed to maintain 10 years without global warming in simulated future climate change scenarios.
Kosaka and Xie (2016) Nature Geosci.: model simulations of global warming "staircase" used to remove internal variability from observational record
Sevellec et al. (2016) GRL: hiatus of the early 21st Century was extremely unlikely
Mann et al. (2016) GRL: internal variability of N. Pacific played critical role in the slowdown but was not predictable; minor contribution from N. Atlantic exhibits some predictability
Outten et al. (2015) JGR and Thorne et al. (2015) JGR: 30 member ESM ensemble shows radiative forcing unable to explain temporary slowdown in surface warming
Medhaug & Drange (2015) Clim. Dyn: non-warming periods may last 10, 15 and 30 years for RCP8.5, RCP6.0 and RCP4.5, respectively and are possible through increased heat uptake and storage in particular in the tropical E. Pacific
Lovejoy (2015) Geophys. Res. Lett.: Simplistic model claims to have better skill at decadal forecasting of temperature changes than CMIP3 simulations but model appears to be calibrated on observations fitted to CO2 only forcing and may be useless.
Thorne et al. (2015) JGR: large ensemble of NorESM simulations not inconsistent with recent slowdown in surface warming with unforced variability appearing to play a leading role.
Roberts et al. (2015) Nature Climate Change: exploited unforced variability from CMIP5 simulations to quantify there is a 1 in 6 chance of the current surface warming hiatus continuing for another 5 years but find that a surge in surface warming (particularly over the Pacific, Arctic, southern Africa and South America) is more probable.
England et al. (2015) Nature Clim. Ch.: no difference in long term projections between models ensemble members displaying hiatus in recent period and others.
Douville et al. (2015) GRL: over-ride model surface wind stress to show possible influence of trade winds and extratropical Pacific SST in contributing to Pacific-wide multi-decadal SST variability although model climate sensitivity may be too high.
Watanabe et al. (2014) Nature Climate Change: prescribe observed tropical wind stress to isolate influence of internal variability on temperature trends (estimated contribution of about +0.1oC in 1980s-1990s and -0.1oC in 2000s)
Meehl et al. (2014) Nature Climate Change: 21 of 262 CMIP5 simulations generates hiatus (1 lasting 18yrs) with associated IPO pattern. Decadal forecast of early 2000s IPO and hiatus could have been skillfull.
Maher et al. (2014) GRL: hiatuses linked to volcanic eruptions, anthropogenic aerosol and internal variability but expected to become rare after mid 21st century
Risbey et al. (2014) Nature Climate Change: past 15-year trends in surface temperature are captured by simulations when ensemble members displaying realistic phases of ENSO during each period compared to observations are selected
Brown et al. (2014) GRL: top of atmosphere radiation amplifies decadal unforced variability through changes in albedo
Palmer and McNeall (2014) ERL: CMIP5 pre-industrial control simulations demonstrate important role of internal variability in decadal trends in global surface temperature and Earth's energy imbalance
Meehl and Teng (2014) GRL: CMIP5 decadal prediction experiments give closer agreement with observed surface temperature trends around mid-1970s and 2000s
Kosaka and Xie (2013) Nature: Recent hiatus explained by natural variability in the Pacific ocean. Read More...
Fyfe et al. (2013) Nature Climate Change: Commentary on why models "overestimate" global warming over the past 20 years.
Meehl et al. (2013) J Climate: Role of Interdecadal Pacific Oscillation (IPO) in determining accelerated warming and hiatus decades (extension of Meehl et al. 2011). No surface warming for 15 years is common in grerenhouse gas forced simulations.
Watanabe et al. (2013) GRL: increased observed ocean heat uptake explains slower surface temperature rise compared to CMIP5 simulations
Meehl et al. (2011) Nature Climate Change: Hiatus decades identified in simulations with increasing greenhouse gas forcing and are characterized by increased ocean heating below 300m.
Katsman and van Oldenborgh (2011) GRL: simulations suggest a mix of natural variability and increased ocean heating at depth contribute to hiatus periods in the surface temperature record
Palmer et al. (2011) GRL: full depth of ocean required to reconcile top of atmosphere radiative imbalance with heating of the climate system
Easterling and Wehner (2009) GRL: models simulate hiatus periods under increasing greenhouse gas forcing.
See also: Energy imbalance/ocean heating | Modelling | Unforced Variability | Radiative Forcing | Ocean heating | Other relevant papers
Unforced Variability
Minobe et al. (2025) preprint: Global and Regional Drivers for Exceptional Climate Extremes in 2023-2024: Beyond the New Normal L'Heaureux et al. (2024) J. Clim: relative ENSO index (following van Oldenborgh ety al. 2021) Davis et al. (2024) GRL: internal variability feedbacks better predict forced feedbacks in CMIP6 relative to CMIP5 but emergent constraints provided by observed internal variability remain weak Raghuraman et al. (2024) ACP Lett.: 2023 global warming spike was driven by the El NiñoSouthern Oscillation and long La Nina (like 1976/77)
Min et al. (2024) Comm. Earth Environ.: observation-model comparison of global hot areas in 2023 supports a key role for human-induced climate change, with a small contribution from El Niño
Rantanen & Laaksonen (2024) npj Clim Atmos Sci: internal climate variability plus increase in greenhouse gas forcing unable to explain rapid warming in 2023 based on climate models
Falster et al. (2023) Nature: Strengthening of Pacific Walker Circulation 19922011 unusual but not unprecedented in the context of the past 800 years based on annually resolved, multi-method, palaeoproxy
Wang et al. (2023) Nature Clim.: increase in multi-year La Nina events linked to west Pacific warming with a prominant onset and more commonly follow super-El Nino and central Pacific El Nino
Meyssignac et al. (2023) Nature Comm. Earth Env.: Variation in how sensitive climate is to CO2 increases varies over time due to natural fluctuations in Pacific that have caused a warming pattern unlike those simulated by models
Gao et al. (2022) Tellus: internal variability contributed to hiatus with heat redistribution in the horizontal and vertical
Wei et al. (2022) J.Clim: probability of warming slowdown higher and possibly unprecedented in early 21st century based on systematic assessment
Fueglistaler and Silvers (2021) GRL: shortwave cloud radiative pattern effect leqads to increasing negative effect in 1980s-1990s that remained stable in the hiatus period basedon AMIP simulations
Meehl et al. (2021) Nature Geosci.: weak opposite-sign SST response in the tropical Pacific when observed SSTs are specified in the Atlantic, weak same-sign SST response in the tropical Atlantic when observed SSTs are specified in the tropical Pacific.
Stolpe et al. (2020) Pacific variability reconciles observed and modelled global mean temperature increase since 1950
Wills et al. (2019 GRL: mechanisms for decadal persistence of PDO related to strengthening and expansion of the North Pacific subpolar gyre which takes several years to respond to wind stress forcing through baroclinic ocean Rossby wave adjustment
Wills et al. (2018) GRL: identify uncorrelated components of Pacific sea surface temperature variability due to global warming, DO and ENSO
Wei et al. (2019) Clim. Dyn.: statistical quantification of internal variability to recent decadal temperature trends
Cheng et al. (2019) J. Clim: Changes in atmospheric and ocean circulation (i.e., Indonesian Throughflow cause the tropical Atlantic and Indian Oceans to warm during El Niño, partly offsetting the tropical Pacific cooling for the tropical oceans as a whole.
Chung et al. (2019) Nature Clim.: dominant role of internal variability on the recent strengthening of the Pacific Walker circulation
Cha et al. (2018) GRL: switch toward El Nino state after 2011 including reversal of trade wind accelleration over 1993-2010 period
Hua et al. (2018) GRL: Pacific decadal variation dominated by internal variability 19202016 but greenhouse gases and aerosol increasingly contribute since 1990s
Folland et al. (2018) Sci. Adv.
: statistical analysis of warming/slowdown periods confirms role of natural forcings and inetrnal variability with only major inconsistency during 1944/45 2nd world war warm periodCassou et al. (2018) BAMS: Review on Decadal Climate Variability & Predictability
Yin et al. (2018) GRL: record 0.24oC rise in global temperature 2014-2016 due to ocean heat release from northwestern tropical Pacific
Iles et al. (2017) ERL: NAO trends quartered NH winter warming in 1989-2013 period, contributing to slowdown in global surface warming
Hu and Fedorov (2017) GRL: simple reconstruction of global mean surface temperature indicates ENSO dominates recent slowdown
Oka & Watanabe (2017) GRL: Ekman transport from tropics to subtropics enhanced after 2002 increasing heat storage below 700m explaining post-2002 global warming slowdown.
Xie & Kosaka (2017) CCCR: recognition of the importance of internal variability involving the Pacific ocean for GMST trends over a decadal scale
Dong & McPhaden (2017) ERL: radiative forcing dominates decadal temperature trends apart from during extreme phases of internal variability
Zhou et al. (2016) Nature Geoscience: clouds amplify cooling of E Pacific contributing to slower global warming rates
Bellamo et al. (2016) GRL: cloud feedback amplifyies Atlantic Multidecadal Oscillation by 10-31%
He and Soden (2016) J. Clim: lack of air-sea coupling in AMIP simulations affects realism of internal variability but is less problematic for longer term climate change
Brown et al. (2016) GRL: basin-scale Atlantic Multidecadal Oscillation linked to cloud feedback
Kucharski et al. (2016) Clim. Dyn.: Atlantic forcing of Pacific decadal variability especially between 1930s/40s vs 1910s/20s; 1970s/80s vs 1930s/40s; 1994-2013 vs 1970s/80s.
Li et al. (2015) Nature Climate Change:Atlantic control on Pacific ocean responses through wind-evaporation-sea surface temperature feedbacks but role of radiative forcing or Atlantic internally generated variability in driving this seems unclear
Brown et al. (2016) J. Clim.Reconcile contrasting local and global surface temperature/energy budget relationships through remote influence of anomalously warm conditions in causing low surface albedo near sea ice margins/high latitudes, low cloud albedo over mid/low-latitudes and a super clear-sky greenhouse effect over the deep Indo-Pacific
Radel et al. (2016) Nature Geosci. Cloud longwave effect amplifies El Nino through influence on atmospheric circulation
Guan et al. (2015) Sci. Rep.: combination of modes of internal variability (NAO, PDO, AMO) caused the warming-trend slowdown
Schurer et al. (2015) GRL: Probability of hiatus or rapid warming in observations consistent with previous model studies (e.g. Roberts et al. 2015) with similar spatial pattern relating to Interdecadal Pacific and Atlantic Variability. Combination of unforced variability and timing of volcanic eruptions also important.
Chikamoto et al. (2015) Nature Comms.: synchronization of ocean anomalies in Pacific, Atlantic and Indian oceans all basins, via global reorganizations of the atmospheric Walker Circulation, allow prediction of ENSO characteristics up to 3 years ahead.
Dai et al. (2015) Nature Clim. Ch.: Pacific Decadal Oscillation (PDO)-like variability combined with another internal mode of climate variability with a strong signal in the Northern Hemisphere with strong links to Atlantic Multidecadal Oscillation (AMO) and West Pacific Oscillation, account for about one quarter of de-trended annual mean surface temperature variance but essentially all of the decadal variations.
Kamae et al. (2015) GRL: Slower upper tropospheric warming 1997-2011 relate to tropical Pacific cooling which is probably unforced
Steinman et al. (2015) Science: statistical analysis finds Pacific Multidecadal Oscillation is dominating recent slow surface warming with little influence from Atlantic Multidecadal Oscillation
Brown et al. (2015) JGR: strong link between east Pacific and sub-decadal global mean temperature (GMT) variability. Two clusters display link with inter-decadal variability: E. Pacific and S. Ocean; models underestimate interdecadal variability and this is especially pronounced where the E. Pacific link dominates. There is some evidence of positive heat flux feedbacks to inter-decadal variability in the E. Pacific and also for high latitudes involving sea ice.
Yao et al. (2015) Theoret. Appl. Clim.: Hiatus caused by compensation between decadal variability (quasi-60-year oscillation) and secular warming trends which may persist for several more years
Thompson et al. (2014) Nature Geoscience: Pacific westerly wind reconstruction shows weaker trade winds coincide with a global warming effect.
Chen and Tung (2014) Science: 30 year oscillation involving AMOC key in explaining hiatus
McGregor et al. (2014) Nature Climate Change: recent strengthening of Walker circulation and pacific heat uptake linked to warming in Atlantic since early 1990s.
Lovejoy (2014) GRL: recent "pause" in global surface warming has a return period of 20-50 years so it is not unusual in the context of century scale climate change
Boisséson et al. (2014) GRL: strengthening of Pacific trades in last 20 years reproduced by simulations with prescribed sea surface temperatures
Ding et al. (2014) Nature: Unusual ocean conditions in Pacific explain 50% of recent rapid Arctic warming
Lu et al. (2014) GRL: On the possible interaction between internal climate variability and forced climate change
England et al. (2014) Nature Climate: Unprecedented strengthing of Pacific trades has enhanced subsurface ocean heat uptake by shallow overturning cells.
Chylek et al. (2014) GRL: multi-linear regression implies importance of Atlantic Multi-decadal Oscillation on decadal temperature trends (1/3 of post 1975 warming relates to positive AMO phase).
L'Heureux et al. (2013) Nature Climate Change - trends towards a stronger, La Nina-like Walker circulation?
Balmaseda et al. (2013) GRL: increased ocean heating below 700m due to surface wind forcing may have contributed to surface warming hiatus since 2004.
Guemas et al. (2013) Nature Climate Change: initialisation of models helps to explain hiatus due to changes in upper ocean heating linked to natural variability (see also comment by DEEP-C Met Office partner, Doug Smith)
Sohn et al. (2013) Climate Dynamics: recent observed variations in the Walker circulation inconsistent with climate models
Luo et al. (2012) PNAS: strengthening Pacific trade winds in last 2 decades linked with Indian ocean warming
Chikamoto et al. (2012) GRL: rather than cycles, step-wise shifts are an important manifestation of natural unforced climate variability
Foster and Rahmstorf (2011) ERL: warming trend evident in recent period when ENSO is accounted for
Merrifield (2011) J Climate: an observed shift in Pacific ocean circulation during the 1990s
Knight et al. (2009) BAMS state of the climate: Do global temperature trends over the last Decade falsify climate prediction?
See also: Energy imbalance/ocean heating | Modelling | Unforced Variability | Radiative Forcing | Ocean heating | Other relevant papers
Radiative Forcing
Zoëga et al. (2025) Nature Comm.: Icelandic volcanic eruption 2014/15 led to Arctic warming or around 1oC through longwave radiative heating from longer lasting low and mid level clouds
Virtanen et al. (2025) Nature GEosci.: higher susceptibility of cloud droplet number to cloud condensation nuclei numbe for low-level stratiform clouds than based on high latitude observations that imply -1.16 W m-2 aerosol indirect radiative forcing
Samset et al. (2025) preprint: Chinas aerosol cleanup has contributed strongly to the recent acceleration in global warming
Chim et al. (2025) Comm. Earth Env.: including volcanic eruptions rather than constant forcing in future projections adds variability comparable to internal and reduces probability of exceeding 1.5oC threshhold by 5% in low emissions scenario
Gupta et al. (2025) Commun Earth Environ: Hunga Tonga cooled the Southern Hemisphere by about -0.1 K by the end of 2022 and 2023 which dominated the global response.
Eytan et al. (2025) AGU Adv.: The Net Radiative Effect of the Ill-Defined Clear-Sky in the Vicinity of Clouds
Haywood et al. (2025) Frontiers Clim.: research gaps associated with Stratospheric Aerosol Injection and Marine Cloud Brightening and other Solar Radiation Modification geoengineering techniques
Chiang & Broccoli (2024) PLOS Clim.: seasonal cycle due to eliptical orbit shuld not be ignored and is significant in tropics
Song et al. (2025) NSR: greenhouse gas warming reduces surface solar radiation through absorption of sunlight by more water vapour, which continues in future high greenhouse gas emission scenarios
Liu et al. (2025) Nature: declining low altitude cloud reduces downward longwave radiation over Southern Great Plains (but the shortwave effect would presumably dominate and is there masking going on here as more water vapour will reduce the cloud radiative effect on surface lonwgave radiation...?)
Francis et al. (2024) Atmos. Res.: June 2023 was dustless in eastern tropical Atlantic, contributing to high sea surface temperatures
Quaglia & Visioni (2024) ESD: Reduced sulpher emissions due to shiping fuel regulations in January 2020 contributed 0.07-0.21 Wm-2 to radiative forcinng and 0.05-0.11 K global average warming in 2023 based on climate model simulations
Hermant et al. (2024) ACP: declining global aerosol emissions in recent decades have reduced their cloud indirect cooling effects yet direct reflection of sunlight has continuied to increase due to regional characteristics related to cloud and aerosol lifetime based on climate model simulations
Li et al. (2024) ACP: largest decreases in reflected shortwave radiation since 2001 in mid-spring and dominated by clear-sky aerosol and cloud components over 30-50oN and cloud components only in the southern hemisphere
Stocker et al. (2024) Comm. Earth Env.: strong persistent radiative cooling up to 4K in tropical mid stratosphere 2022-23 due to injected water vapour
Schoeberl et al. (2024) JGR: aerosol cooling dominates over water vapour heating from the Hunga Tonga-Hunga Ha'apai underwater eruption
Jordan & Henry (2024) Earth's Future: global effective radiative forcing 0.14 Wm-2 due to 2020 ship fuel aerosol emission regulations that reduced cloud brightness with predicted global surface warming 0.036-0.056oC 20202029 based on UKESM1 climate model simulations
Western et al. (2024) Nature Clim.: radiative forcing from hydrochlorofluorocarbons decreased by 0.06 Wm-2 2021-2023, faster than projections.
Gong et al. (2024) Nature: reactive Nitrogen causes net negative direct radiative forcing of -0.34 W m-2 in 2019 relative 1850 due to increased aerosol loading, reduced methane lifetime and increased terrestrial carbon sequestration
Yuan et al. (2024) Nature Comm. Earth Env.: ship fuel regulation leads to 0.1-0.3 Wm-2 radiative forcing over global ocean and contributes warming larger than rate since 1980 without this effect
Hodnebrog et al. (2024) Comm. Earth Env.: effective radiative forcing due to anthropogenic aerosol emission reductions drives 0.1 to 0.3 W m-2/decade strengthening of Earth's 20012019 net energy imbalance, though underestimates observed trend of 0.3 to 0.6 W m-2/decade
Yuan et al. (2024) Sci. Adv.: strong forcing from cloud fraction adjustment to aerosol increases but little change in cloud liquid water path based on observations leading to aersol indirect effect of -0.3 to -1.9 Wm-2
Fang et al. (2023) GRL: clustered small-to-moderate eruptions produced 0.07 K global cooling 18121820 that combined with large eruptions in 1809 (unidentified location) and 1815 (Tambora)
Raghuraman et al. (2023) GRL: decreases in outgoing longwave radiation in CO2, CH4, and N2O absorption bands due to radiative forcing and stratospheric cooling adjustment and increases in the window band and H2O absorption bands 2003-2021 relating to temperature response and feedbacks.
Dagan et al,. (2023) Nature Geosci.: Radiative forcing from aerosolcloud interactions enhanced by large-scale circulation adjustments based on cloud resolvig simulations with a SST gradient
Zhou et al. (2023) GRL: post Pinatubo-like eruption increases stratospheric water vapour by about 10% after 2 years when descending aerosol heats tropopause, with the effect 80% larger during La Nina
Fernandez et al. (2023) Atmos.: decreased reflected solar by 1.2-2.6% 2004-2022 in Meteosat due to decreased cloud while increased outgoing longwave 0.4-1.0% due to warming and 3.9% drop in CO2 absorption band
Schoeberl et al. (2023) GRL: Hunga Tonga would cool the 2022 Southern Hemisphere's average surface temperatures by less than 0.037oC as aerosol effect larger than water vapour effect (but seem to suggest infrared heating of upper troposphere does not affect surface?)
Jenkins et al. (2023) Nature Clim.: Instantaneous radiative forcing of 0.08 to 0.16 W/m2 directly following Hunga Tonga eruption with a peak global temperature response of +0.035oC
Millan et al. (2022) GRL: 0.16 W/m2 effective radiative forcing from Hunga Tonga eruption
Diamond et al. (2023) ACP: instantaneous radiative forcing due to aerosolcloud interactions from the ship fuel 2020 regulations estimated as about 1 Wm-2) within the shipping corridor, contributing to previous global estimates of about 0.1 Wm-2). (see alsoCarbon Brief analysis)
Yu et al. (2023) GRL: Volcanic and wildfire events between 2014 and 2022 injected ~3.2 Tg of sulfur dioxide and 0.8 Tg of smoke aerosols into the stratosphere which stay in stratosphere longer and contribute to effective radiative forcing of -0.18 W m-2, greater in magnitude than previous estimates and driving GMST decrease of 0.06 K
Chim et al. (2023) GRL: Climate Projections Underestimate Future Volcanic Forcing and Its Climatic Effects
Grosvenor & Carlslaw (2023): reflected sunlight over N Atlantic increased 18501970 due to aerosol induced increase in cloud droplet number concentration, while negative trend 19702014 mainly driven by decreased cloud fraction linked to greenhouse gas-induced warming
Allen et al. (2023) Nature Geosci.: Surface warming due to methane greenhouse effect offset by shortwave radiatiative absorption that increases low altitude cloud and decreases high cloud through a rapid atmospheric adjustment
Quaglia et al. (2023) ACP: climate models simulate faster reduction from peak aerosol in the tropical stratosphere after Pinatubo with generally stronger transport towards the northern extratropics at the expense of the observed tropical confinement
Arola et al. (2022) Nature Comm.: natural cloud heterogeneity and satellite retrieval errors leads to an underestimate of the aerosol-cloud-climate cooling
Julsrud et al. (2022) JGR: surface solar radiation changes dominated by aerosol over Europe, China, Japan & USA during 1961-2014 with cloud cover effects reducing changes and climate models unable to capture the changes over China/Japan/USA
Manshausen et al. (2022) Nature: strong liquid water path response to aerosol detected in invisible ship tracks leading to a larger aerosol cooling effect on the climate than previously estimated
Lee et al. (2022) Atmos. Env.: contrail cirrus may be a more important heating effect than the CO2 emissions from aviation
Quaas et al. (2022) ACP: weakening aerosol cooling effect since 2000 has contributed to warming of climate
Williams et al. (2022) Nature Clim.: Strong control of effective radiative forcing by the spatial pattern of absorbing aerosol
Chen et al. (2022) Nature Geosci: aerosols from the Huluhraun eruption increased cloud cover by approximately 10% which changed radiative forcing rather than cloud brightening as previously thought
Hassan et al. (2022) Comm. Earth Environ.: Reduced aerosols, ozone and precursor gases weaken Atlantic meridional overturning circulation by 10% at end of century through radiative forcing effects
Zhang et al. (2021) ACPD: "pot hole cooling" bias in CMIP6 models large over N America and N Eurasia due to unrealistic aerosol burden in Earth System Models (e.g. UKESM, EC-Earth, BCC-ESM, NorESM...)
Whitburn et al. (2021) npj Clim. Atmos. Sci.: 10 years of spectrally resolved OLR from IASI shows decreasiong trends of up to -3% per decade in CO2 and CH4 bands with internal climate variability dominating regional changes
Kramer et al. (2021) GRL: instantaneous radiative forcing has increased 0.42-0.64 Wm-2 from 2003 to 2018
Subba et al. (2020) ASL: aerosol radiative forcing decreasing in magnitude 2000-2017 (0.17 Wm-2/decade TOA and 0.33 Wm-2/decade SFC) with rapid change over the land compared to the global ocean
Subba et al. (2020) ASL: Decreasing direct aerosol radiative effect of 0.17 Wm-2/decade (top of atmosphere) and 0.33 Wm-2/decade at the surface based on satellite data for 2001-2017 that is concentrated over South Asia and the Africa/Middle East region with declines eslewhere.
Andrews & Forster (2020) Nature Clim.: better constrained effective radiative forcing range of 1.7-3.0 Wm-2 from 18611880 to near-present using observations of global mean surface temperature change and Earths total heat uptake and estimates of the Earths radiative response
Samset et al. (2019) Nature Geosci.: Emerging Asian aerosol patterns
Soden et al. (2018) Science: radiative forcing across models disagreement is due to inconsistent implimentation of radiative transfer which can be corrected based on comparison with line-by-line calculations and reduce a proportion of spread in climate climate response across models
Schmidt et al. (2018) JGR: 2005-2015volcanic ERF -0.08 W m-2 relative to quiescent 1999-2002 period
Oudar et al. (2018) GRL: little impact of anthropogenic aerosols on global temperature trends after the late 1990's in large initial condition ensemble
Checa-Garcia et al. (2018) GRL total ozone RF grows rapidly until 1970s, slows toward 2000s, renewed growth thereafter. CMIP6 total ozone RF 0.28 ± 0.17 Wm-2 (1850s to 2000s) 80% higher than CMIP5 estimation.
Monerie et al. (2017) ERL: Volcanic forcing explains slow 0.08oC/decade surface warming trend 2003-2012, cooling 0.04o/decade during 2008-2012 and more noticible in northern hemisphere but not affecting continued increases in global heat content.
Dewitte & Nevens (2016) ERL: new total solar irradiance estimate, 1363 Wm-2 at solar minimum
Checa-Garcia et al. (2016) ERL: CFC decline + less growth in methane & low-level ozone pollution contributed to slower surface warming
Takahashi and Watanabe (2016) Nature Climate: Aerosol forcing, mainly volcanic, contributed one third of unprecedented strengthening of Pacific trade winds during 1991-2010
Smith et al. (2016) Nature Climate: Aerosol forcing may indirectly explain slowdown in surface warming through influence on ocean circulation
Gettelman et al. (2015) Clim. Dyn.: Aerosol-cloud interactions forcings may have contributed to the spatial patterns of recent temperature change, but not to the global mean slowing of surface warming for the period 2000-2010.
Santer et al. (2015) GRL: multi-variable volcanic signal detection indicates volcanic forcing contributes in addition to unforced variability in explaining hiatus. Volcanic signals may have aliased onto the observed tropical SST.
Ridley et al. (2014) GRL: satellite measurements underestimate contribution of volcanic aerosol between tropospause and 15km at mid to high latitudes and therefore radiative forcing effect. Since 2000 an estimated cooling effect from volcanic aerosol is estimated to be -0.19 Wm-2 approximating to a cooling of 0.05 to 0.12o.
Hegglin et al. (2014) Nature Geosci.: model nudging technique improves record of stratospheric water vapour, suggesting previous estimates of surface cooling due to stratospheric water vapour decreases in 2001 (e.g. Solomon et al. 2010) are overestimated.
Huber and Knutti (2014) Nature Geosci.: ENSO variability and natural radiative forcings account for hiatus and apparent observation/CMIP5 model discrepancy
Kühn et al. (2014) GRL: Asian aerosol emissions cannot explain the 16 year hiatus in global warming
Haywood et al. (2013) Atmos. Sci. Lett.: global mean cooling of around 0.02 to 0.03 K over the period 2008-2012 due to small volcanos which are therefore not primary cause of the recent slow-down in global mean surface warming.
Fu (2013) Nature Climate Change reports on study by Garfinkel et al. indicating that disproportionate warming of Indian Ocean and West Pacific may be cooling climate slightly by reducing amount of water vapour entering the stratosphere.
Forster et al. (2013) JGR total anthropogenic and natural adjusted radiative forcing of 1.9±0.9 Wm-2 from CMIP5 models for 2010
Neely et al. (2013) GRL: simulations indicate that moderate volcanic eruptions, not increased Asian SO2 emissions, explain recent observed increase in stratospheric aerosol
Fyfe et al. (2013) GRL: simulations show observed increases in stratospheric aerosol concentration since the late 1990s has decrease the rate of global warming.
Murphy (2013) Nature Geosciences: no evidence for increased direct aerosol cooling effect 2000-2012
Huber and Knutti (2012) Nature Geoscience
Solomon et al. (2011) Science: small but significant cooling effect from volcanic eruptions since 2000
Kaufmann et al. (2011) PNAS: the solar cycle, changes in sulfate aerosol and natural variability mask greenhouse gas warming in 1998-2008 period
Solomon et al. (2010) Science: changes in stratospheric water vapour may influence decadal temperature trends
Murphy et al. (2009) JGR: infer aerosol radiative forcings as a residual between measured terms (greenhouse gas and natural forcings, ocean heat content, outgoing radiation to space)
Philipona et al. (2009) GRL: declining aerosols and rising greenhouse gases forced rapid warming in Europe since the 1980s
See also: Energy imbalance/ocean heating | Modelling | Unforced Variability | Radiative Forcing | Ocean heating | Other relevant papers
Ocean Heating/Circulation
Guinaldo et al. (2025) Comm. Earth Env.: internal variability in the North Atlantic combined with global warming to produce the 2023 North Atlantic marine heatwave
Wang et al. (2024) PNAS: rapid aerosol abatement in China triggers atmospheric circulation anomalies driving warming of northeast Pacific ocean
Li et al. (2024) Nature Comm.: concurrent marine heatwaves and low-oxygen extreme events linked with warming and stratification (the ocean is losing it's breath)
Sohail et al. (2025) ERL: strength of the Antarctic Circumpolar Current declines by ~20% by 2059 for high-emissions scenario due to freshening from icemelt
Josey et al. (2024) Nature: Antarctic sea ice loss of up to 80% in Weddell, Bellingshausen and Ross seas in 2023 doubles mid-winter ocean heat loss
Lee et al. (2024) Nature Comm.: natural variablity that favoured positive North Atlantic Oscillation since early 2010s has offset anthropogenic weakening of AMOC
Senapati et al. (2024) GRL: changes in mixed layer depth dominate sub-tropical North Atlantic decadal variability in SST
Toda et al. (2024) Nature Geosci.: Walker circulation strengthening 1980-2020 explained remote subtropical/extratropical sea surface temperature changes based on SST restoring simulations with southeast Pacific important which models struggle to represent
Gilbert & Holmes (2024) Weather: 2023 Antarctic sea ice extent lowest on record
Gu et al. (2024) GRL: slowing in aerosol decline over Europe/N America leads to warming of N Altantic and S Ocean through increased AMOC and interhemispheric adjustment in westerlies combined with cloud feedbacks to SST pattern
Allen et al. (2024) npj Clim. Atmos. Sci.: biomass aerosol induced weakening of AMOC 1920-1970s then strengthening through altering surface shortwave radiation and pressure gradients with amplification from salinity feedbacks and this implies overestimation in sulphate aerosol effects and the importance of recent wildfire activity in future AMOC variability
Winkelbauer et al. (2024) Clim. Dyn.: Overestimated Arctic precipitation, evaporation and runoff as well as energy flux out of the ocean and poleward oceanic heat transports by CMIP6 models
Needham & Randall (2023) J. Clim.: Sulphate aerosol cooling of northern hemisphere caused increased north poleward energy transport in late 20th century
Royal Society special issue on AMOC, Atlantic overturning: new observations and challenges
Mecking & Drijfhout (2023) Nature Clim.: future decrease in poleward ocean heat transport across all Northern Hemisphere latitudes and south of 10oS
Li et al. (2023) Nature Comm.: global ocean heat uptake nearly doubled from 19902000 to 20102020 due to subtropical Pacific and Atlantic and Southern Ocean mode and intermediate waters
Mayer et al. (2023) ESSD: decreased airsea heat fluxes 1950-2019 in North Atlantic in ERA5 basin suggests a decline in the AMOC with more positive NAO in last 4 decades driving cooling in Irminger & Labrador seas
Kang et al. (2023) PNAS: observed Southern Ocean cooling linked to Antarctic seaice expansion, southeastern tropical Pacific cooling, northward-shifted Hadley circulation, Aleutian low weakening, and North Pacific warming based on modelling
Asbjornsen & Arthun (2023) GRL: A third of future AMOC weakening due to wind stress
Zhu et al. (2023) Nature Comm.: signal of accelerated decline in AMOC identified in Southern Ocean but not in warming hole
Khatri et al. (2023) GRL: ocean response to winter NAO event causes fast winterspring season Ekman transport and ocean-atmosphere heat exchanges temperature response and slow 34 years overturning and gyre circulation redistribute opposing-signed surface temperature
Fernandez et al. (2023) GRL: Rossby waves linked to anomalies in ocean heat flux in central Pacific
Liu et al. (2023) GRL: deep ocean uptake of excess heat from human-caused climate change depends on how salty & dense the upper layers are but many model simulations overestimate how fresh the upper ocean is and so warm at the surface too quickly
Storto et al. (2022) J. Clim.: 2000mbottom ocean heating of 0.08 W/m2 200318, 13% of total ocean warming (0.62 W/m2), based on variational combination of Earth's energy imbalance (CERES), steric sea level (altimetric minus gravimetric) and ocean heat content (Argo)
Li & Su (2022) J. Meteorol. Res.: 0.4 K/decade warming of southwestern Indian Ocean since mid-1990s linked to ocean currents
Storto et al. (2022) J. Clim.: 2000m-bottom warming of 0.080 W m-2 for 2003-2018, 13% of the total ocean warming
Josey & Sinha (2022) Commun Earth Environ: increasing role for ocean in setting North Atlantic mixed layer heat content variability since 1960
Liang et al. (2021) J.Clim.: steady ocean heating below 300m, variable above 300m and cooling in north Atlantic and parts of Southern Ocean in objective analyses with differences relaing to baseline climatology
Savita et al. (2022) J. Clim: spread in spatiotemporal changes in upper=ocean heat content: excluding shallow seas can reduce estimate by 13%
Desbruyeres et al. (2020) JGR: continental boundary and strong current regions important for heat exchange with 700-2000m layer
Caesar et al. (2020) ERL: weaker AMOC associated with cooler surface North Atlantic ocean and reduced global warming
Bryden et al. (2020) J. Clim: reduction in annual ocean heat transport (1.32 PW before 2009 to 1.15 PW for 200916) associated with 2.5 Sv drop in AMOC.
Trenberth & Zhang (2019) J. Clim: Northward ocean MHT at equator 0.75 PW in Atlantic offset by Pacific (-0.33 PW) and Indian Oceans (-0.20 PW); atmosphere transports energy southward (-0.35 PW) with net equatorial MHT (-0.18 PW) enhanced by -0.1 PW that contributes to greater warming of the southern (vs northern) oceans with Indonesian Throughflow playing an important role.
Trenberth et al. (2019) J. Clim: ocean heat transports are estimated from satellite-based surface heat fluxes and adjusted to ensure zero heat transport at north and south of ocean basins and including seasonal cycle and representation of Arctic sea ice which constributes 1 PW variability. Variability at 26N is is correlated with NAO.
Forget & Ferreira (2019) Nature Geosci.: tropical Pacific exports four times as much heat as is imported in the Atlantic and Arctic but global-scale seawater pathways play only a minor role in Earths heat budget (uses Liu et al. (2017) JGR dataset)
Yu (2018) Ann. Rev. Marine Sci.: review of global air-sea fluxes
Tung & Chen (2018) Climate: review of global warming slowdown
Hyder et al. (2018) Nature Comms: tracing biases in climate simulations affecting the Southern Ocean to initial errors in cloud that modify the location of the "roaring 40s" winds and offer a route to improve climate model simulations
Duffy & Bennartz (2018) GRL: snow on ocean a significant surface energy budget term in high latitudes (0-10 Wm-2 (see also Loeb et al. (2016) Clim. Dyn.)
Gastineau et al. (2018) Clim. Dyn.: Negative IPO phase 1998-2012 led to greater heat uptake by cooler tropical Pacific that is redistribution by ocean circulation forced by wind-driven heat convergence at 40oN/S to North Pacific and by enhanced easterlies through ITF to Indian Ocean, heating the atmosphere in both cases, while ocean heat uptake is greatest in the Southern Ocean and northern Pacific.
Cheng & Tung (2018) Nature: slowdown/surge decades linked to decadal strengthening/weakening of AMOC through heat storage in the deep Atlantic
Praetorius (2018) Nature: unprecedented weak state of AMOC due to surface freshening; Caesar et al. emphasise influence anthropogenic influence since 1950s (with temporary recovery between 1995-2015 but Thornalley et al. find weakening began with recovery from Little Ice Age.
Zhang et al. (2018) GRL: 0.1oC/decade warming in upper 700m of the Southern Indian Ocean 1998-2015 linked to strengthening of Indonesian Through-Flow with smaller surface heat flux contribution
Zeng et al. (2018) GRL: Reversal of South China Sea freshening since the 1990s after 2012
Mayer et al. (2018) GRL: Unprecedented reduction of the Indonesian Through Flow Heat Transport and unusual radiation anaomalies in 2015-17 El Nino
Su et al. (2017) JGR: inconsistent subsurface/deep ocean heating across datasets 1998-2013
Li et al. (2017) GRL: South East Indian Ocean hotspot during early 2000s due to increased Indonesian Through-Flow and local atmospheric forcing
Fasullo & Nerem (2017) Water: interplay between ocean heating, precipitation over dry land and precipitable water determine sea level response to ENSO and volcanic eruptions
Wang et al. (2017) Clim. Dyn.: large discrepancies in basin ocean heating as % of global & between layers (e.g. 300-700m)
Liang et al. (2017) J. Clim: increased energy diffusion beneath mixed layer during early 2000s may have contributed to slower surface warming but regionally incoherent suggesting attribution to basin-scale changes is misleading
Desbruyères, et al. (2017) J Clim.: global heat uptake of 0.62-0.80 Wm-2, 90% above 2000-m depth, large part in S. Ocean. Global and full-depth ocean temperature trends during the early twenty-first century from Argo and repeat hydrography
Trenberth and Fasullo (2017) GRL: satellite/reanalysis-based 26oN heat transports 1PW close to RAPID in situ but without negative trend
Hu & Sprintall (2017) GRL: Strengthened Indonesian throughflow 2004-2014 from increased precipitation & freshening
Roberts et al. (2017) JGR-Oceans: Non-Ekman ocean heat transport processes dominate mixed layer ocean heat content in equatorial oceans & regions of strong ocean currents/eddy activity & force atmospheric response.
Llovel & Terray: ocean heat uptake strongest around 40oS; rapid upper ocean warming is linked to a poleward shift of mean wind stress curl enhancing Ekman pumping for the 45oS-60oS band.
Robson et al. (2016) Nature Geosci: upper N Atlantic cooling since 2005 linked to reduced ocean circulation/heat transport, linked to record low densities in the deep Labrador Sea, deep ocean warming since 1995 and long-term freshening
McKinnon & Huybers (2016) GRL: use seasonal energy budget as a constraint on inferred planetary heat content
Desbruyères et al. (2016) GRL: deep ocean below 2000m contributes 0.065+-0.04 Wm-2 to global heating rate 1991-2010 (2/3s of which from 2000-4000m layer)
Cheng et al. (2016) Ocean Science: full-depth ocean heating increased from 0.46 Wm-2 to 0.75 Wm-2 (global average) from 1970-2005 to 1992-2005, similar to CMIP5 median.
Liu et al. (2016) Nature Comms.: heat redistribution in upper 350m between Pacific/Indian Oceans closely tied to surface warming hiatus and linked to Indonesian throughflow response to intensified Pacific trade-winds (see also response to comment by Chen and Tung)
Somavilla et al. (2016) GRL: mid-2000s heat transfer from upper to deeper N Atlantic ocean following strong winter mixing in early 2005 rather than increased AMOC
Wijffels et al. (2016) Nature Climate Change: steady accumulation of heat by the oceans up to the large El Nino of 2015/16; an intensifying hemispheric asymmetry, with 7599% of the heat accumulating south of the Equator, merits consideration.
Glecker et al. (2016) Nature Climate Change: Model estimates verified with long term ocean heating observations show nearly half of the industrial-era increases in global ocean heat content have occurred since about 1997 with over a third of this below 700m depth.
Palmer et al. (2015) Climate Dynamics: Ocean heat content variability and change in an ensemble of ocean reanalyses
Johnson et al. (2015) J. Atmos. Ocean. Tech.: Informing Deep Argo Array Design for monitoring decadal-scale deep ocean temperature trends
Nieves et al. (2015) Science: observations show that heating below the upper 100m ocean have more than compensated slight cooling in the upper 100m over the 2003-2013 period, confirming that redistribution of the heat in the vertical, and in particular in the 100-300m layer in the Indian and Pacific oceans, explain the suppressed rates of surface warming.
Zika et al. (2015) GRL: deep ocean heating due to collapse of "thermally direct" circulation (reduced upward heat flux at higher latitudes e.g. Antarctic bottom water circulation) but continued thermally indirect circulation (upwelling/downwelling at same density) at lower latitudes. The large-scale circulation rather than small-scale mixing determine the heat uptake changes.
Czaja and Marshall (2015) Clim. Dyn.: Why is there net surface heating over the Antarctic Circumpolar Current?
Feng et al. (2015) GRL: Increased rainfall led to freshening of Indonesian throughflow in 2010/11 La Nina event (1999-2001 event also led to freshening)
Lee et al. (2015) Nature Geoscience: analysis of 0-700m ocean heat content data and simulations suggests that strengthened Pacific trade winds and heat flow through the Indonesian archipelago led to heat build up in the Indian ocean, helping to explain the slower surface warming rate since 2000 (although inadequacies in the observations and the unsampled 700-2000m layer mean that the analysis may be incomplete as discussed in Nature N&V by Julia Rosen).
Liang et al. (2015) J. Climate: mechanisms for vertical redistribution of ocean heat content; upward heat transport in deep ocean, implying cooling; advection plays a more important role in setting the spatial patterns of vertical heat exchange
Roemmich et al. (2015) Nature Climate: Steady heating of 0.4-0.6 Wm-2 in upper 2000m ocean from 2006-2013, mostly from mid-latitude Southern oceans. SST follows 0-100m ocean heat content which varies with ENSO but is opposed by 100-500m heat content (apart from in 2013 when almost all of upper 2000m was anomalously warm).
Desbruyères et al. (2014) GRL: full depth temperature changes in northeastern Atlantic since 2003 imply donward heat flux of 0.53 Wm-2 highlighting potential role of this ocean basin in the recent hiatus.
Drijfhout et al. (2014) GRL: Surface warming hiatus caused by increased heat uptake across multiple ocean basins. Heat uptake was estimated to have increased by 0.7 Wm-2 from 1990s to 2000s (about 0.5 Wm-2 global mean).
Cheng and Zhu (2014) GRL: Introduction of Argo introduces artifical jump in ocean heating record; accounting for this suggests a continuous upper ocean (0-700m) warming (0.36+-0.08Wm-2) since 1966.
Llovel et al. (2014) Nature Climate Change: Combine ocean mass data from satellite with satellite altimeter data to infer ocean heating of 0.64 Wm-2 for 2005-2013. Removing upper 2000m heating rate from Argo suggests minimal contribution to ocean heating and sea level rise from deep ocean below 2000m.
Durack et al. (2014) Nature Climate Change: based on simulations and satellite altimeter data, argue that upper ocean heating (0-700m) has been underestimated in Southern Ocean due to assumptions involving infilling sparse data. New estimates of 0-700m heating 1970-2004 of 0.12-0.35 Wm-2.
Wunsch & Heimbach (2014) J. Phys. Oceanography: combine modelling and observations to examing deep ocean heating, finding cooling of the deep ocean but small heating overall
von Schuckmann et al. (2014) Ocean Sci.: closing ocean energy and sea level budget to within uncertainty in the Argo era.
Mayer et al. (2014) J. Clim: interannual variability in ocean heat content in tropical basins dominated by surface fluxes rather than inter-basin transport, although Indonesian Throughflow heat transport is significant.
Kostov et al. (2014) GRL: Atlantic Meridional Overturning Circulation plays an important role in setting the effective heat capacity of the World Ocean
Robson et al. (2014) Nature Geosciences: Observed slowing of Atlantic Meridional Overturning Circulation part of a decadal trend not a short-term fluctuation.
Cazenave et al. (2014) Nature Climate Change: reduced rate of sea level rise since 2006 (relative to 1994-2005 period) due to internal variability and associated movement of water over land redistribution of heat in the ocean during La Nina. Note: extending sea level records past 2012, the slowdown in sea level rise is not apparent
Lyman and Johnson (2013): sampling strategies and layer estimates of ocean heat content since 1950. 2004-2011 heating of 0-1800m layer 0.56 Wm-2; 0.46 Wm-2 for 0-700m 1983-2011.
Hobbs and Willis (2013) GRL: 135 year warming of oceans attributed to anthropogenic factors and energy imbalance of 0.1 Wm
Rosenthal et al. (2013) : pacific ocean heat content (OHC) higher than recent decade for much of last 10,000 years but recent rates of increase in ocean heating are unprecedented
Purkey and Johnson (2013) : freshening of deep Antarctic bottom waters since 1980s (see also perspective by Bindoff and Hobbs)
Masuda et al. (2010) : computer simulations reveal fast teleconnection between changes in air-sea heat flux off the Adélie Coast of Antarctica and the bottom-water warming in the North Pacific.
Purkey & Johnson (2010) Observed ocean heating from 1990s-2000s below 4000m and 1000-4000m in southern ocean equivalent to nearly 0.1 Wm-2 globally
Kouketsu et al. (2010): Observationally-derived estimates of heating below 3000m from 1990s-2000s of about 0.05 Wm-2
Gregory et al. (2013): Climate models without preindustrial volcanic forcing underestimate historical ocean thermal expansion
See also: Energy imbalance/ocean heating | Modelling | Unforced Variability | Radiative Forcing | Deep ocean heating | Other relevant papers
Other relevant papers
Xie et al. (2025) npj Clim. Atmos. Sci.: El Niño plus extratropical variability combined with a background warming of 0.2oC/decade to explain 2023 temperature jump
Bevacqua et al. (2025) Nature Clim.: A year above 1.5°C signals that Earth is most probably within the 20-year period that will reach the Paris Agreement limit
Cannon (2025) Nature Clim. Change: the long-term Paris Agreement target usually crossed well before string of unusually warm temperatures occurs, like in 2023-2024, based on climatge model simulations
Terhaar et al. (2025) Nature: large jump in global SST in 2023/24 would have been impossible without greenhouse gas warming and an unlikely 1 in 500 year evet with greenhouse gas heating based on a synthetic observations-based dataset
Beaulieu et al. (2024) Commun Earth Environ: A recent surge in global warming is not detectable yet.
Medhaug et al. (2017) Nature: multiple factors explained perceived early 2000s global warming hiatus
TeleconectionsLi et al. (2022) JGR: La Niña event in 2020/2021
Chaing & Broccoli (2023) Geosci. Lett.: Pacific cold tongue: eliptical orbit drives annual cycle over Pacific cold tongue 1/3 amplitude of axial tilt effect
Delworth et al. (2015) J. Clim.: North American drought linked to unusual Pacific conditions, likely internal variability. Using coupled models forced with wind stress, continued anomalous wind stress would extend drought conditions but eventually this effect diminishes due to reemergence of warmer water that was initially subducted into the ocean interior.
Trenberth et al. (2014) Nature Climate Change: Seasonal aspects of the recent pause in surface warming
MorphologyJiang et al. (2025) GRL: El Niño & SST warming pattern effects, including delayed continental temperature response to ocean warming, explain 2023 global warmth
Samset et al. (2024) Comm. Earth Env.: 2023 temperatures reflect steady global warming and internal sea surface temperature variability
Zhou et al. (2024) Nature Geosci.: Interdecadal Pacific Oscillation decelerated global warming after 2000, whereas internal variability amplified Arctic warming after 2005 that increased Arctic amplification but accounting for this variability leaves steady Arctic amplification of 3 times global mean throughout the historical period
Park & Yeh (2024) Comm. Earth Env.: Models with low present-day surface density project weaker warming hole intensity due to suppressed oceanic deep convection in the future than models with a high surface density.
Huang et al. (2023) GRL: global observed diurnal temperature range increased 1980-2021 by 0.09 K/decade with largest changes over Europe and Asia, and mostly due to increasing maximum that may relate to declining aerosol pollution but changes are not captured by CMIP6 simulations
Dong et al. (2021) GRL: contrasting warming patterns in coupled models
He et al. (2022) GRL: 50% of N. Atlantic warming hole explained by turbulent heat loss, not circulation weakening, based on an atmopshere model coupled to a slab ocean
Wills et al. (2022) GRL: pattern of Pacific warming since 1979 outside internal climate variability generated by large ensembles from multiple models and may also suggest deficiencies in their simulated responses to radiative forcing
Mantsis et al. (2017) GRL: recent tropical expansion can be explained by internal variability
Song et al. (2016) SREP: hiatus in greenhouse effect increase - this seems to be mixing cause and effect since more frequent, cooler La Nina events will reduce the water vapour greenhouse effect although the cahanges in cloud could be interetsing
Peyser et al. (2016) GRL: dynamically-related sea level rise pattern as a predictor for global surface warming suppression or surge
Turner et al. (2016) Nature: hiatus in Antarctic Peninsula warming linked to natural climate fluctuations
Li et al. (2015) GRL: observed Eurasian winter cooling trend 1998-2012 contributed to suppressing of global warming trend and arises from internal variability
Ying et al. (2015) GRL: using breakpoint analysis only DJF shows interuption of land warming trend.
Trenberth et al. (2015) Science: a variety of evidence shows that there has been a "hiatus" and signs are it is now over but we need to understand the processes that generate decadal fluctuations in climate further.
Saffioti et al. (2015) GRL: Northern Hemisphere winter cooling 1998-2012 mostly explained by missing observations (particularly for recent years) and internal variability in the atmospheric circulation of the NH extratropics.
Gleisner et al. (2015) GRL: Recent global warming hiatus dominated by low latitude surface temperature trends and not explained by missing data in high latitude regions
Cohen et al. (2012) GRL: hiatus influenced strongly by northern hemisphere land (away from the tropics) in winter.
Observing systemsLoeb et al. (2024) J Clim.: Continuity of Earth radiation budget record
Wild & Bosilovich: reanalyses overestimate the global mean surface downward shortwave radiation and underestimate the surface downward longwave radiation by 37 Wm-2 and currently are not suitable references for global mean energy balance components.
Tian et al. (2024) Commun Earth Environ: Arctic warm bias in ERA5
Embury et al. (2024): CCI satellite-based SST since 1980 for climate application
Liu et al. (2024) JGR: Contribution of Surface Radiative Effects, Heat Fluxes and Their Interactions to Land Surface Temperature Variability
McCulloch et al. (2024) Nature Clim.: Caribbean sea sponge skeletal record shows 0.3oC warming from 1860s to 1890s that contradicts a cooling in the directly measured global sea surface temperature record and suggests 1.5oC global warming threshold has already been breached
Zhang & Rossow: ISCCP FH
Feng et al. (2023) Clim. Dyn.: Global mean BSRN observation-constrained longwave down flux 344 Wm-2 with ERA5 simulating the lowest RMS bias (19 Wm-2).
Johnson & Lyman (2023) J. Clim: GOSML ocean mixed layer climatology
Wiese et al. (2022) Earth Space Sci.: GRACE mass change methods (see also Watkins et al. (2022) JGR)
Mayer et al. (2022) J. Clim: ERA5 observationally constrained net surface energy fluxes 19852018
Sun et al. (2022) JAMC: A-Train decomposition of cloud surface radiative cooling and atmospheric radiative heating linked to dynamical regime and column integrated water vapour with systematic biases in reanalyses
Matthews (2021) GRL: possible CERES calibration drift based on moon reference
Kennedy et al. (2019) JGR: HadSST
Hawkins et al. (2017) BAMS: warming since pre-industrial is ambiguous: suggest 17201800 is most suitable yet observing system is inadequate
Cowtan et al. (2015) GRL: using model SST and land air temperature makes a more consistent comparison with observations and reduces the differences between CMIP5 and observed recent warming trends
Karl et al. (2015) Science: update to account for changing coverage of ship and buoy measurements increases surface warming trend since 1998 up to magnitude of 1950-1999 trend (although does not show that recent period contains slower warming than 1980s/90s and coupled model simulations)
Cowtan and Way (2013) Q. J. Roy. Meteorol. Soc.: improved infilling of data gaps in HadCRUT4 increases surface warming trend in 2000s slightly
Kennedy (2013) Rev. Geophys.: A review of uncertainty in in situ measurements and data sets of sea-surface temperature.
Abraham et al. in press Rev. Geophys.: A review of global ocean temperature observations: Implications for ocean heat content estimates and climate change.
Kennedy et al. (2012) Remote Sensing of Environment: uncertainty in sea surface temperature record
Nuccitelli et al. (2012) Physical Letters A: errors in methodology for estimating ocean heating rate.
Schweiger et al. (2011) JGR: PIOMAS - uncertainty in modeled Arctic sea ice volume
Lyman and Johnson (2008) J. Clim.: sampling of ocean heat content and uncertainty estimates
Inter-hemispheric heating asymmetriesKaur et al.(2024) ERL-Climate: climate sensitivity larger when forcing imposed only in the southern hemisphere due to differences in shortwave cloud feedback
Zhang et al. (2023) Adv. Atmos. Sci.: CMIP6 models underestimate the contrast in interhemispheric surface temperatures on average (0.8 K versus 1.4 K for reanalysis data), mostly relating to mid-latitude shortwave reflection by clouds and with underestimating models tending to produce double ITCZs
Pearce & Bodas-Salcedo (2023) J. Clim: clouds flatten implied heat transport, contributing to hemispheric symmetry
Rugenstein & Hakuba (2023) GRL: asymmetry in reflectivity of northern and southern hemisphere depends on current climate state and is expected to increase in coming decades based on observations and simulations.
Yukimoto et al. (2022) GRL: interhemispheric heat transport accounts for 59% of the negative-to-positive trend change in NH precipitation through a northsouth shift in the tropical precipitation zone with remainder due to clear-sky longwave cooling.
Diamond et al. (2022) Commun. Earth Environ.Anthropogenic aerosol and cryosphere changes drive Earths strong but transient clear-sky hemispheric albedo asymmetry
Kim et al. (2022) J. Clim: greater shortwave absorption by water vapour associated with more La Nina state
Jonsson & Bender (2022) J. Clim.: stable interhemispheric asymetary in CERES with model biases mainly relating to SST/cloud bias
Atwood et al. (2020) GRL: A range of idealised forcings produce robust regional tropical rainbelt shifts that are larger than and sometime oppose the direction of the zonal mean shift
Biasutti & Voigt (2020) J. Clim.: idealised modelling finds simple relationship between SST gradient and ITCZ position
Moreno-Chamarro et al. (2019) J. Clim: modelling supports observational evidence of link between Atlantic variability determined by AMOC and ITCZ migrations during the 20th century
L'Ecuyer et al. (2019) J. Clim: global annual mean TOA net cloud radiative effect 17.1+-4.2 Wm-2 (-44.2+-2 Wm-2 shortwave cooling, 27.1+-3.7 Wm-2 longwave heating) and -24.8+-8.7 Wm-2 at the surface (-51.1+-7.8 Wm-2 shortwave, 26.3+-3.8 Wm-2 longwave) with 8.6 Wm-2 more cooling in southern hemisphere than northern due to southern hemisphere stratocumulus.
Hang et al. (2019) J. Clim: clouds induce global net atmospheric heating of 0.07+-0.08 K/day (0.06+-0.07 K/day shortwave absorption minus 0.01+-0.04 K/day reduction of longwave cooling) and warm the tropical atmosphere (0.23 K/day) and cool the polar atmosphere (-0.13 K/day) with 3 times as much cloud heating in the Northern Hemisphere (0.1 K/day) than the Southern Hemisphere (0.04 K/day) and make the strongest contribution to the annual mean atmospheric energy imbalance between the hemispheres (2.0+-3.5 PW).
Zhau & Suzuki (2019) J. Clim.: Black carbon causes a northward shift of the intertropical convergence zone (ITCZ), mainly through a fast precipitation/circulation response, whereas sulphate aerosol forcing causes a southward shift of the ITCZ through a slow, temperature-dependent precipitation response with magnitudes of -3 degree latitude per petawat change in cross equatorial energy transport.
Watt-Meyer et al. (2019) GRL: CO2 forcing causes more southern than northern hemisphere Hadley Cell expansion
Donohoe et al. (2019) GRL: simulations overestimate seasonal range of ITCZ which reduces as climate warms due to more efficient cross equatorial heat transport
Zuo & Zhoua (2019) J. Clim: multi-century paleoclimate data confirms tropical eruptions strengthen monsoon precipitation in the opposite hemisphere and weaken it in the opposite hemisphere, explained through modellling by changes in circulation and cross equatorial moisture transport
Armour et al. (2019) J.Clim: polar-amplified warming an inevitable consequence of a moist, diffusive atmospheres response to greenhouse gas forcing
Irving et al. (2019) GRL: anthropogenic aerosol drives current greater ocean heat uptake in southern hemisphere compared to northern hemisphere which will resverse as greenhouse gas forcing dominates in the future
Samanta et al. (2019) GRL: unrealistic double ITCZ with excessive precipitation south of the equator is linked to an overly strong equatorial cold tongue that reduces realism of future projections in the water cycle
D'Agostino et al. (2019) GRL: simulated northern hemisphere monsoon strengthening response to mid-Holocene orbital forcing not a good analogue for projected greenhouse gas warming where thermodynamic drivers compensate dynamic changes.
Hill et al. (2018) J. Clim.: uniform warming drives Sahelian drying in one model thrugh enhanced dry air advection and subsidence
Lembo et al. (2018) Clim. Dyn.: Simulations indicate hemispheric energy imbalance and simulated cross-equitorial energy transports increases in the 20th century are due to inter-hemispheric asymmetry in the aerosol forcing and effects relating to cloud and snow/ice cover
Smyth et al. (2018) GRL: simulated response of ITCZ to early Holocene orbital forcing leads to northward progression of west African monsoon, explained by increases in total gross moist stability in the northern tropics rather than conforming to conventional inter-hemispheric energetic framework theory.
Hawcroft et al. (2018) Clim. Dyn.: strong relationship between cross-equatorial atmospheric energy transport, tropical precipitation asymmetry and tropical SST biases
Trenberth and Fasullo (2018) J. Clim: updated formulation of atmospheric energetics to account for enthalpy and other terms (see also Mayer et al. (2017) J. Clim
Dixit et al. (2018) GRL: Lower tropospheric heating by upper tropospheric clouds dominant cloud radiative influence on location of the ITCZ
Chung & Soden (2017) Nature Geosci.: indirect aerosol effects dominate inter-hemispheric climate shifts including Sahel drought in the 1980s
Mayer et al. (2017) J. Clim: including enthalpy fluxes alters cross equatorial energy transports
Green et al. (2017) GRL: ITCZ position/Hadley cell strength linked to N Atlantic & N Pacific multidecadal SST and heating/cooling of extra-tropical atmosphere
McFarlane & Frierson (2017) GRL: reduced ice & aerosol emissions warm northern hemisphere driving northward shift in tropical rainy belt but this is offset by compensating ocean heat transports in climate projections
Singarayer et al. (2017) Sci. Rep.: orbital variations produce expansion/contractions in global zonal mean ITCZ rather than shifts which are regionally dependent
Lembo et al. (2017) Clim. Dyn.: ERA-20CM shows a fast transition from negative to positive TOA imalance in 1970s (not found in ECHAM5-HAM); aerosol forcing affects TOA and surface EBs by setting up an inter-hemispheric gradient after 1960s
Roberts/Valdez/Singarayer (2017) GRL: problematic to use cross-equatorial atmospheric energy transport to interpret glacial/interglacial ITCZ/pecipitation changes in the tropics
Su et al. (2017) Nature Comms: Tightening of ITCZ with warming modulates precipitation response through high cloud influence on radiative heating of the atmosphere; CMIP5 models tend to underestimate these feedbacks and consequently the precipitation response
Yim et al. (2017) GRL: land-sea thermal contrast across Pacific determines simulated trends in Walker circulation
Potter et al. (2017) GRL: Namibian stratocumulus important in determining ITCZ position in idealised experiment
Voigt et al. (2017) JAMES: slow shifts in ITCZ in response to idealised anthropogenic aerosol more effective than fast responses to land sea warming/cooling
Boos & Korty (2016) Nature Geosci.: zonal+meridional energy fluxes determine regional ITCZ shifts; feedbacks also required to explain green Sahara in mid-holocene
Byrne and Schneider (2016) GRL: physical mechanisms causing narrowing of ITCZ in warmer climate
Adam et al. (2016) GRL: hemispherically antisymmetric precipitation biases related to the cross-equatorial atmospheric energy transport; symmetric biases related to atmospheric net energy input near equator
Hawcroft et al. (2016) Clim. Dyn.: correction of southern ocean cloud reflectivity bias doesn't fix cross equatorial energy transport bias due to ocean transport adjustment in HadGEM2-ES (see similar results for CESM-CAM5 by Kay et al. (2016) J. Clim..
Haywood et al. (2015) GRL: removing asymmetry in hemispheric albedo in HadGEM2-ES climate model improves rainfall distribution and tropical cyclones
Ruzmaikin et al. (2015) JAS: link between AMOC and inter-hemispheric heating variation on multi-decadal timescales
Pausata et al. (2015) PNAS: long lasting effects of high latitude volcanic eruptions on ENSO and AMOC through hemispheric heating asymmeries
Allen et al. (2015) J./ Clim.: interhemispheric aerosol radiative forcing and cloud interaction effects explain tropical precipitation shifts in late 20th century
Dong and Sutton (2015) Nature Climate Change: greenhouse gas focing explains much of increase in Sahel rainfall since 1980s through enhanced meridional temperature gradient with a secondary role for aerosol
Brönnimann et al. (2015) Nature Geosci.: Southward shift of northern tropical belt 1945-1980 linked to inter-hemispheric cooling/heating of sea surface, particularly in Atlantic
Stephens et al. (2015) Rev. Geophys.: The albedo of Earth - hemispheric symmetry in albedo due to brighter northern hemisphere surface but more clouds in southern hemisphere; interhemispheric radiative imbalance of 0.6 Wm-2 explained by outgoing longwave (higher in north). Models do not consistently simulate the interhemispheric differences and represent unrealistic seasonal cycles in albedo and overestimate its interannual variability.
Feng et al. (2015) Adv. Atmos. Sci. Simulation of the equatorially asymmetric mode of the Hadley circulation in CMIP5 models
Loeb et al. (2015) Clim. Dyn.: Observed imbalance of 0.6 Wm-2 determined by southern hemisphere. Climate model biases in cross equatorial energy transports linked with precipitation biases.
Haywood et al. (2013) Nature Clim.: high latitude volcanic eruptions induce Sahel rainfall changes linked to asymmetric hemispheric cooling effect
Frierson et al. (2013) Nature Geoscience: northward transport of energy in Atlantic explains present day position of ITCZ in northern hemisphere
Broecker & Putnam (2013) PNAS: Hydrologic impacts of past shifts of Earth's thermal equator offer insight into those to be produced by fossil fuel CO2
Chiang et al. (2012) JGRENSO and Atlantic ITCZ position
Riehl & Simpson (1979) Contrib. to Atmos. Phys. - Heat balance of the equatorial trough zone, revisited
FeedbacksKaur et al. (2025) Clim. Dyn.: larger climate sensitivity from high latitude radiative forcing by factor of 2 in northern hemisphere and factor of 3 in southern hemisphere with all types of feedback contributing
Van de Koot et al. (2025) J. Clim.: constrasting interannual verses long-term tropical cloud feedback due to differing dynamical mechanisms with weakening cloud radiative effect over land since 1985 with a neutral net cloud feedback of 0.22±1.40 Wm-2K-1 due to cancellation between positive longwave feedback of 1.42±1.40 Wm-2K-1 and a non-significant negative shortwave feedback of -1.20±1.52 Wm-2K-1.
Mutton & Andrews (2025) GRL: less negative Antarctic sea ice feedback increased global temperature trend by 0.01-0.06 K/decade in coupled modelsduring 1985-2024
Gloeckner et al. (2025) GRL: clear-sky feedback around 2 Wm-2K-1 for 2008-2023 interannual variabilty based on reanalyses with lower values beforedue to differing relative humidity changes and with mid-tropospheric drying explaining higher values
Uribe et al. (2024) ACP: climate sensitivity constrained to 1.95 to 3.12 K based on long term radiation budget data from ERA5/DEEP-C/CERES.
Thackeray et al. (2024) GRL: shortwave cloud radiative properties across the Southern Hemisphere extratropics most robustly correlated with tropical cloud feedback and constrained to 0.52+-0.34 W/m2/K based on modelling.
Monisha et al. (2024) JAMES: weakening of the Hadley circulation decreases the convectively-detrained ice cloud condensates in the deep tropics, reducing tropical high cloud
Cooper et al. (2024) Sci. Adv.: accounting for SST spatial pattern at Last Glacial Maximum, with large cooling in northern oceans, reduces estimates of climate sensitivity to 1.7 to 3.5oC with a best estimate of 2.9oC in combination with other lines of evidence
McKim et al. (2024) Nature Geosci.: weak anvil area cloud feedback of -0.05 to 0.09 Wm-2/K
Raghuraman et al. (2024) JGR: small tropical high cloud feedback due to cancellation between longwave and shortwave radiation based on satellite data 2006-2020
Meyssignac et al. (2023): Time-variations of the climate feedback parameter are associated with the Pacific Decadal Oscillation. Commun Earth Environ 4, 241 (2023).
Salvi et al. (2023) JGR: radiative feedback depends on forcing agent, primarily through the effect of tropospheric stability on cloud-shortwave radiation but also pattern of temperature change without forcing with volcanic forcing particularly effecting time evolution of feedbacks in historical record
Zhang et al. (2023) GRL: climate is nearly twice as sensitive to Southern Ocean radiative forcing as tropical forcing in contrast with the conventional SST-pattern effect where tropical surface temperature changes regulate climate sensitivity
Feng et al. (2023) ERL: linearity of clear-sky OLR relationship with temperature and deviations from it linked to surface emission, foreign pressure broadening effect on water vappur and other greenhouse gases and atmospheric humidity
Salvi et al. (2023) JGR: time variation of feedbacks depend on forcings with lower effective climate sensitivity for volcanic than greenhouse-gas forcing due to efficient cooling of the Pacific warm pool
Kang et al. (2023) Nature Geosci.: observed Southern Ocean cooling reduces cloud feedback by half coimpared to free-running coupled models with particularly strong effect in south east Pacific stratocumulus
Mitevski et al. (2023) GRL: Model-dependent decrease in climate sensitivity for progressive increases in CO2 due to collapse of AMOC
Shin et al. (2023) Earth Future: initially cold Southern ocean models simulate faster global warming by absorbing more downward shortwave radiation due to low altitude cloud and sea ice feedbacks
Roemer et al. (2023) Nature Geosci.: Spectral longwave feedback: water-vapour absorption bands exhibit substantial stabilizing net feedback due in part to changes in relative humidity
Pauling et al. (2023) GRL: Climate Response to Mt. Pinatubo Eruption Does Not Constrain Climate Sensitivity
Eastman et al. (2022) JGR: evaluation of marine stratocumulus plus indications ERA5 underestimate cover
Shin et al. (2022) Earth Future: climate models with cold and cloudy Southern Oceans simulate faster global warming by absorbing more downward shortwave radiation due to a stronger low cloud amount feedback
Vogel et al. (2022) Nature: observational evidence refutes mixing-desiccation cloud fraction decrease mechanism leading to high sensitivity climate simulations
Cutler et al. (2022) GRL: Lower tropospheric stability/Estimated Inversion Strength are primarily linked with stratocumulus amount, not all low altitude cloud
Salvi et al. (2022) GRL: global radiative feedback more amplifying for aerosol than GHG forcing, and hence also less amplifying for historical than future due to emphasis of regions where boundary layer decoupled from free troposphere
Schneider et al. (2021) Nature Geosci.: stratocumulus decks break up into scattered clouds when CO2 levels rise above 1,200 ppm based on very high resolution simulations
Needham & Randall (2021) GRL: atmospheric cloud radiative effect and precipitation approximated through column relative humidity
McKim et al. (2021) GRL: update on tropical and longwave radiative feedback and the super-greenhouse effect
Richards et al. (2021) GRL: clear-sky OLR loops related to lapse rate and humidity changes
Salvi et al. (2021) GRL: cloud adjustment depends on vertical heating profile of forcing agent with boundary layer heating leading to increase and free troposphere heating leading to a decrease in cloud radiative effect
He et al. (2021) GRL: interannual variability does not serve to constrain the long-term LR+WV feedback spread that is dominated by the varying tropical RH response to interhemispheric warming differences under clear-sky conditions and the RH-fixed LR feedback under all-sky conditions
Mülmenstädt et al. (2021) Nature Clim.: warm clouds precipitate too readily in models, producing unrealistically small negative feedback from cloud lifetime changes
Myers et al. (2021) Nature Clim.: observational constraints on low cloud feedback suggest climate sensitivity of ~3 degC
Mackie et al. (2021) JGR: observed cloud-SST feedbacks in ascending and descending regimes
Wang et al. (2021) GRL: climate models with strongest amplifying cloud feedbacks also have stronger aerosol particle cloud brightening cooling effects that are less able to simulate observed northern minus southern hemisphere temperature difference
Zhou et al. (2020) Nature Clim.: Greater committed warming after accounting for the pattern effect
Sherwood et al. (2020) Rev. Geophys.: climate sensitivity 66% range 2.63.9 K supported by 3 lines of independent evidence
Loeb et al. (2020) GRL: climate simulations capture but in some cases underestimate amplification of climate response by low clouds during 2015/16 El Nino
Zelinka et al. (2020) GRL: Larger climate sensitivity in CMIP6 due to stronger amplifying cloud feedbacks involving greater reductions in low cloud cover with warming and weaker increases in low cloud water content, mostly in extratropics
Jiménez-de-la-Cuesta & Mauritsen (2019): Emergent constraint on transient climate sensitivity of 1.2-2.2 K based on post-1970s small aerosol forcing variability warming period
Li et al. (2019) J. Clim: prescribing increases in precipitation efficiency with temperature in a high resolution climate simulation produces a positive amplifying feedback due to cirrus cloud thinning overwhelming a negative declining extent (IRIS) fedback
Skeie et al. (2018) ESD: effective (non equilibrium) climate sensitivity of 2oC inferred using updated, weaker aerosol radiative forcing and ocean heat content data
Proistosescu et al. (2018) GRL: feedbacks diagnosed from variability represents response from stochastic noise, not forcings and displays contrasting monthly and yearly correlations
Yuan et al. (2018) GRL: climate simulations underestimate low cloud cover-SST amplifying feedback and so probably also the magnitude of natural fluctuations & future warming.
Marvel et al. (2018) GRL: climate sensitivity diagnosted from present-day SST-forced experiments poor proxy for future due to poor constraint of stratocumulus cloud responses
Silvers et al. (2017) GRL: variability of the climate feedback parameter not driven by stratocumulus dominated regions in the eastern ocean basins, but rather by the cloudy response in the rest of the tropics.
Ceppi and Gregory (2017) PNAS: increased climate sensitivity over time is linked to changes in atmospheric stability relating to the evolution of sea surface temperature patterns: over multiple decades, initially homogeneous tropical warming becomes stronger in the eastern Pacific and high latitude oceans, leading to reduced stability (since warming aloft is linked to tropical warm pool temperature), fewer low clouds and greater solar heating with both lapse rate and low cloud changes causing feedbacks to become more amplifying. These changes are consistent with interannual variability from satellite observations and the work additionally helps to resolve discrepancies between observed and simulated climate sensitivities.
From Paulo Ceppi: The amount of future warming in response to a given increase in carbon dioxide concentration is known as the sensitivity of the climate system. In state-of-the-art climate models, whose projections are used by the Intergovernmental Panel on Climate Change, the sensitivity rises as time passes, following an increase in carbon dioxide concentration. In our paper, we explain why this happens. It has previously been established that we expect the upper atmosphere to warm faster than the surface. We show that, as time passes, the difference between the rates of warming high up and near the surface becomes less pronounced. This has two effects: first, it favours a decrease in cloud cover, which means that more sunlight can reach the surface and warm the climate; second, it reduces the ability of the atmosphere to cool the climate by emitting extra thermal radiation to space. Both effects contribute to enhancing the amount of surface warming in response to rising carbon dioxide. This discovery improves our physical understanding of the model projections. Furthermore, we show that the same effects can be seen in response to natural year-to-year fluctuations in surface temperature both in observations of recent years and in model simulations. This resemblance of models to observations increases our confidence in model projections that the climate sensitivity will increase over time in the future.
Andrews and Webb(2017) J. Clim: cloud and lapse rate feedbacks in tropical east Pacific related to stability and pattern of SST responses
Knutti et al. (2017) Nature Geosci.: beyond equilibrium climate sensitivity
Liu et al. (2017) JGR: tropical high cloud decreases with surface temperature, enhancing radiative cooling and accounting for 16% of precipitation increases over 2002-2015 period
Lipat et al. (2017) GRL: CMIP models with narrower Hadley cells warm more 28-48oS, increasing climate sensitivity
Ceppi et al. (2017) Wires Climate: Cloud feedback mechanisms and their representation in global climate models
Williams & Pierrehumbert (2017) GRL: observational evidence against stabilising tropical cloud feedback (High-clouds decrease with warming in regions of deep-convection, but increase elsewhere)
Gregory and Andrews (2016) GRL: spatial patterns of warming alter climate sensitivity
Norris et al. (2016) Nature: Vertical & spatial signals of changes in cloud since 1980s consistent with CMIP5 simulations
Terai et al. (2016) JGR: mid/high latitude cloud feedback too negative in climate models
Brient and Schneider (2016) J. Clim.: Satellite data show low clouds amplify climate variability and imply models with higher climate sensitivity are more realistic
Rugenstein et al. (2016) GRL: Dependence of global radiative feedbacks on evolving patterns of surface heat fluxes
Mauritsen & Stephens (2015): increasing the rate of conversion of cloud water to rain as the climate warms into a model introduces a negative IRIS feedback effect but this is small, reducing climate sensitivity to doubled carbon dioxide from 2.8oC to 2.2oC
OtherRisbey et al. (2018); Lewandowsky et al. (2018) ERL: argue that a statistically robust slowdown in global surface temperatures was not clear, that discrepancies with simulations can be explained by updated forcing and temperature observations and and that scientific research was set back by the emphasis on explaining the slowdown
Rahmstorf et al. (2017) ERL: slowdown in surface warming less obvious when avoiding naive statistical pitfalls
Fyfe et al. (2016) Nature Climate Change: there was a significant slowing in surface warming from the 1990s to the 2000s
Lewandowsky et al. (2015) Sci. Rep.: hiatus or pause are unsuitable definitions for the temporary slowing in surface warming
Josey et al. (2015) Clim. Dyn.: Strong evaporation & heat loss from N. Atlantic linked to wet UK winter 2013/14 & cold sub-polar water late 2014
Lewandowsky et al. (2015) BAMS: argue that the the notion of a "pause" in global warming was adopted by the scientific community in its problem-solving and answer-seeking role and has led to undue focus on, and mislabeling of, a recent climatic fluctuations
Rajaratnam et al. (2015) Climatic change: statistical analysis shows there is no hiatus in the increase in the global mean temperature, no statistically significant difference in trends, no stalling of the global mean temperature, and no change in year-to-year temperature increases.
Wild et al. (2015) Clim. Dyn.: The energy balance over land and oceans: an assessment based on direct observations and CMIP5 climate models
Lewandowsky et al. (2015) Glob. Env. Ch.: "Seepage paper" - uses global warming "hiatus" as an example of where scientific process may be altered by vested interests.
Trenberth et al. (2015) JGR: large changes in net imbalance from month to month fluctuations in cloud while year to year changes dominated by ENSO when ASR and OLR act in unison. Strong local relationship between tropospheric T and OLR; land and ocean regressions contrast (cloud changes drive land T change while SST change drives local cloud change). Regression between net imbalance and surface T of 2.18 Wm-2K-1 cannot reliably infer climate sensitivity. Changes in SSM/I January 1992, SST data in mid 2001 and loss of F13 SSM/I in 2009 cause spurious decrease in ERA-Interim water vapour, SST and net flux repectively while an increase in CERES clear-sky net flux after January 2008 may be affected by the change in clear-sky screening data.
Pretis et al. (2015) Climate Change: testing whether particular mechanisms improve simulation of hiatus in a statistically significant sense no evidence is found that the slowdown in global mean surface temperature increases are uniquely tied to episodes of La Niña-like cooling.
Estrada et al. (2013) Nature Geosci.: Statistical analysis of radiative forcings suggests role of ozone, methane and CFCs in the slowdown of global warming sinc ethe 1990s.
Heaviside and Czaja (2012) QJRMS: Deconstructing the Hadley Cell Heat Transport.
Simmons et al. (2009) JGR: declining trends in relative humidity over land in recent decade
Harries and Futyan (2006): time-scales of water vapour, clud and radiation associated with growth and decay of Mt. Pinatubo perturbation to net imbalance: temperature and humidity responses are delayed by 2-3 years although the 6.7 micron brightness temperature changes share some characteristics with the rapidly responding radiative SW fluxes, presumably due to an aerosol signal affecting this water vapour absorption channel.
See also: Energy imbalance/ocean heating | Modelling | Unforced Variability | Radiative Forcing | Deep ocean heating | Other relevant papers
[PROJECT DESCRIPTION| LINKS | LATEST NEWS]
Work in progress (Chunlei Liu)... See also: surface | uncertainty | LH | CLiVAR | asym
Richard P. Allan Location: Department of Meteorology (2U15)

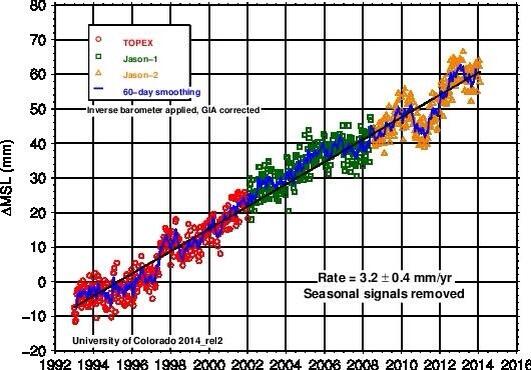
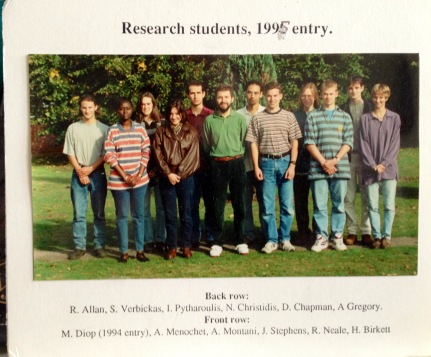
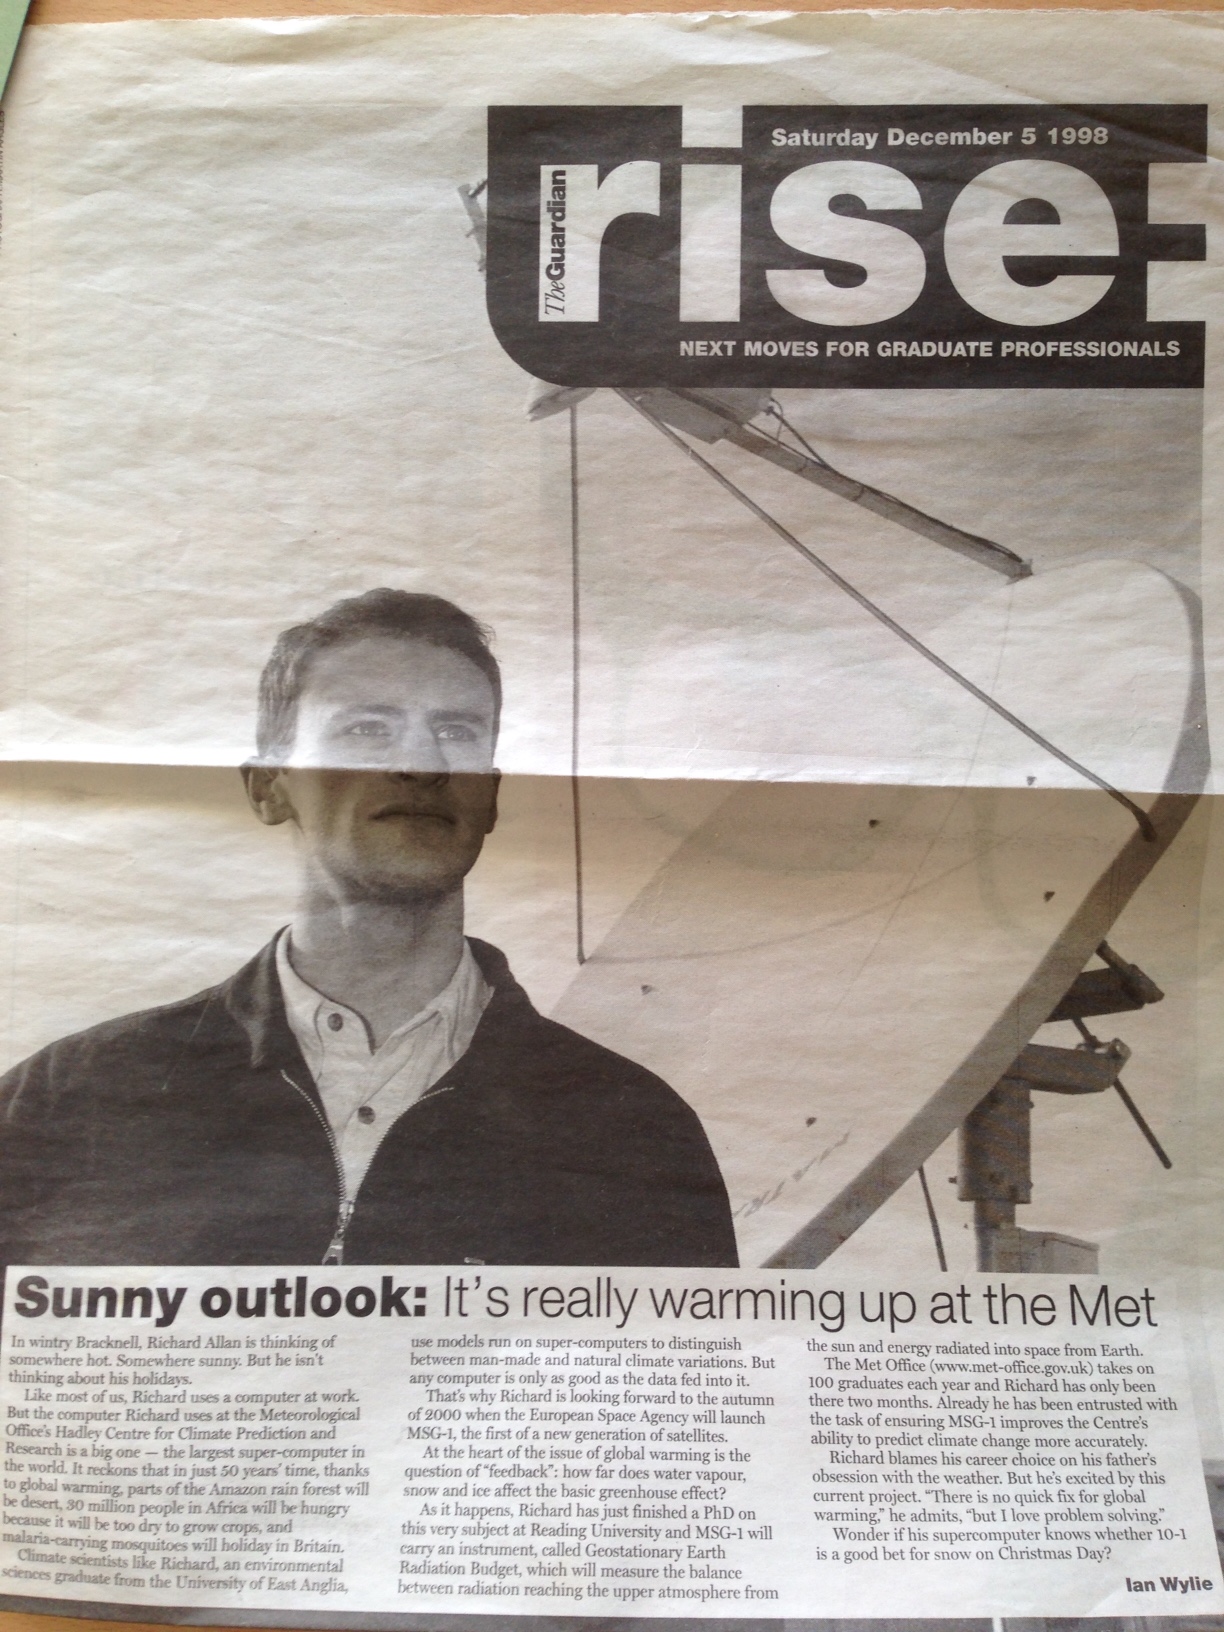