Wednesday 23/09/2015
Surface fluxes from reanalysis of ERAINT, ERA20C, 20thCR, JRA55 and MERRA.
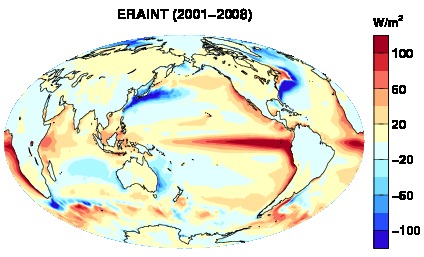
Fig. 1: Multi-annual (2001-2008) mean of total net surface flux from ERAINT. Positive downward.
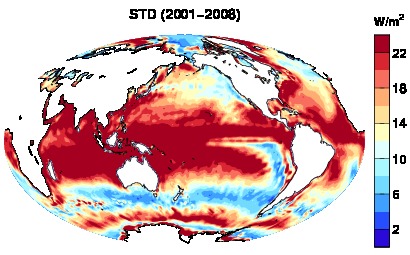
Fig. 2: Standard deviation of multi-annual (2001-2008) mean of 5 data sets (ERAINT, ERA20C, 20thCR, JRA55 and MERRA).
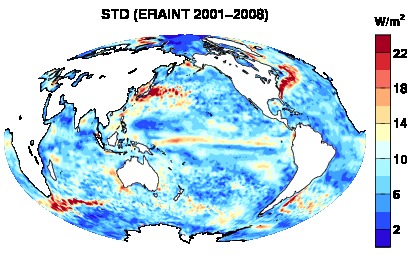
Fig. 3: Standard deviation of interannual variability of ERAINT.
NOTE:
- Calculate annual mean 2D flux first.
- Calculate tandard deviation of the annual mean over 2001-2008.
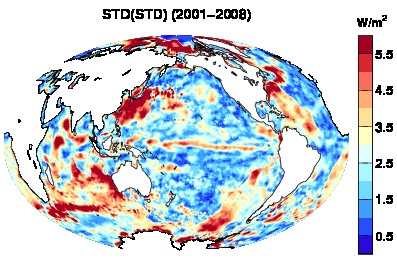
Fig. 4: Standard deviation of Fig.3.
NOTE:
- (1) Calculate standard deviation of interannual variability (Fig. 3) for 5 data sets respectively.
- (2) Calculate standard deviation of (1).
Tuesday 22/09/2015
We have derived surface fluxes of Fmass-ERAINT, Fmass-ERA20C and Fmass-MERRA (Fmass-ERA40 only from 1985-2000). They are mass corrected and land surface flux adjusted.
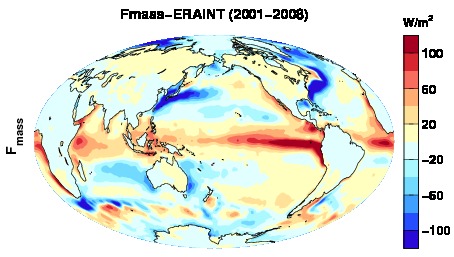
Fig. 1: Multi-annual (2001-2008) mean of total net surface flux from Fmass-ERAINT. Positive downward.
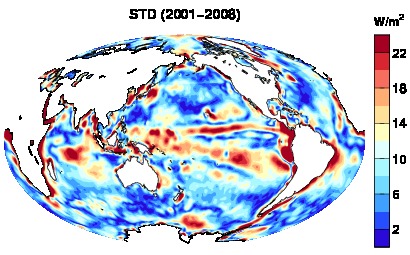
Fig. 2: Standard deviation of multi-annual (2001-2008) mean of 3 data sets (Fmass-ERAINT, Fmass-ERA20C and Fmass-MERRA).
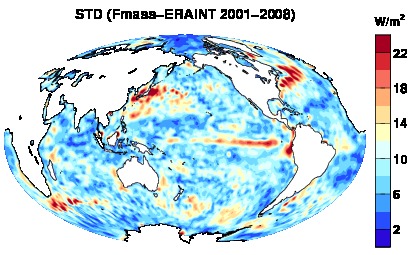
Fig. 3: Standard deviation of interannual variability of Fmass-ERAINT.
NOTE:
- Calculate annual mean 2D flux first.
- Calculate tandard deviation of the annual mean.
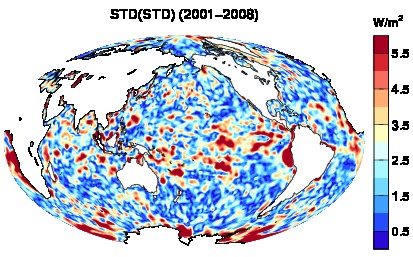
Fig. 4: Standard deviation of Fig.3.
NOTE:
- (1) Calculate standard deviation of interannual variability (Fig. 3) for Fmass-ERAINT, Fmass-ERA20C and Fmass-MERRA, respectively.
- (2) Calculate standard deviation of (1).