Hemisphere energy imbalance (following Leob et al. 2015 and Liu et al. 2015)
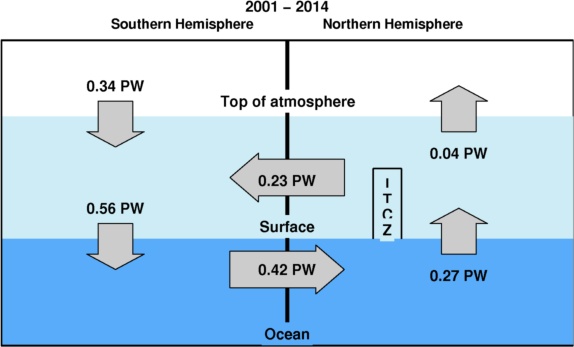
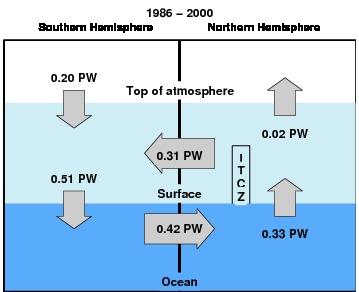
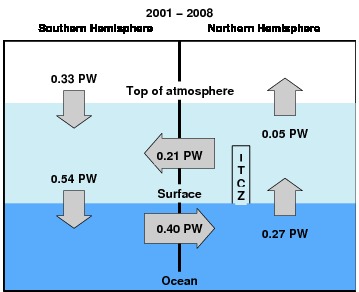
Fig. 1: Multiannual mean hemisphere energy asymmetries over 2001-2014 (ignore the heat accumulation in the ocean).
Based on Roemmich et al. (2015) (Table 1 last column), the heat accumulation is:
NH: 0.8x10²¹ J/yr = 0.025 PW
SH: 7.2x10²¹ J/yr = 0.228 PW (nearly 10x as much).
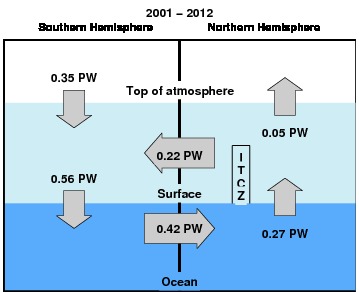
Adding a bit for deep ocean heating (0.1 Wm2 = 0.026 PW) and setting total ocean heating to equal surface fluxes, we get something like 0.25 PW accumulating in the southern ocean and 0.05 PW in the northern oceans which would imply an OHTEQ of:
0.5*((0.56-0.25)+(0.27+0.05))=0.32 PW as indicated in the diagram below (smaller than the 0.44 PW in the paper of Loeb et al. 2015).
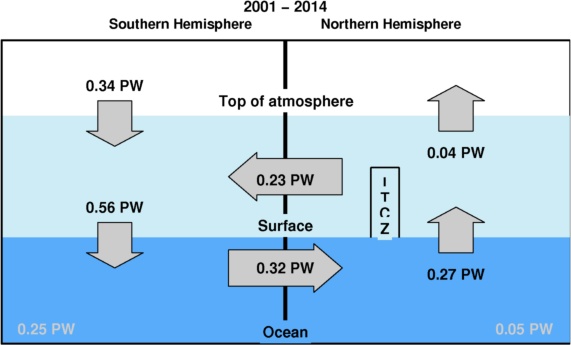
Fig. 2: Multiannual mean hemisphere energy asymmetries over 2001-2014 (considering the heat accumulation in the ocean, please see Roemmich et al. 2015 for details).
Monday 19/10/2015
Energy and precipitation asymmetres from UPSCALE xgxqe.
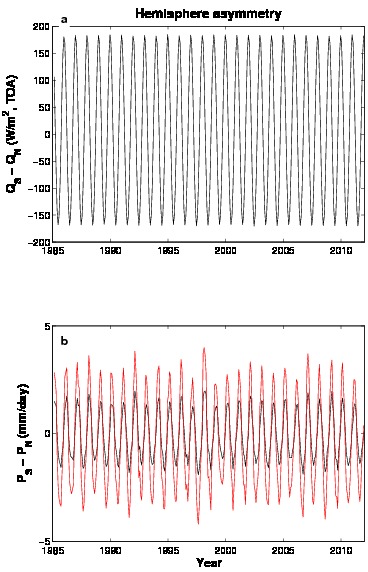
Fig. 1: Time series of hemisphere asymmetries. (a) QS - QN; (b) PS - PN. Q and P are energy and precipitation respectively
- In (b), black line is hemisphere mean and the red line is tropical area mean.
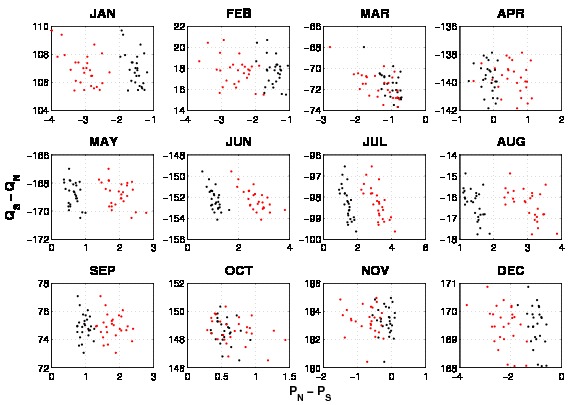
Fig. 2: Scatter plot of hemisphere energy asymmetry (QS - QN) and precipitation asymmetry PN - PS for each month.
- Black dots are hemisphere mean and the red dots are tropical area mean.
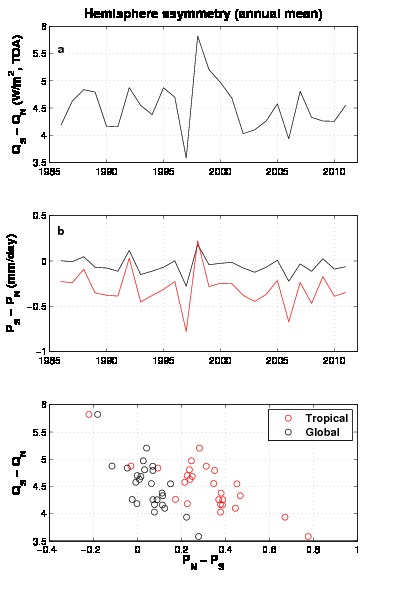
Fig. 3: Annual mean hemisphere asymmetries of (a) energy and (b) precipitation. (c) is the scatter plot.
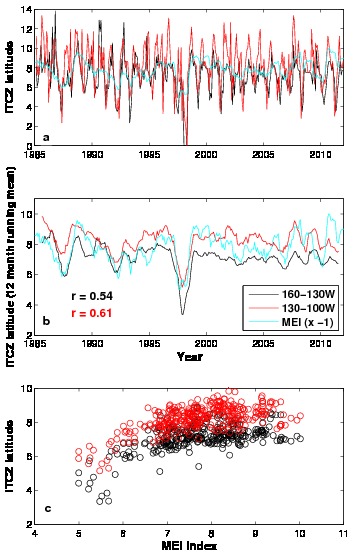
Fig. 4: ITCZ latitude variation and its relationship with ENSO. (a) ITCZ latitude; (b) 12 month running mean of the ITCZ latitude; (c) is the scatter plot.
- MEI index is plotted as well.
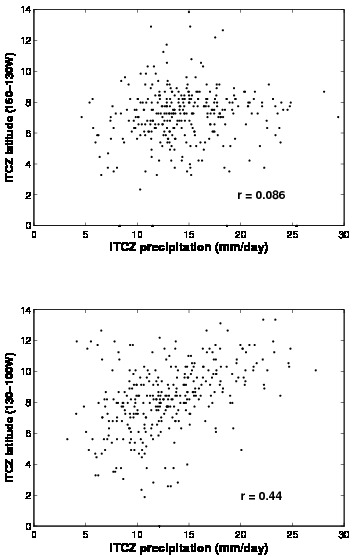
Fig. 5: Scatter plot showing ITCZ position and intensity. (a) ITCZ between 160-130W and (b) between 130-100W.
- There is no relations for 160-130W segment.
- The correlation coefficient is 0.44 for 130-100W segment.