
October 2014:
Improved observations of ocean heating and sea level rise
Two recent publications in Nature Climate Change advance our understanding of how the oceans are heating and the resulting sea level rise.
In the first, Llovel et al. cleverly combine satellite measurements of gravity fluctuations to infer changes in the weight of the ocean below with other satellite estimates of sea level height. Increased ocean mass implies that a greater amount of water is being added to the oceans, for example through melting of land-based ice. Removing the sea level rise associated with this mass contribution from the overall sea level rise from additional satellite sea height observations leaves behind the contribution to sea level rise from the expansion of water in response to warming (warmer water occupies greater volume).
The estimates based upon this method are also consistent with independent measurements of ocean heating from thousands of automated "Argo" floating buoys which cover most of the oceans (they sink to nearly 2000m depth, taking measurements of temperature and salinity (saltiness) before rising to the surface and beaming their information back to satellite). Their full ocean heating estimates (0.64 Wm-2) are consistent with recent observations of planetary heating rate.
The Llovel et al. study implies that the contribution to sea level rise from below 2000m is small, although there is considerable uncertainty and this applies to a very short period, 2005-2013. Also, their conclusions depend upon the Argo observations which, comprehensive as they are, are not able to sample shallow yet important oceans with regard to heat content such as the Arctic and Indonesian region. Notwithstanding these caveats, their analysis is elegant but unfortunately not reassuring in the context of sea level rise. It indicates that heating from rising greenhouse gas concentrations has primarily affected the upper 0-2000m depth of the ocean. A discernible heating of the deep ocean below is not yet detectable, nor are any significant contributions of the deep ocean to current rates of sea level rise. Since the layer below 2000m contains half the ocean volume, as these begin to warm substantially over many hundreds of years in response to the surface heating, we are committed to long-term sea level rise and there is the potential for accelerating rates of rise which may challenge societies' ability to adapt.
In the second article, Durack et al. help to reconcile observed ocean heating over a longer duration (1970-2005) with sea level rise. In simulations, the upper 700 dbar of the northern and southern hemisphere ocean heat up evenly (a decibar, dbar, is a measure of pressure which increases with ocean depth such that 700 dbar is about 700m depth). Since the Southern Hemisphere contains 60% of the ocean volume (due to the distribution of the continents) it therefore should contribute proportionally more to the global heat content and sea level rise. Their analysis demonstrates that the simulations agree in this respect with satellite estimates of sea level height but they don't agree with ocean heat content observations which, according to Durack et al., appear to underestimate the contribution of the Southern Oceans.
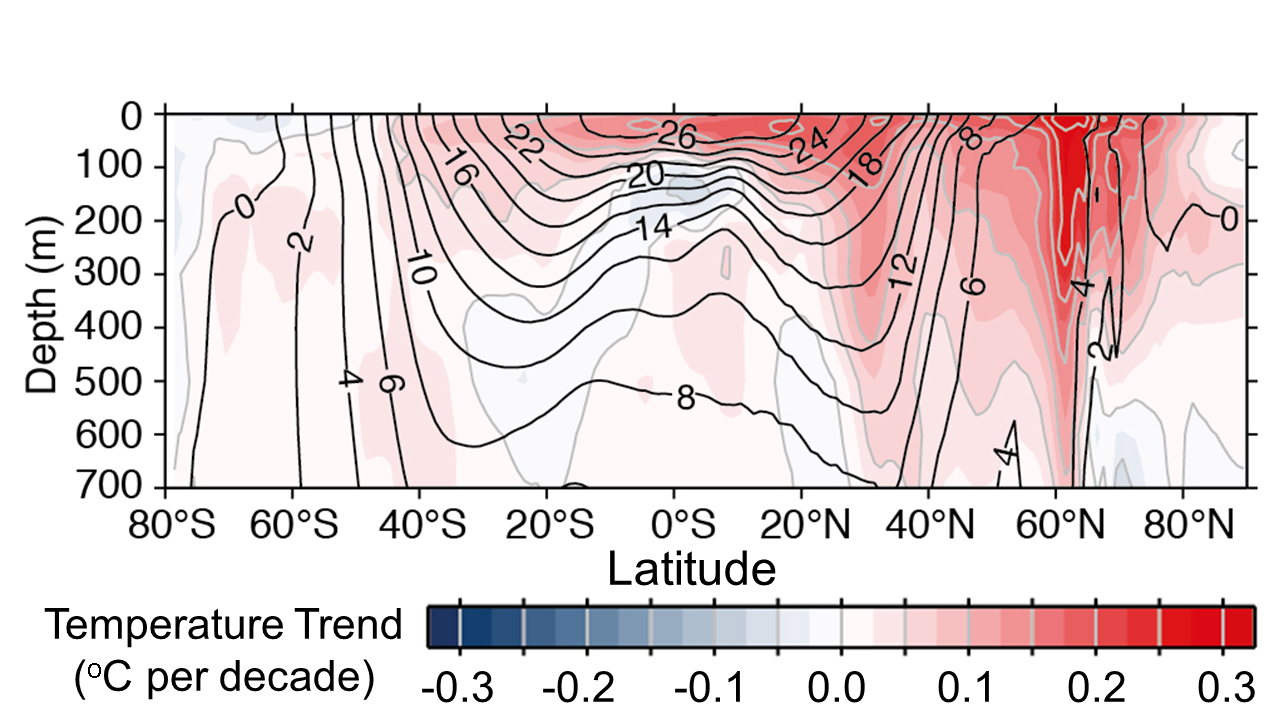
Observed warming rate (in degrees Celsius per decade) in the upper 700 metres of the ocean averaged over lines of latitude for the period 1971-2010 (colours) with average ocean temperature also shown (black contour lines in degrees Celsius). Source: IPCC (2013) Working Group 1 assessment report, Figure 3.1b.
The underestimation of southern ocean heating rate by ocean datasets (for example as illustrated in the Figure above from the 2013 IPCC report) is thought to relate to the sparse historical sampling of the Southern Ocean combined with "conservative" assumptions in which, broadly speaking, heating rates are assumed to be close to zero in the missing data regions. In fact when missing regions are assumed to be warming at similar rates to the surrounding regions, the observational estimates (0.43 Wm-2 heating for 1983-2011) are broadly consistent with the upper estimates from Durack et al. (0.12-0.35 Wm-2*) as mentioned in their reference to the recent paper by Lyman and Johnson (2014).
Durack's results indicate that previous observational estimates of upper ocean heating rate may have been underestimated while sea level rise observations from satellite are more realistic. Although the result is dependent on the realism of simulations used, the discrepancy is plausibly related to the limited number of "ships of opportunity" which sparsely observed the Southern Oceans between 1970 and 2005. This is backed up by the improved agreement for the more recent period since 2005 when the thousands of Argo buoys substantially improved our ability to observed the ocean down to nearly 2000m. The next step in improving on the parallel study by Llovel et al. is to develop the proposed new deep ocean Argo measurement system.
Greater understanding of ocean heating at different depths and in different regions potentially helps in understanding the mechanisms explaining the pause in global surface warming (and periods of more rapid surface temperature rise) relating to variability in ocean circulation. Surface temperature is determined by the heating of the upper layers of the ocean which affect the atmosphere above. Recent research indicates that more heat has been mixing to deeper levels (below 300m depth for example) in the 2000s compared with the earlier period. So more of the heating due to rising greenhouse gas concentrations is being buried below the upper ocean layers, depriving the atmosphere of this extra ocean warmth. Their corrected upper ocean heating rate (0.35 Wm-2* upper estimate for 1970-2004) and Llovel's full ocean heating estimates (0.64 Wm-2 for 2005-2013) are consistent with recent observations indicating continued planetary heating in the 2000s despite slowing in surface warming (our combination of satellite and ocean data indicate a heating rate of 0.47 Wm-2 for the 1985-2012 period and 0.62 Wm-2 for 2005-2012 although with a considerable likely range).
The new estimates of ocean heating rate and resulting sea level rise are consistent with rising greenhouse gas concentrations. The recent slowing in global surface warming instead reflects a change in the vertical distribution of this heating to deeper layers (for example between the upper 300m and the layers below). The improved understanding of ocean heating from the papers by Llovel et al. and Durack et al. may also contribute towards studies using observations to gauge the likely magnitude and rate of future warming in response to the inexorable rise in atmospheric greenhouse gas concentrations.
* to convert from 1022 J/35yr used in Durack et al., I divided by the number of seconds in 35 years (1.1 billion) and divided by the global surface area (5.1x10¹⁴ square metres). So a heating of 20x1022 J/35yr = 0.36 Watts per square metre globally.
Richard P. Allan Location: Department of Meteorology (2U15)
