Atmospheric Observatory metadata
 Meteorological observations have been made almost continuously at the University of Reading (known until 1926 as University College) since 1901. Although records for some of the earlier years have been lost, an almost complete daily record of many elements can be assembled from January 1908 to date. The weather station has occupied two major sites - from 1901 to 1967 on the London Road campus and then at the Whiteknights campus since January 1968 (and at the current site since 1 January 1970). These pages give more details of the current Atmospheric Observatory site together with details of instruments currently and recently in use.
Site details
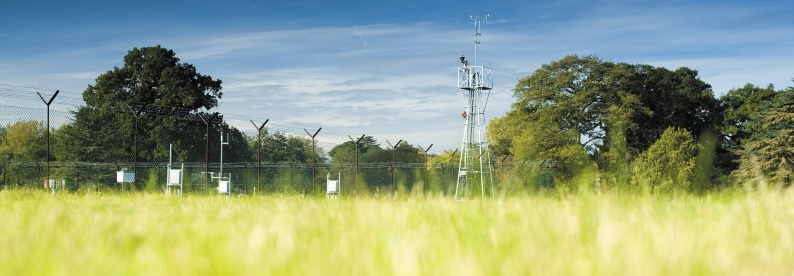
Location 51.441°N, 0.938°W, National Grid Reference (41) 739 719, altitude 66 m above MSL
Observatory metadata
Brief details of measurements made are given in the tabs in this section, organised by the parameter recorded. More detailed technical information and specifications for the sensors in use can usually be found in the manufacturer’s website links, which are given where possible. (Manufacturer-specific product information and links are given solely to provide additional details on the particular sensors in use at the observatory, and should not be inferred as commercial endorsement.) Photographs of the instrument and its siting are given where available. The period of record available is also given by element where known. Calibration details of individual sensors can be found in the 'Calibration data' tab at the end of this section, or on application to the department's technicians.
More information on meteorological instruments and standard observing practices can be found in the following publications, copies of which are available in the department library:
Meteorological Measurements and Instrumentation by Giles Harrison (Wiley, 2014)
The Weather Observer’s Handbook by Stephen Burt (Cambridge University Press, 2012)
There are also further details of certain instruments given in published papers using the data generated - see the Cited references tab for latest information.
There are two types of measurements made:
- ‘Climatological’ – a manual observation made once daily at 0900 UTC, with the values entered in registers by hand. This observation includes ‘eye’ observations of cloud amount and types, present weather, visibility and other elements, as well as manual readings of the thermometers, manual raingauge etc. Almost all climatological observations therefore relate either to the time of the observation itself (i.e. 0900 UTC) or to the 24 hours ending at 0900 UTC. By convention, the maximum temperature and the rainfall read at 0900 UTC are ‘thrown back’ to the previous date. Exceptions are sunshine duration, 'days with' thunder, snowfall, hail etc, mean and maximum gust wind speeds and all solar radiation values, all of which refer to the ‘civil day’ (i.e. 0000-2359 UTC). Some climatological records extend back more than 100 years – for details see the individual element description.
- ‘Automatic’ – regular recording of electrical sensors, at sub-daily frequency. A display of the derived values to the department has been a central aspect, also providing information or data for teaching. Automatic records (sub-daily digital data) commenced for some elements in 1996, other elements more recently: not all of these records are continuous. The three different logging systems which were individually constructed by staff in the department during the period of continuous automatic recording are summarised in Table 2 below. These systems were named after the location of the display – “corrdisp” was the original corridor display system used in the old department buildings at Earley Gate, and “Fidas” – an acronym generated from “Foyer Information and Display System” – was implemented in the Meteorology Building to which the department moved in March 1997. Later, METFiDAS became the acronym, generated from “Meteorology Field Data Acquisition System". A custom data reception room (GU04) was part of the specification for the new building, cabled to a pillar in the entrance foyer to allow a display to be mounted. (An earlier corridor automatic weather system “CAWS” was operational in the early 1990s and used for teaching, but almost no data survives.)
Currently the automatic sensors are polled and logged once per second using a Campbell Scientific CR9000X logger (Table 2). Data are available at 1 s resolution for research purposes, whilst standard ‘meteorological’ output consists of period averages of the polled values in compliance with World Meteorological Organization specifications – for example, wind speeds are normally quoted as 10 minute averages, and wind gusts as the highest 3 second running mean wind speed. Further details are given in Quantities and Units.
A separate self-contained automatic weather station operated by the Met Office was installed within the enclosure in August 2012; this description does not include this equipment. In addition, there are occasional experimental or test instruments located within the observatory which are not described here.
Because of differences in recording methods and instrumental response times, slight differences can occur between ‘climatological’ and ‘automatic’ records. The ‘climatological’ records are subject to quality-control measures and are normally regarded as the definitive value.
Period of record by element
Table 1 summarises the period of record by main element; in all cases, records were made at London Road until 1967 and at Whiteknights from 1968 to date. In a few instances, missing data or incorrect values have been estimated using data from other local observations. The records are not completely homogeneous, in that the current Whiteknights site has less urban influence, and is 20 m higher, than the London Road site and therefore slightly cooler, although careful comparisons have shown that there is no significant difference in the precipitation record.
The full daily observation database and scanned registers are available for research on application to the department; see also One Hundred Years of Reading Weather by Roger Brugge and Stephen Burt, published in 2015. In most cases, a few minor gaps have been estimated from other local observations.
TABLE 1 - Period of record by element
Element |
Record commenced |
Record ceased |
Notes |
|---|---|---|---|
| Precipitation | Monthly totals - 1901 |
Continues | Records missing 1904-1907 (estimated from Forbury Gardens record), together with a few minor gaps in early years |
| Air temperature - daily maximum and minimum temperatures | January 1908 | Continues | |
| Daily climatological observations at 9 a.m. GMT - cloud cover and type, wind direction and speed, present weather, barometric pressure | January 1908 | Continues | |
| 'Days with' thunder, snowfall, snow lying at 0900 UTC, etc | January 1908 | Continues | Snow depth records commenced late 1950 |
| Earth temperatures at 1 ft / 30 cm | January 1908 | Continues | |
| Earth temperatures at 4 ft / 120 cm | January 1908 | December 1971 | |
| Earth temperatures at 5, 10 cm and 20 cm | June 1961 | Continues | |
| Earth temperatures at 50 cm and 100 cm | January 1972 | Continues | |
| Grass minimum temperature | January 1920 | Continues | |
| Daily sunshine duration (Campbell-Stokes recorder) | April 1956 | Continues | |
| Autographic precipitation records (Dines tilting siphon recorder) | November 1960 | Continues | |
| Autographic wind records | January 1968 | Continues | |
| Solar radiation | January 1968 | Continues |
TABLE 2 - Automatic logging record details
Dates |
Logging system | Equipment | Features | Supporting staff |
|---|---|---|---|---|
1 Jan 1997 to 11 Jan 2009 |
corrdisp |
Keithley metrabyte 12 bit logging cards installed in a DOS PC, with radio clock synchronisation. Initially a UHF radio link transmitted serial data to the corridor display (a further DOS PC) in the old building and, initially, to the Meteorology Building. Shortly after the new building was commissioned, a cable link from the Observatory site was installed. Data transmission necessitated a 20 s interruption in the data logging every 5 min. |
|
Hardware: Andrew Lomas Software: Giles Harrison |
8 Aug 2005 to 27 July 2014 |
METFiDAS I | Amplicon 12 bit logging cards and Windows NT PC. Optical fibre link to Meteorology Building allowed mounting of hard disk by operating system, and bi-directional data flow. |
|
Hardware: Andrew Lomas, Rosy Wilson Software: Iain Russell |
| METFiDAS II | METFiDAS II followed as a back-up running alongside the original and eventually taking over. Software for this used National Instruments LabVIEW, and was written by Iain Russell | |||
30 Aug 2014 to date |
METFiDAS3 | Campbell Scientific CR9000X data logger | Level 0 and Level 1 data - Andrew Lomas and Rosy Wilson Level 2 data - Roger Brugge |