Global weather pointers
Note that the author knows that this page is in need of an overhaul; however, there are not enough hours in the day!
Contents
CDC Map Room Climate ProductsTabulated monthly summaries
Climatological; normals
Global/hemispheric charts
Analysis charts
Surface
500 mb
250 mb
Forecast charts
500 mb
Flight level information
Volcanic Ash
Global satellite composite
Coded data, eg SYNOP reports, etc
Global climate summaries
CDC Map Room Climate Products- Atmospheric Angular Momentum
- vertical+zonal, and global, integrals of relative atmospheric angular momentum
-
Global Windfield Mode; wind EOF products
- Sea Surface Temperature;
- includes recent actual values, anomalies, Hovmoller plots, and predictions
- Outgoing Longwave Radiation (OLR)
- includes recent actual values, anomalies and Hovmoller plots
- Global Circulation and Anomalies
- weekly, monthly, seasonal and Hovmoller plots of 250 mb wind anomaly, surface wind anomaly, 500 mb height anomaly and surface temperature anomaly Storm Tracks and other High Frequencies
- Weekly Ocean Analyses
- Hovmoller ocean current plot, connections to TOGA-TAO page
- Global Data - searchable index by month and year (from 1990 onwards)
- [US National Climate Data Center]
- Global monthly climatology
- [Hong Kong Observatory]
- Global 1961-90 mean monthly climatology
- [UEA Climatic Research Unit]
- Normals for many places and periods - searchable index
- [Buttle and Tuttle Limited]
- Climatological Averages for the British Isles
- [Roger Brugge]
- Canadian ecodistrict climatological normals, 1961-90
- [Agriculture and Agri-Food Canada]
Global/hemispheric charts
- A wide variety of analysis and forecast charts
- [US National Weather Service]
Surface analysis charts
- Northern hemisphere (Atlantic) analysis 0-90W Prelim four times daily at 00Z, 06Z, 12Z, and 18Z
- [US National Weather Service]
- Northern Hemisphere (Pacific) analysis 100W-80E Prelim four times daily at 00Z, 06Z, 12Z, and 18Z
- [US National Weather Service]
- Surface analyses
- [US Climate Diagnostics Center]
500 mb analysis charts
- 500 MB Height & Temperature 00Z Analysis, Polar Stereographic Northern Hemisphere
- [US National Weather Service]
250 mb analysis charts
- 250 mb analyses
- [US Climate Diagnostics Center]
500 mb forecast charts
- NMC ensemble forecasts for both hemispheres, up to 15 days ahead
- [CDC/NMC]
Flight level information forecast charts
- see also Aviation weather
- Wind/Temp plot 18 hr Prog (FL 180) (N Hemisphere 94W-114E)
- [US National Weather Service]
- Wind/Temp plot 24 hr Prog (FL 180) (N Hemisphere 94W-114E)
- [US National Weather Service]
- Wind/Temp plot 18 hr Prog (FL 240) (N Hemisphere 94W-114E)
- [US National Weather Service]
- Wind/Temp plot 24 hr Prog (FL 240) (N Hemisphere 94W-114E)
- [US National Weather Service]
- Wind/Temp plot 18 hr Prog (FL 300) (N Hemisphere 94W-114E)
- [US National Weather Service]
- Wind/Temp plot 24 hr Prog (FL 300) (N Hemisphere 94W-114E)
- [US National Weather Service]
- Wind/Temp plot 18 hr Prog (FL 340) (N Hemisphere 94W-114E)
- [US National Weather Service]
- Wind/Temp plot 24 hr Prog (FL 340) (N Hemisphere 94W-114E)
- [US National Weather Service]
- FL340 Aviation winds Northern Hemisphere 24hr forecast
- [US National Weather Service]
- Wind/Temp plot 18 hr Prog (FL 390) (N Hemisphere 94W-114E)
- [US National Weather Service]
- Wind/Temp plot 24 hr Prog (FL 390) (N Hemisphere 94W-114E)
- [US National Weather Service]
- Wind/Temp plot 18 hr Prog (FL 450) (N Hemisphere 94W-114E)
- [US National Weather Service]
- Wind/Temp plot 24 hr Prog (FL 450) (N Hemisphere 94W-114E)
- [US National Weather Service]
- Sig Weather Chart 12 HR FCST Europe & Asia FL 250-630
- [US National Weather Service/RAFC London]
Volcanic Ash forecast charts
- Volcanic Ash Northern Hemisphere 24 hr forecast [part 1] when available
- [US National Weather Service]
- Volcanic Ash Northern Hemisphere 24 hr forecast [part 2] when available
- [US National Weather Service]
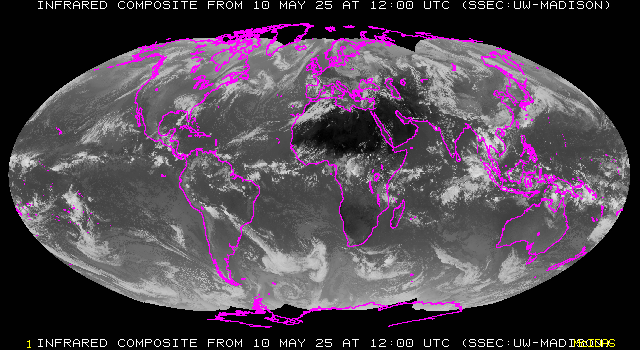
Global satellite composite images
Coded data, eg SYNOP reports
- Global data
- [UCSD]
Last updated 11 December 2007. © 2001-2008 Roger Brugge