
February 2015:
Detecting the rising anthropogenic greenhouse effect at the surface
An enhanced greenhouse effect of rising atmospheric concentrations of carbon dioxide and methane due to human activities has previously been detected from space by Harries et al. (2001) Nature, yet it is surprisingly problematic to do the same at the surface. This is because much of the additional downward emission of infrared heat emitted by the extra greenhouse gases are intercepted by cloud and, in particular, gaseous water vapour in the lower atmosphere. A new analysis by Feldman et al. (2015) Nature is the first to accurately and directly detect this small (0.2 Wm-2 per decade) yet cumulative heating effect relating to anthropogenic carbon dioxide increases.
Previous studies over Europe have inferred comparable increases in surface anthropogenic greenhouse gas radiative forcing of 0.35 Wm-2 over the 8 year period 1995-2002 (Philopona et al. 2005: doi:10.1029/2005GL023624) but this was only an indirect measure with considerable uncertainty since the effects of the air temperature and humidity on infra-red radiation had to be removed using a simple modelling approach. Importantly, most of the increase in downward infrared radiation at the surface globally is explained by rising air temperatures and moisture, a response to the greenhouse gas heating.
While the new study is a useful confirmation of what is expected from physics and observations, the results of the study are not applicable globally, since two relatively dry locations are considered; it is doubtful that a detectable signal would be present at the surface in the wet tropics where there is copious water vapour and cloud. The detection of the natural seasonal cycle of the direct carbon dioxide surface radiative forcing appears quite novel however (see figure); it is not clear to me why there is an apparent increase in the amplitude of the CO2 surface forcing seasonal cycle during the period. The authors attribute this to a reduction in the number of data outages from 2004 onwards but another explanation could be the observed cooling and drying during the period, in particular during the winter and Autumn, which may allow the CO2 signal to become more prominent.
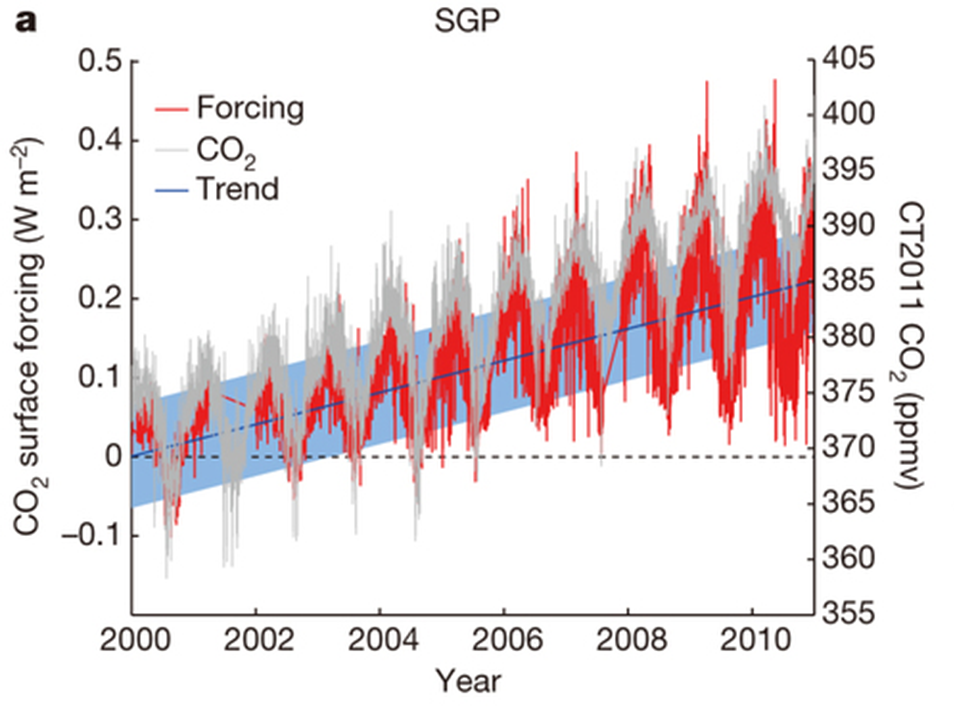
Above: Time series of observed spectrally integrated (520-1,800 cm-1) CO2 surface radiative forcing at the Southern Great Plains site (in red). These were generated by differencing spectral measurements from the simulations which use observed atmospheric temperature and humidity leaving the residual "forcing" from CO2. Note periods of missing data in 2001 and 2007 in which the red line appears to be interpolated across the gap rather than denoting measurements. Overlaid are CT2011 estimates of CO2 concentration from the surface to an altitude of 2 km (grey), and a least-squares trend fit of the forcing and its uncertainty (blue).
In fact most of the heat trapped by rising greenhouse gases is actually initially deposited high up in the atmosphere (the radiative forcing of rising greenhouse gas concentrations are defined at the tropopause, a layer around 10-15km in altitude). It is mainly through adjustments in cloud, precipitation and surface evaporation, rather than direct infra-red emission, that the energy is transferred to its ultimate resting point, the oceans, which absorb around 90% of any excess energy arriving in the climate system (see references on the DEEP-C website). Satellite and ocean observations show that heat has continued to accumulate over the past 15 years, despite a slowing in surface warming (e.g. Allan et al 2014 doi:10.1002/2014GL060962) due to the inexorably rising atmospheric concentrations of greenhouse gases due to human activities.
Richard P. Allan Location: Department of Meteorology (2U15)
