Menu
Shear effects in mountain wave drag
Mountain wave drag must be parametrized in weather and climate prediction models. However, the impact of shear on the surface drag exerted on mountains, as well as on the vertical distribution of the drag exerted on the atmosphere, is currently either neglected or treated very crudely (Teixeira 2014).
Teixeira et al. (2004) assessed shear effects on the surface drag for the idealized wind profiles presented in Figure 1. In profile 1 the wind is unidirectional and varies linearly, in profile 2 one of the wind components varies linearly while the other is constant, leading to directional shear. Finally, in profile 3, the wind has constant magnitude and turns at a constant rate with height, also having directional shear. These 3 wind profiles are characterized by a constant Richardson number (Ri).
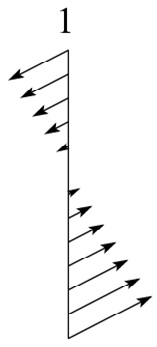
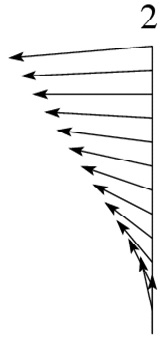
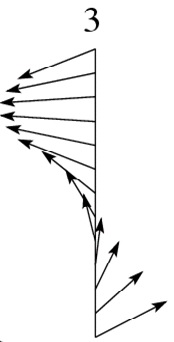
Figure 2 shows the drag exerted on an axisymmetric mountain calculated from linear hydrostatic theory for these wind profiles, normalized by its value for a constant wind, as a function of Ri. These calculations handle shear effects using a 2nd order WKB approximation. Comparison between the solid lines in Figure 2 (left and right), corresponding to wind profiles 1 and 3, respectively, and numerical simulations of the same situation shows very good agreement.
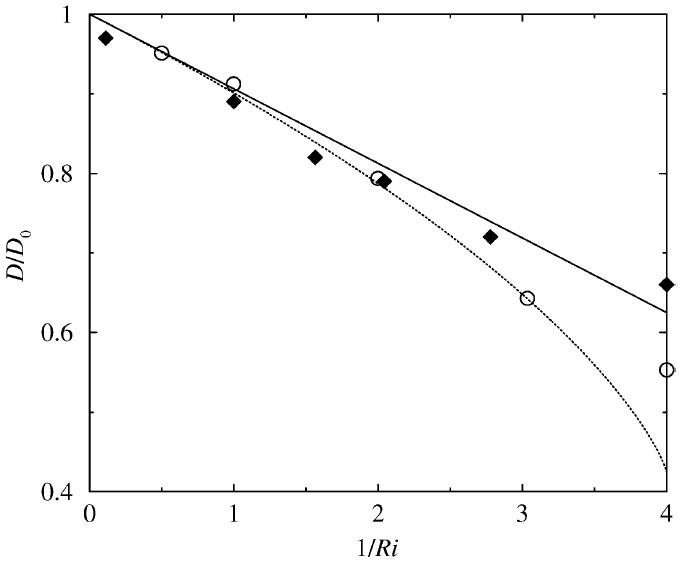
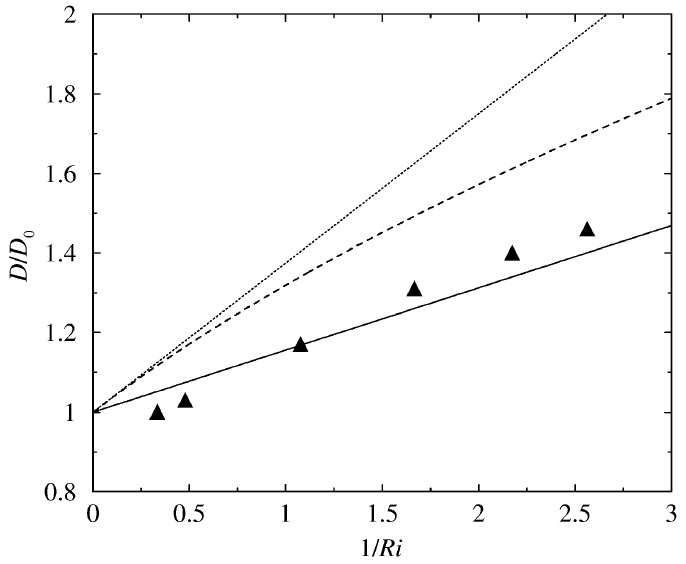
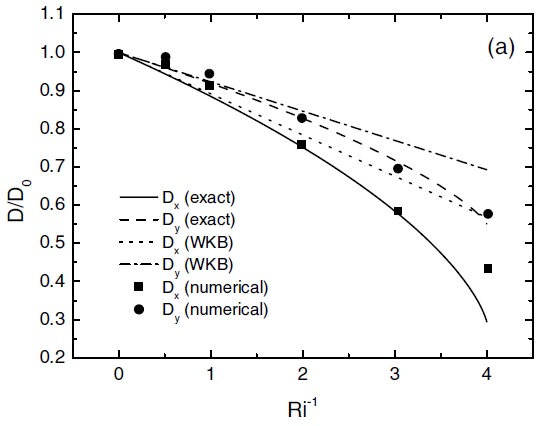
Figure 3 shows similar results, but for flow over a mountain with an elliptical horizontal cross-section (similar to those used to represent the sub-grid scale orography in the UK Met Office and ECMWF drag parametrization schemes). It can be seen that the drag is more affected by shear when the flow is across than when it is along the mountain at the surface. Agreement with numerical simulations is better for wind profile 1 than for wind profile 3, especially at low values of Ri.
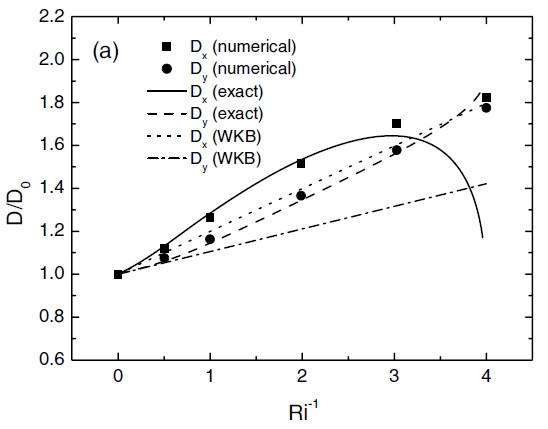
The drag exerted on the atmosphere is determined by the divergence of the momentum flux produced by the mountain waves. Profiles of the two components of the momentum flux for wind profile 2 are presented in Figure 4. It is clearly important to account for the effects of shear not only on the surface drag but also on the momentum flux, as shown by the good agreement between the results based on WKB theory and the small amplitude numerical simulations with Nh0/U0=0.01.
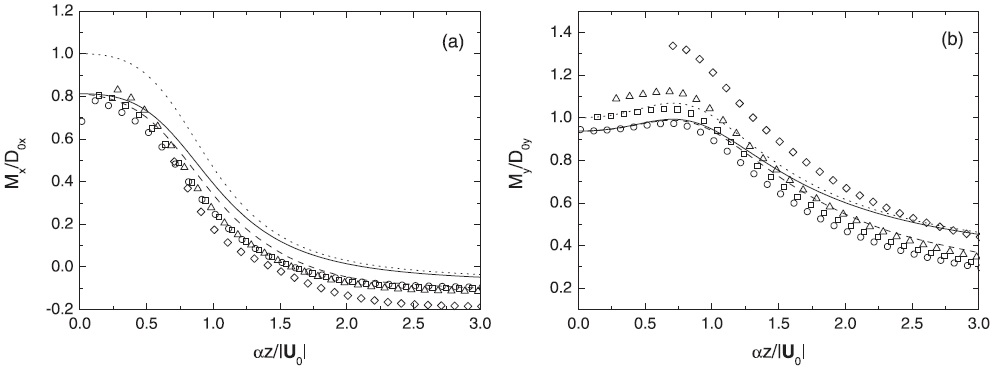
Figure 5 shows the same, but for wind profile 3. Although the agreement is not as good as in Figure 4, especially for the component of the momentum flux perpendicular to the surface wind (My), there is a clear improvement relative to the infinite-Ri approximation, especially for Mx.
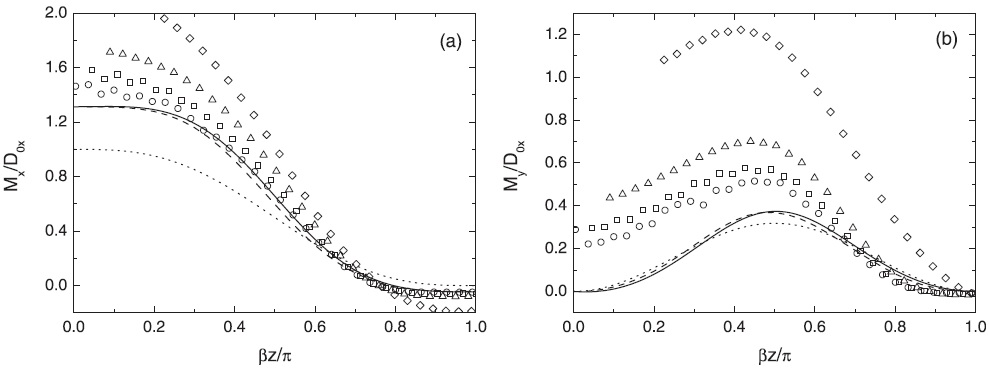
Figure 6 (from Teixeira and Yu 2014) shows the momentum fluxes produced by mountain waves from linear theory with and without the WKB approximation, for a situation similar to that of Figure 4, except that the mountain has an elliptical horizontal cross section with an aspect ratio of 2. In the case displayed, the flow is across the mountain at the surface. Again, agreement, even for this low value of Ri, is quite satisfactory, showing that the WKB approximation is acceptable.
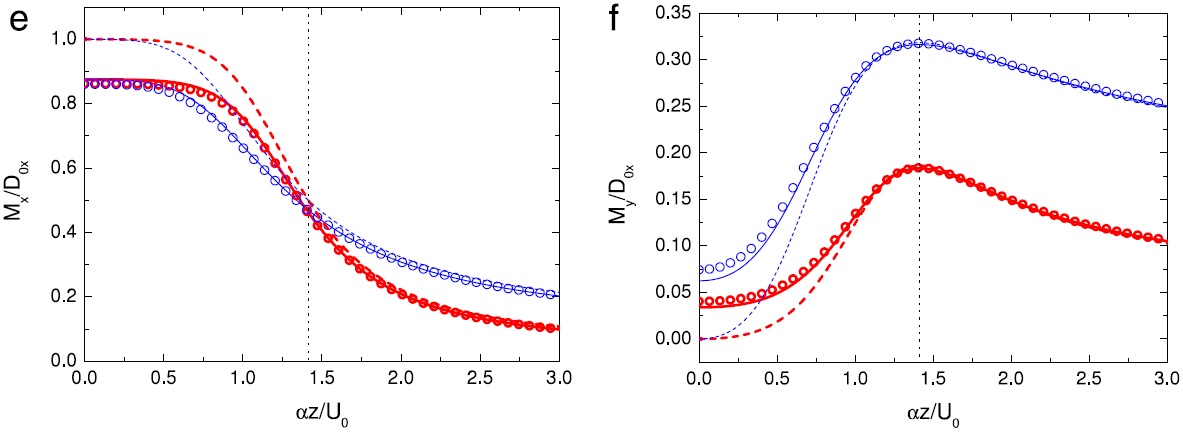
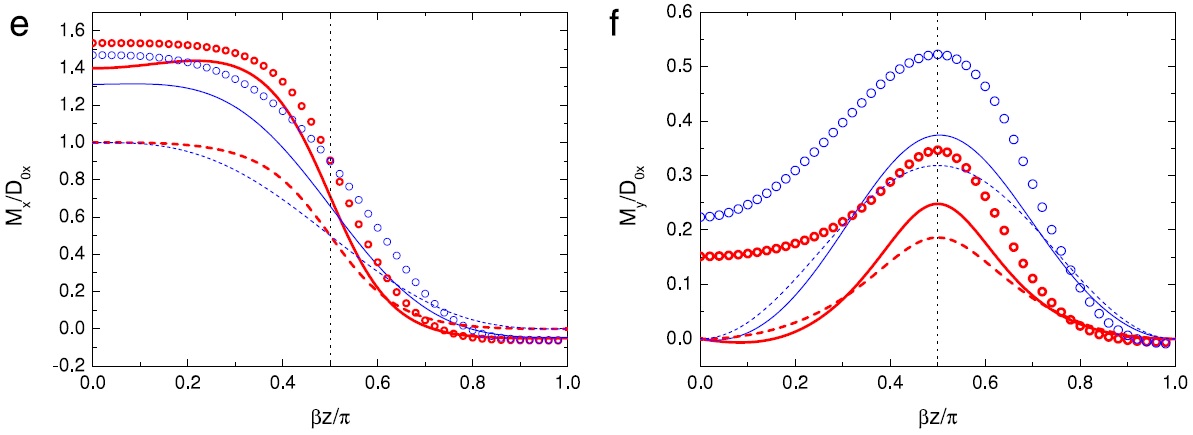
Figure 7 shows the same as Figure 6, but for wind profile 3. Clearly the agreement degrades somewhat for this low value of Ri, but the WKB theory still provides a large improvement relative to the infinite-Ri approximation. These results for elliptical mountains are especially relevant for parametrization because the real global orography is represented in the ECMWF and UK Met Office drag parametrizations as a superposition of elliptical mountains with different heights, widths, aspect ratios and orientations.
Further contributions to the improvement of drag parametrizations through a derivation of the drag dependence of key flow parameters for idealized settings (in particular regarding trapped lee waves, which typically are not represented in drag parametrizations) were given by Teixeira et al. (2017) and Teixeira and Miranda (2017), as detailed in sections "Downslope windstorms" and "Trapped lee waves and rotors".
Figure 8 (from Miranda et al. 2009) shows the distribution of surface drag and its correction due to shear effects from offline calculations averaged for the period 1992-2001, with topography data based on the ECMWF idealized orography used in the drag parametrization scheme and meteorological data taken from ERA-40 Reanalysis. It can be seen that corrections due to wind profile effects are predominantly positive globally, with the largest contribution coming from Antarctica.
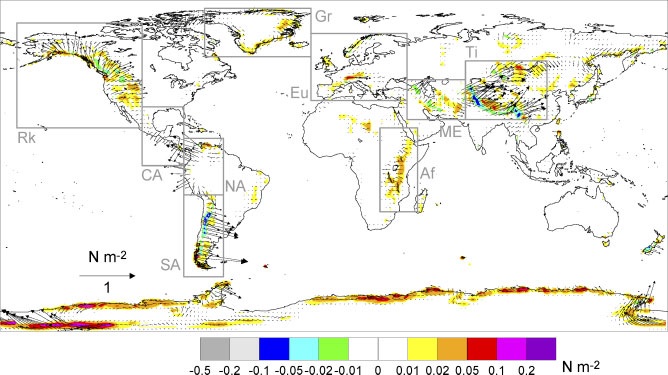
Miranda et al. (2009) evaluated the shear corrections to the drag using the derivatives of the winds from reanalysis taken at a height between one and two standard-deviations of the orography variability within each model grid box, as is currently done for calculating the wind and stability used in the formula for the drag without shear effects. It is not obvious that this is the best height for the present purpose.
The PhD student Holly Turner explored the effect of assuming a height immediately above the boundary layer to evaluate these derivatives (paper in preparation, to be submitted soon). As a preliminary test, the behaviour of the Richardson number was investigated globally at that height, so get a first estimate of the importance of shear effects.
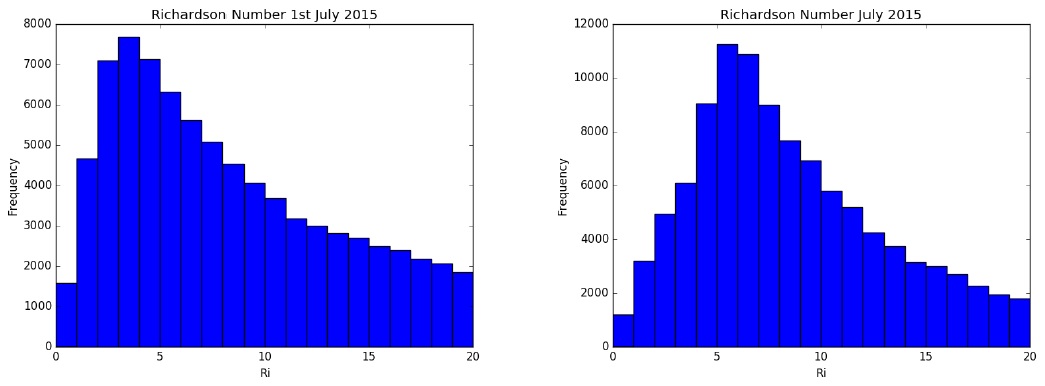
Figure 9 shows histograms of the value taken by Ri immediately above the boundary layer top for the whole globe over the indicated period. This period is of 1 day on the left panel, and 1 month on the right panel. The modal value of Ri is about 6 over a period of a month, but only 4 over one day. This highlights the importance of short time-scale variability on the occurrence of low values of Ri (which are potentially relevant for drag enhancement or reduction by shear effects).
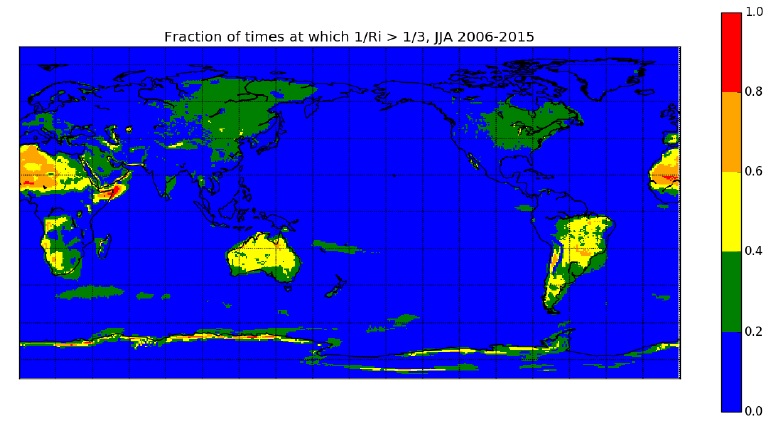
Figure 10 shows the global distribution of low Ri values over a 10 year period, for Southern Hemisphere winter. While there are reasonably low Ri values over some continental areas (e.g. the Sahara desert, central Australia, parts of South America), these are suspected not to be totally reliable due to the diagnostic used for the boundary layer height in ERA-Interim. In Antarctica, where the boundary layer is very thin during winter, and perhaps more reliable, Ri tends to be consistently low during the winter months.
These results are currently being extended and refined, and a publication is due to be submitted in the next few months reporting on this work.