Menu
WESCON Doppler lidar quicklooks
Here are quicklooks of the Doppler lidar and sonic anemometer data from Chilbolton over the WESCON field campaign - all campaign days now available!
NOTE: The BL classification shown in panel (a) is still under development so may change.
Full details of how the backscatter, vertical velocities and data from the sonic are processed to determine boundary-layer classification, aerosol height, cloud base height, surface sensible heat flux, vertical velcoity variance and skewness can be found here.
More details about the instrument and the Chilbolton Observatory can be found here.
More details about the WESCON field campaign can be found here.
|
|
WESCON period summary plots
Boundary-layer classification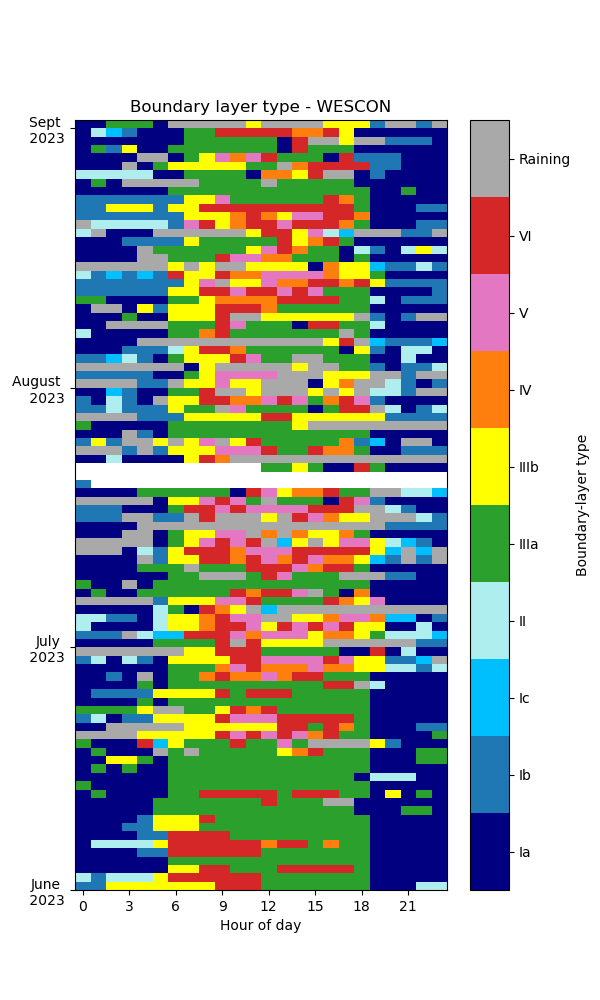
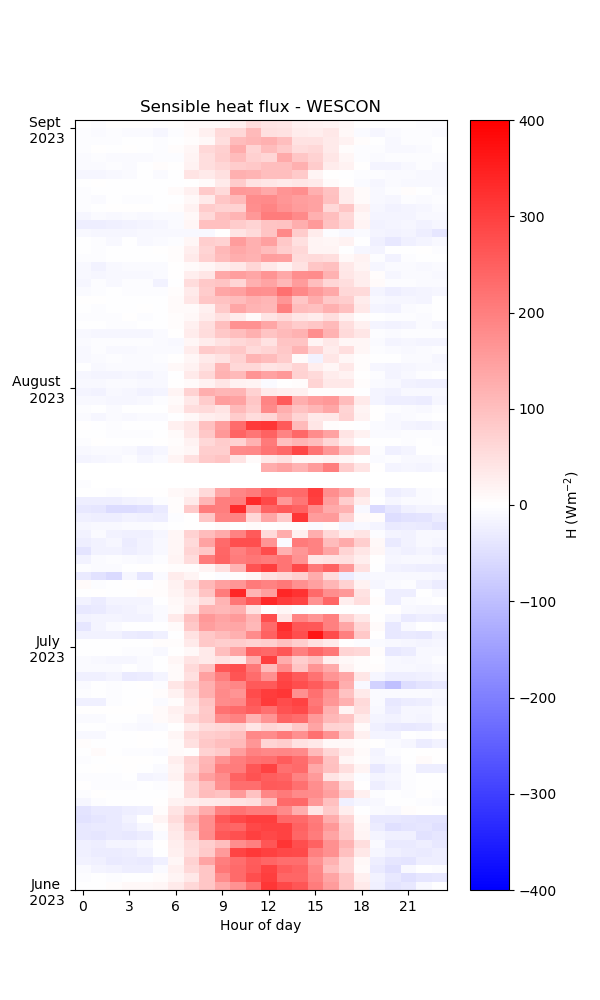
Sensible heat flux
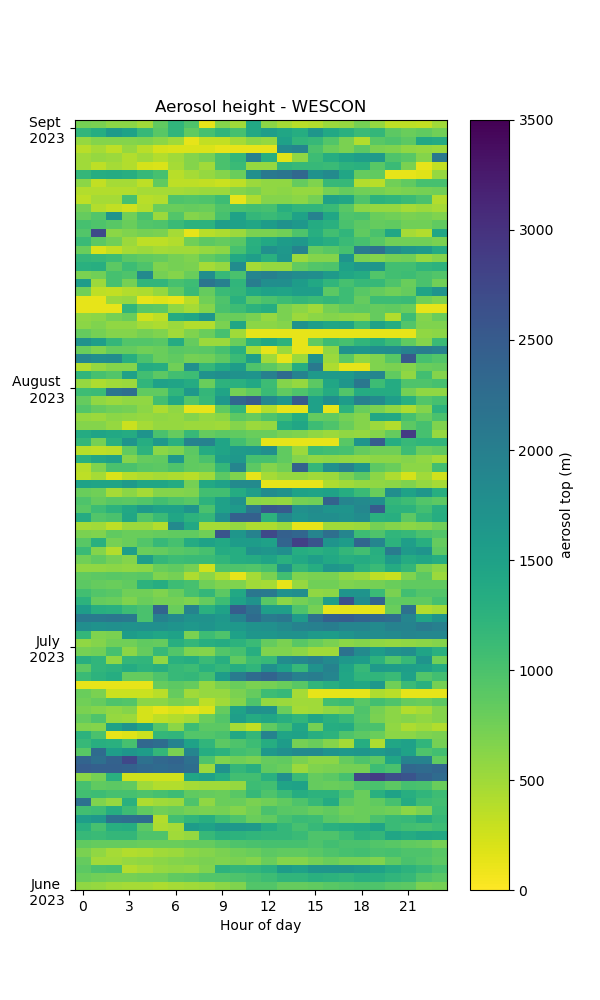
Aerosol height
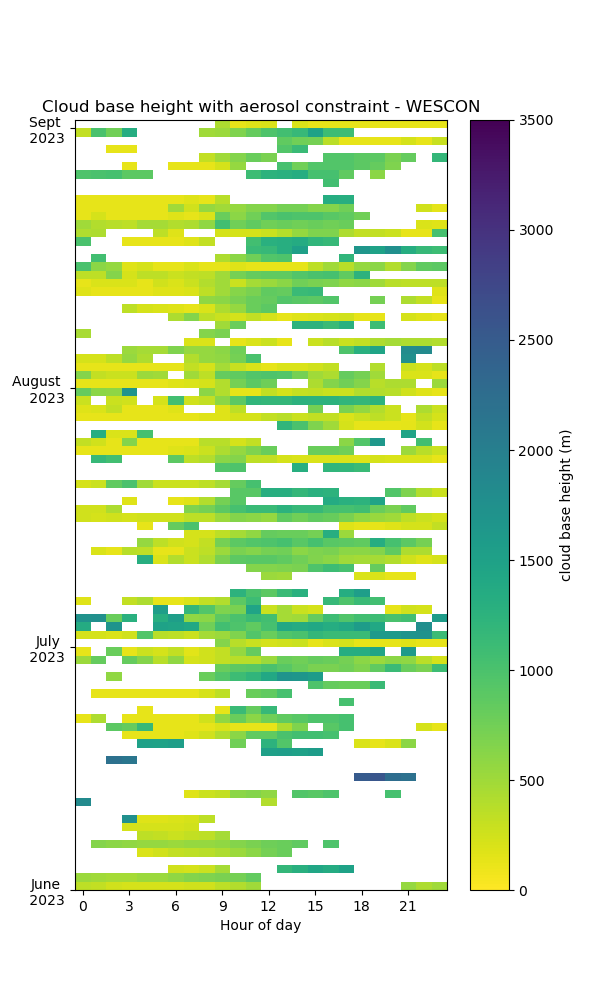
Cloud base height (within aerosol layer)
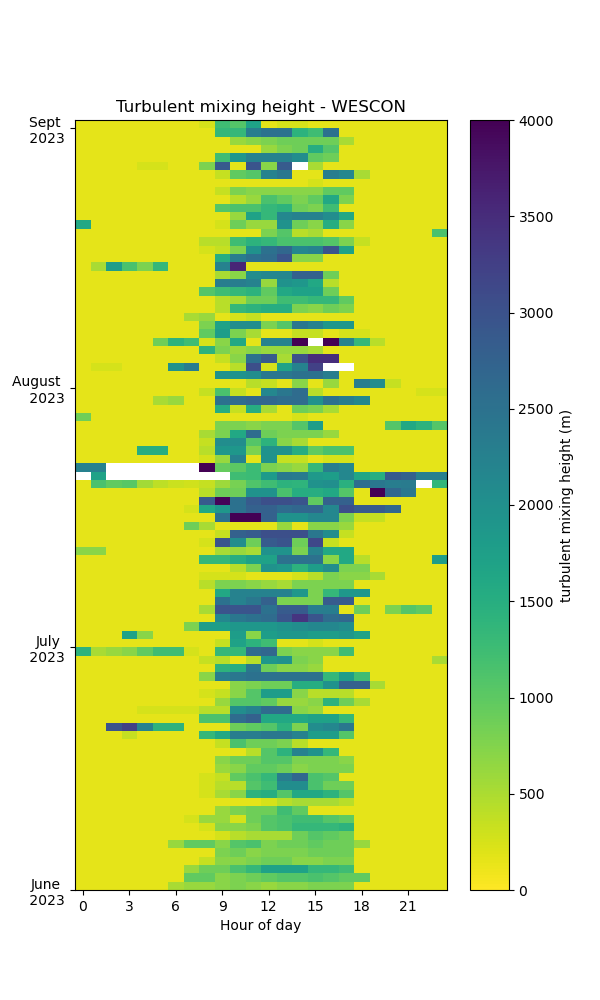
Turbulent mixing height