Data: HadCRU 4.6 temperature anomaly from the 1961-1990 reference period. Data have been annually averaged with no minimum coverage requirement (i.e. 1 month of data can in principle result in an annual mean).
Maps of temperature anomaly
Click for full size and download.
Warming stripes for different longitudes
(Accounting for cos(lat) effect when computing means)
Click for full size and download.
Warming stripes for different latitudes
Click for full size and download.
Hovmeuller diagram (latitude versus time, longitudinally averaged)
Click for full size and download.
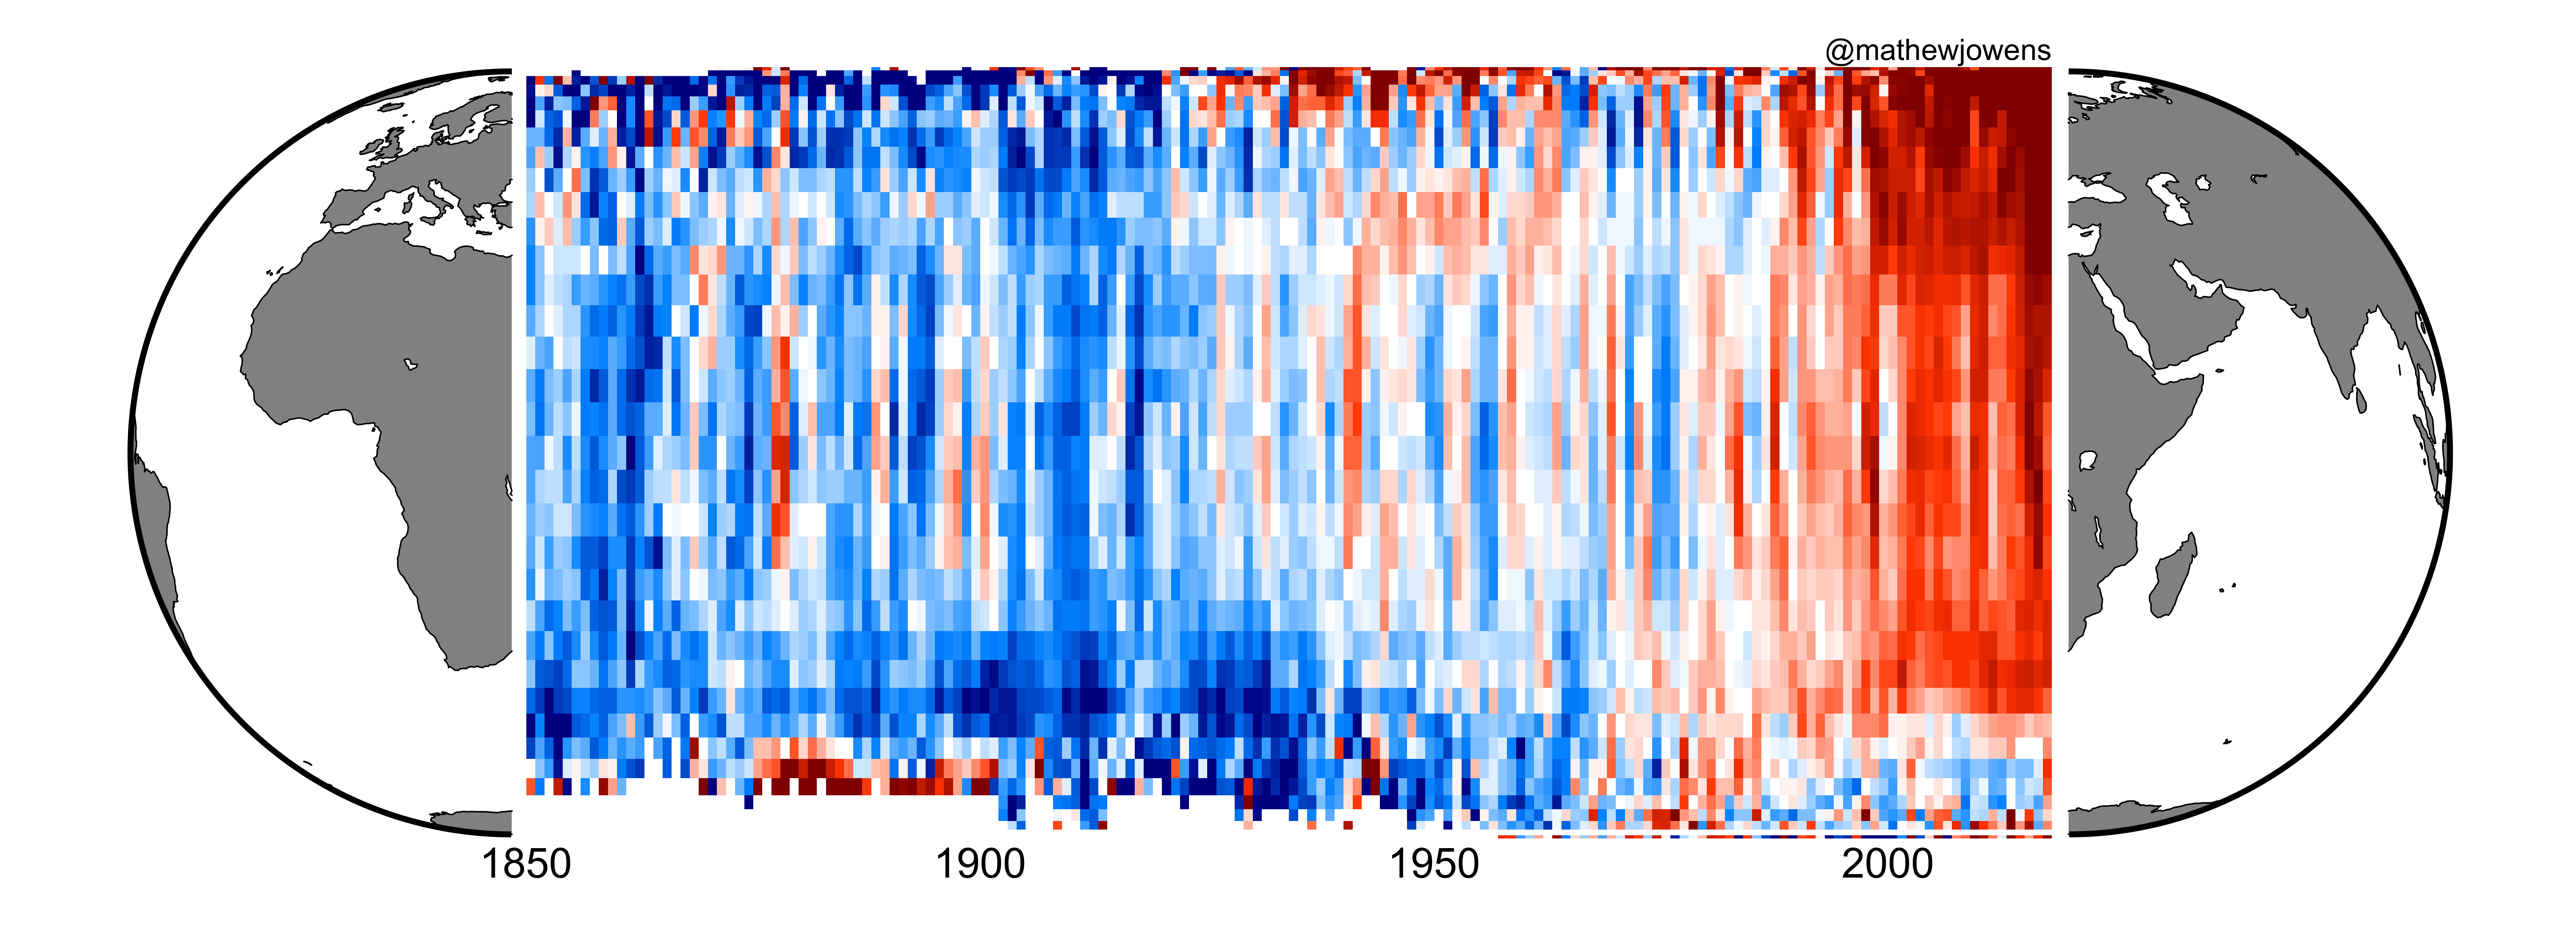
Hovmeuller diagram (longitude versus time, latitudinally averaged)
(Accounting for cos(lat) effect when computing means)
Click for full size and download.