Navigation

  • index
  • cf-plot 2.4.8 documentation »

cf-plot galleryΒΆ

_images/fig1.png _images/fig4.png _images/fig7.png _images/fig12.png

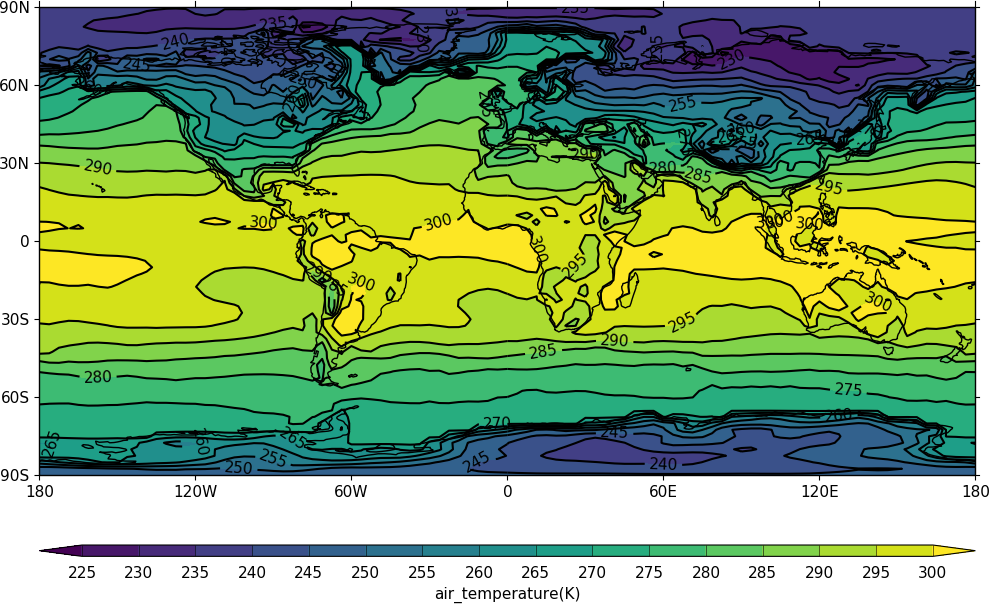
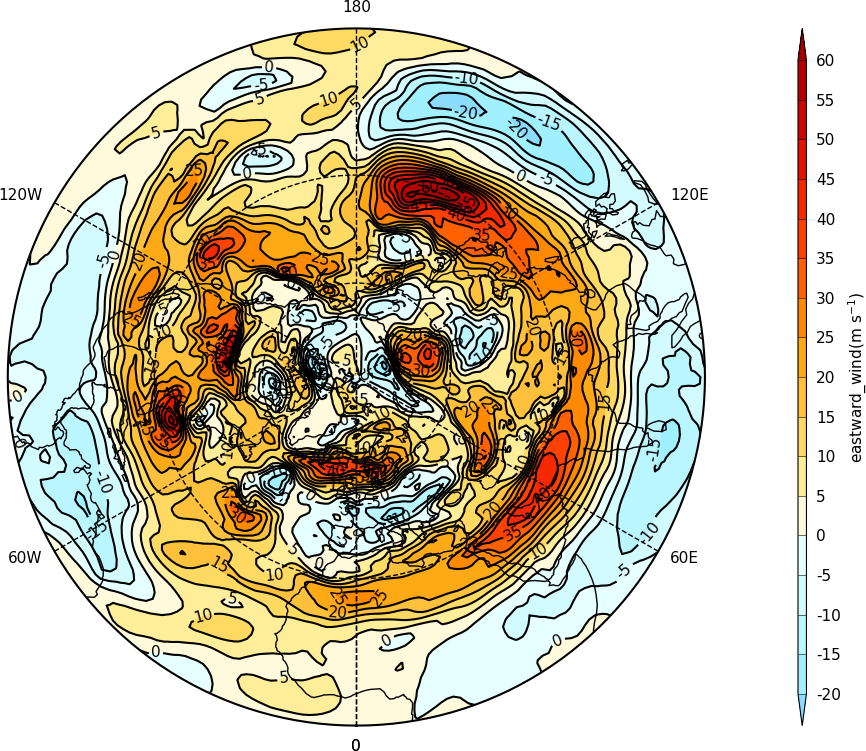
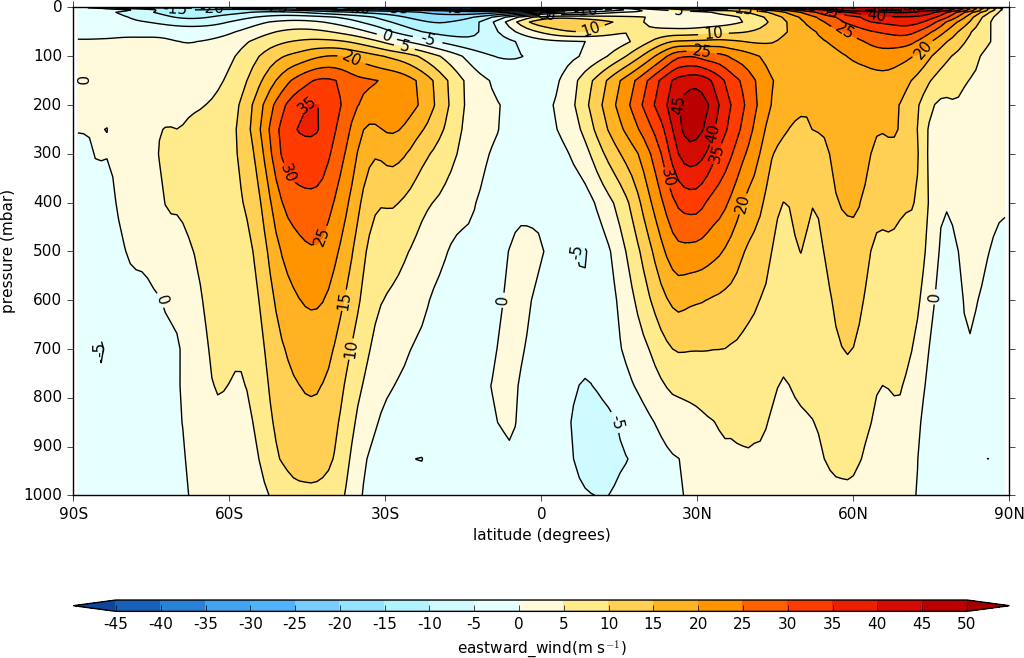
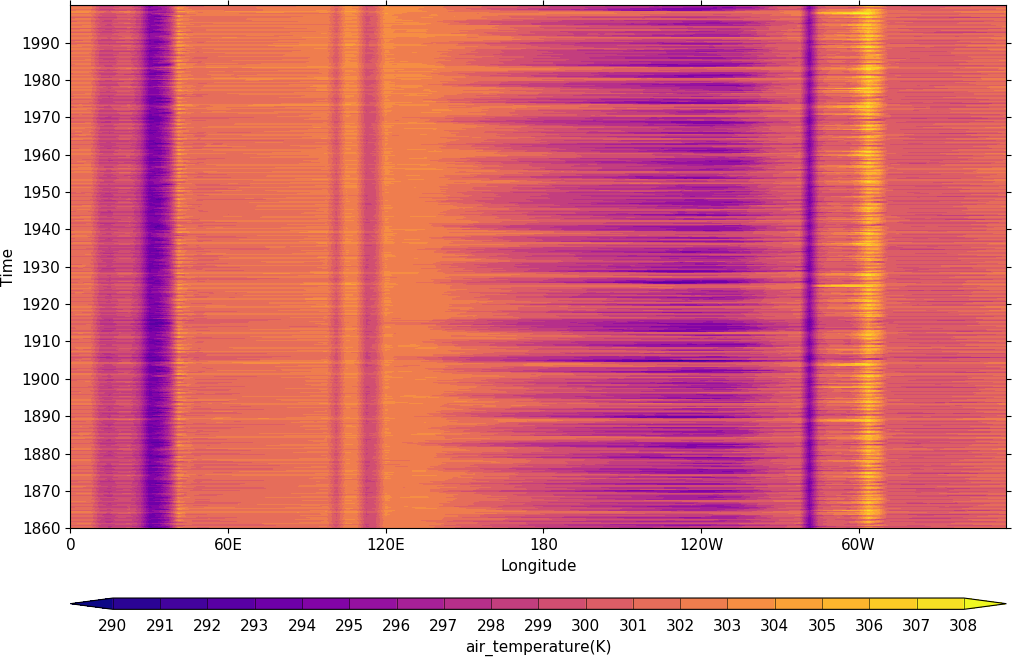
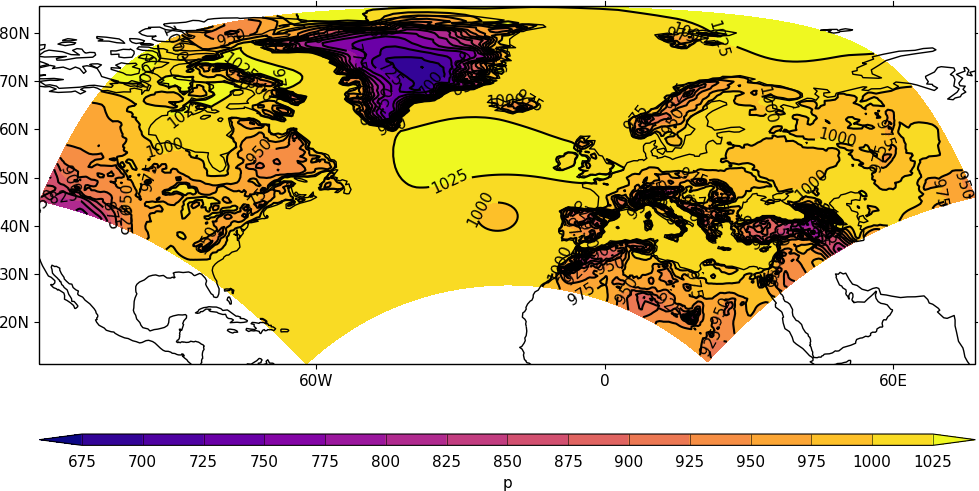
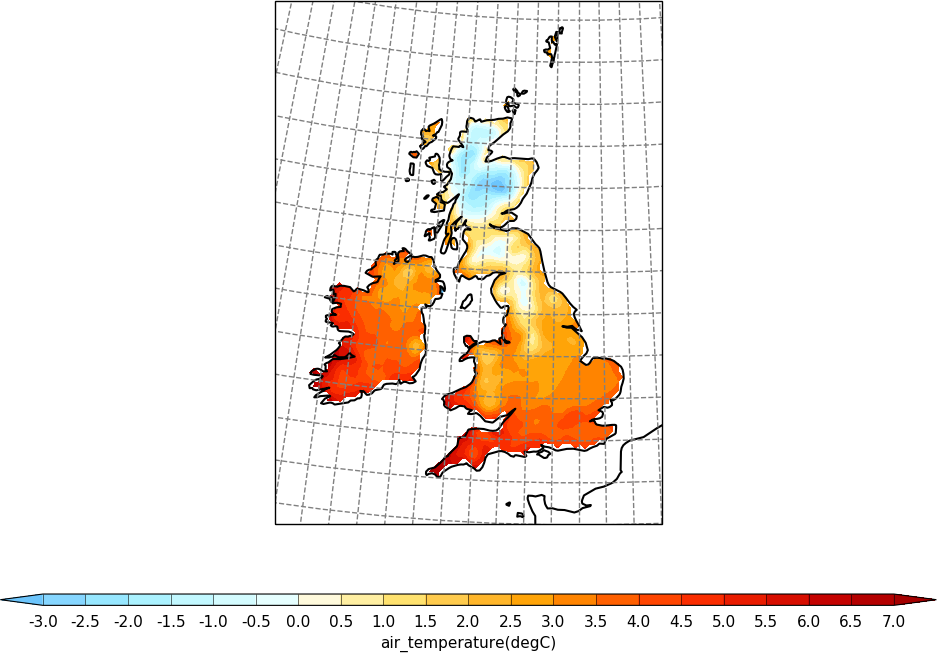
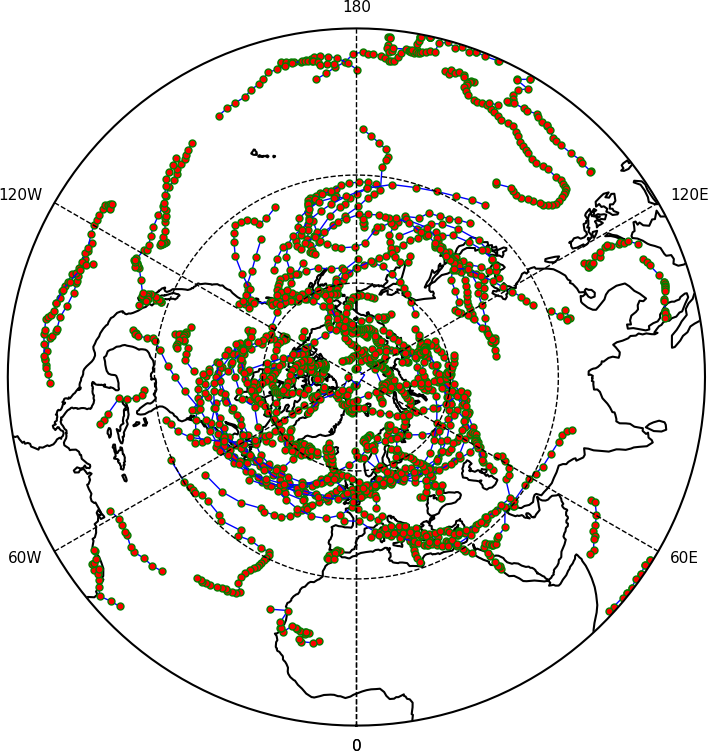
Cylindrical projection | Polar stereographic | Latitude/longitude - height | Hovmuller

_images/fig13.png _images/fig17.png _images/fig19.png _images/cscale.png

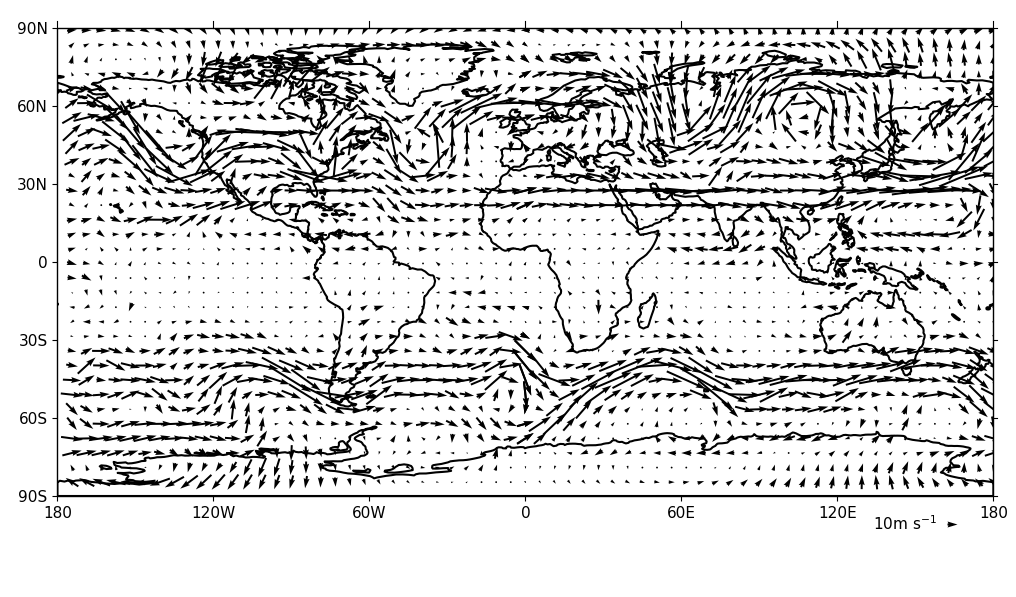
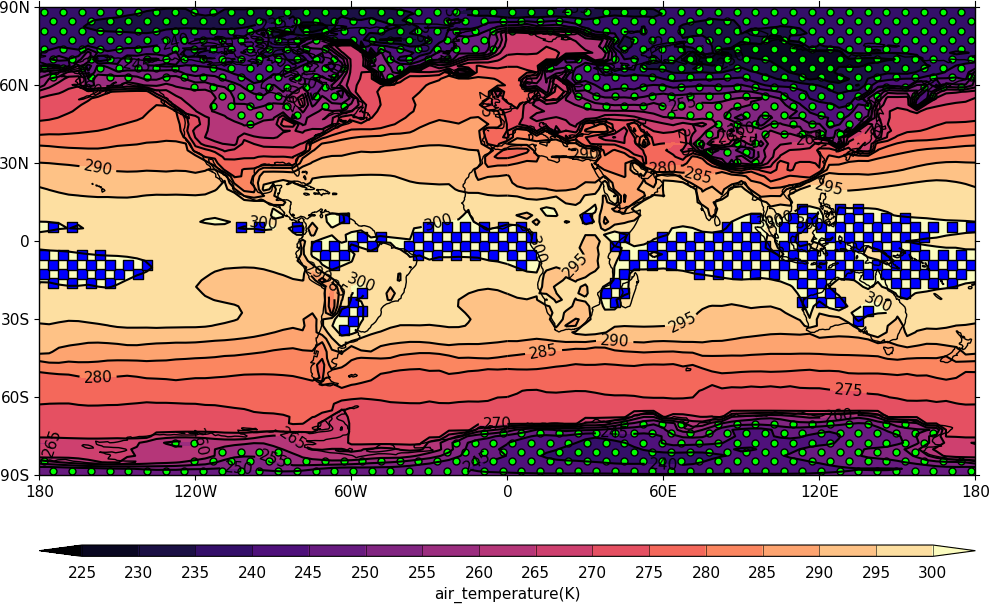
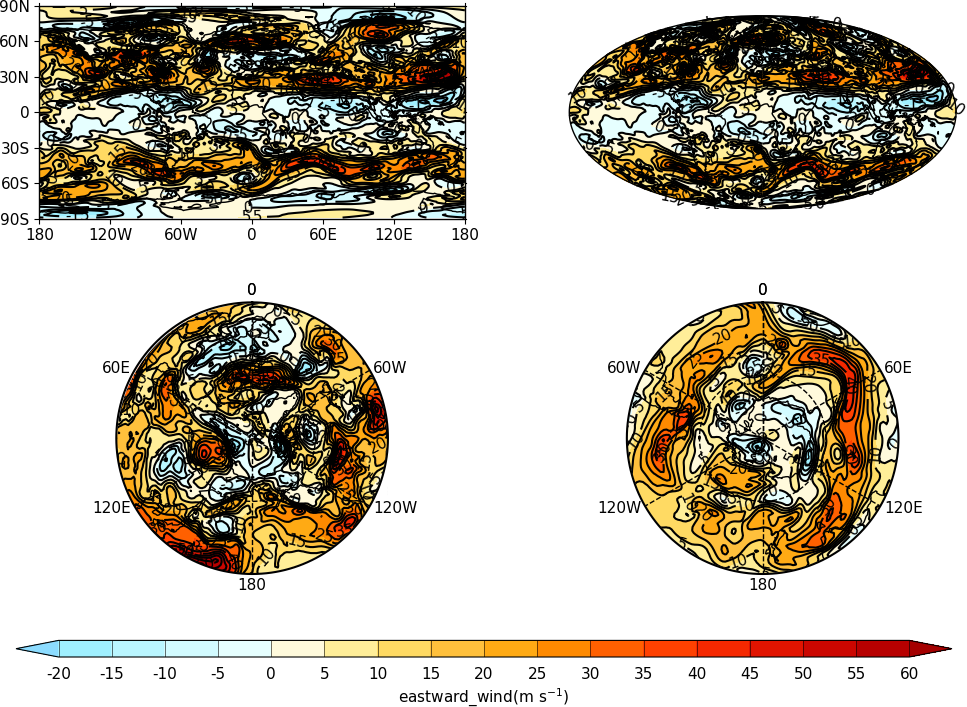
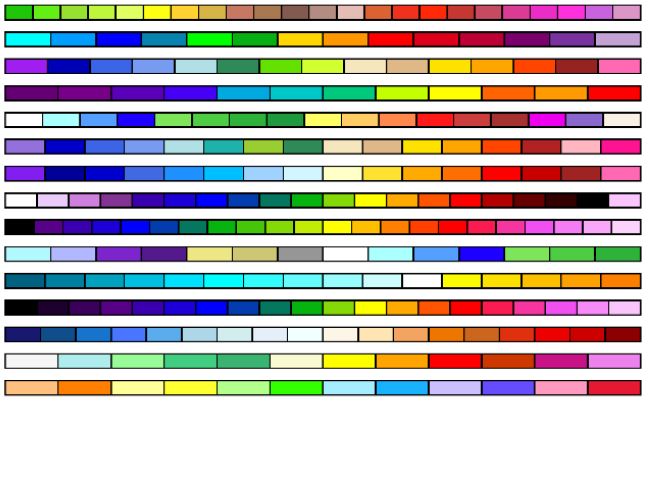
Vectors | Stipple (significance) | Multiple plots on a page | Colour scales

_images/fig20.png _images/fig21.png _images/fig24.png _images/fig28.png

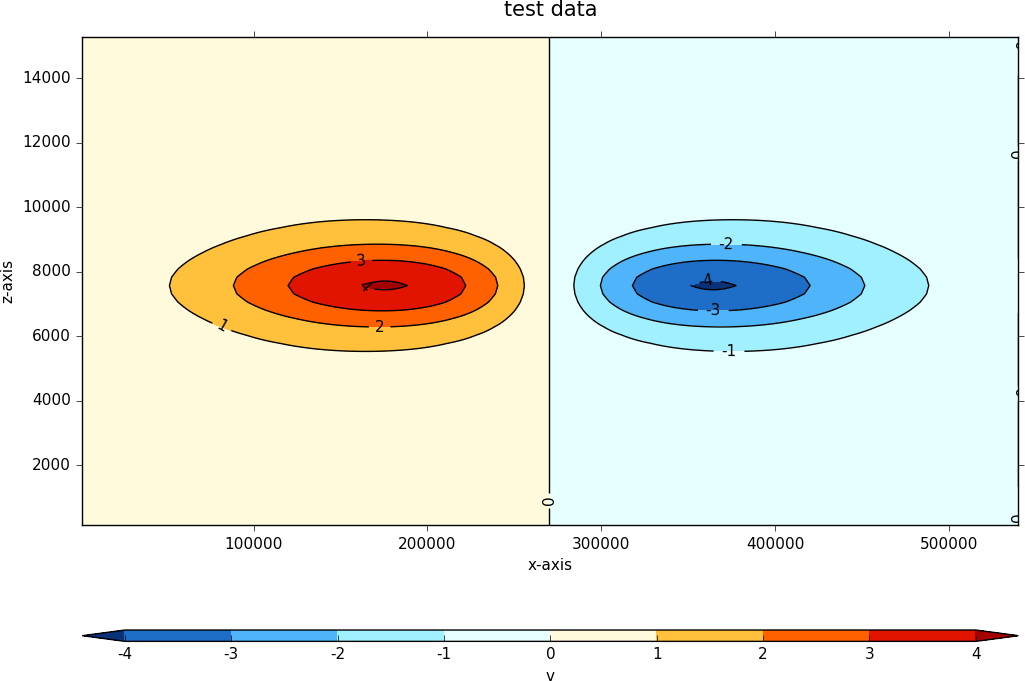
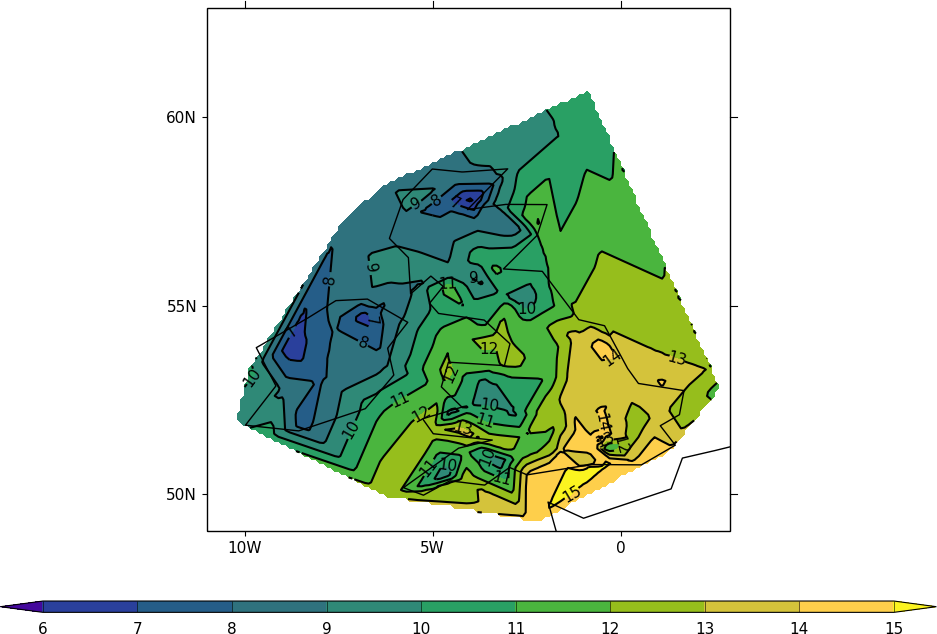
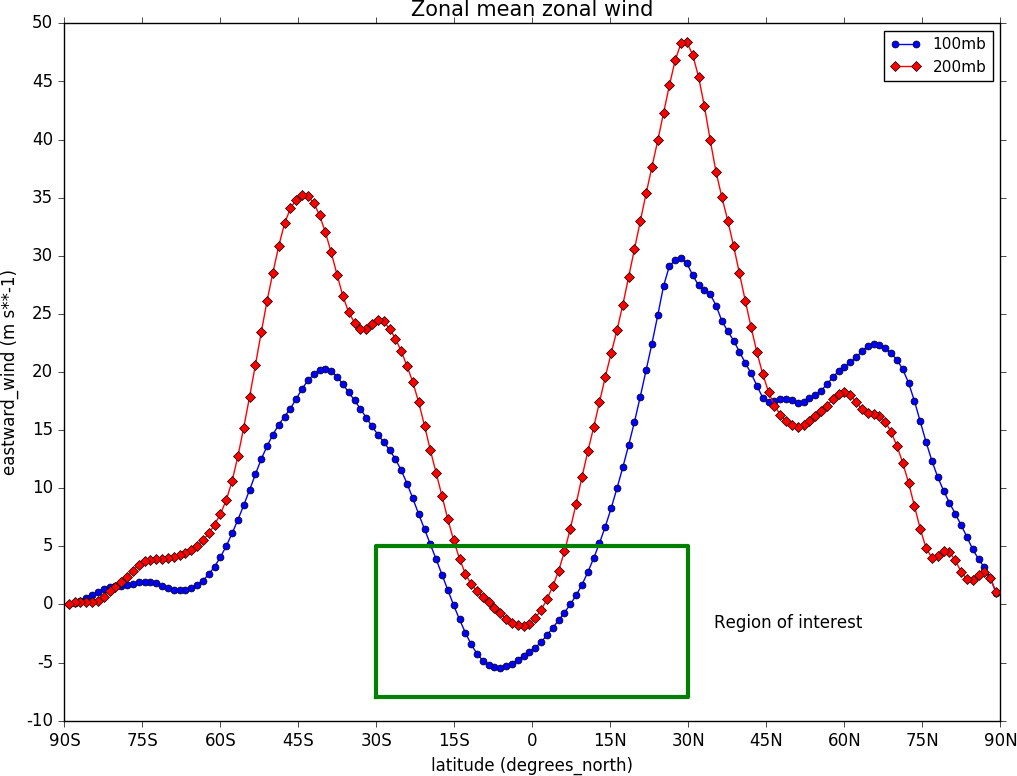
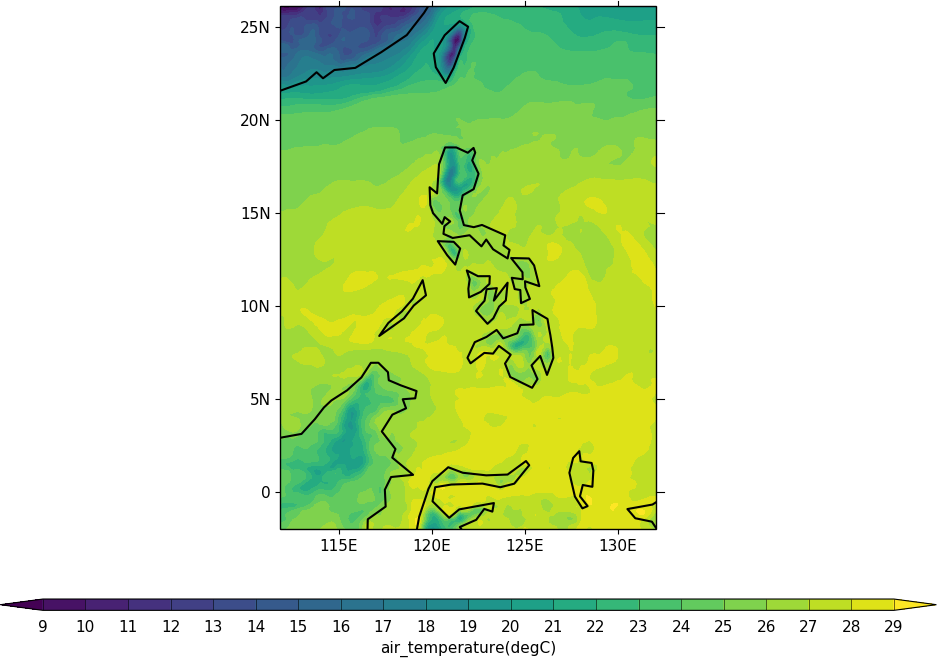
User defined axes | Rotated pole | Irregular grids | Graphs

_images/fig31.png _images/fig40.png _images/fig43.png

Projections | Trajectories | WRF data

Homepage

Gallery

User Guide

Training material

Data input

Routines

Routines - internal

Advanced Use

Versions

Issues

Download/Install

License

Search

Older documentation

Navigation

  • index
  • cf-plot 2.4.8 documentation »
© Copyright 2019, Andy Heaps. Created using Sphinx 1.7.4.