Menu
See also
This page has a selection of data and figures I've generated from the University of Reading
Atmospheric Observatory
about the unprecedented winter of 2013/14.
It's worth noting the climatologies are the standard most recent 3 decades, 1981-2010.
The data from this page can be found here.
The animation smoothness is quite dependent on your connection speed.It's worth noting the climatologies are the standard most recent 3 decades, 1981-2010.
Rainfall Accumulation Over Winter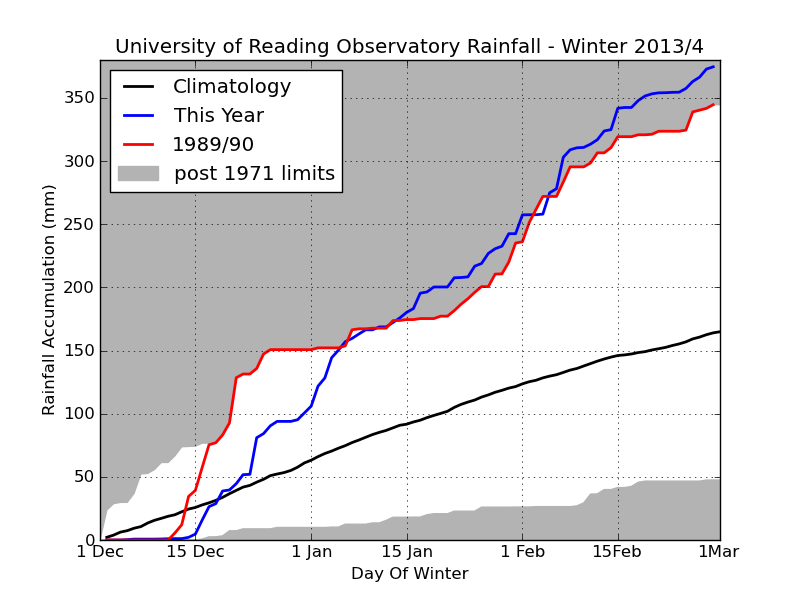 Shown on this plot is the trace for this winter in blue, and the pre-2014 record winter of 1989/90 is shown in red.
The black line shows the expected accumulation based on the 30 year climatology the extremes for winters since 1971
(when reliable records at the site become available), when the blue line enters a grey region that is outside the
previous range.
Shown on this plot is the trace for this winter in blue, and the pre-2014 record winter of 1989/90 is shown in red.
The black line shows the expected accumulation based on the 30 year climatology the extremes for winters since 1971
(when reliable records at the site become available), when the blue line enters a grey region that is outside the
previous range.
We can see on this plot that it wasn't until the 15th December that the rains really began in any significance, until then Reading was having an unusually dry winter. Rainfall before Christmas quickly got the winter towards the excepted accumulation. The new year period saw more storms and soon found the winteron a par with the record wet winter of 1989/90. The wettest January on record saw 2013/14 surpassing the rainfalls seen in 89/90 and despite a brief lull in early February, the rains continue through major storms in mid-February and during the early hours of 18th Feb passed the record for winter Rainfall at the University or Reading dating back to 1908 and by 0900 on the 20th had passed the record seasonal rainfall (353mm in autumn [SON] 2000). The final winter total was 374.6mm, 227% of the long term average and 8% more than the previous record of 1989/90. |
Rainfall Maps Showing Totals and Comparisons to Climatology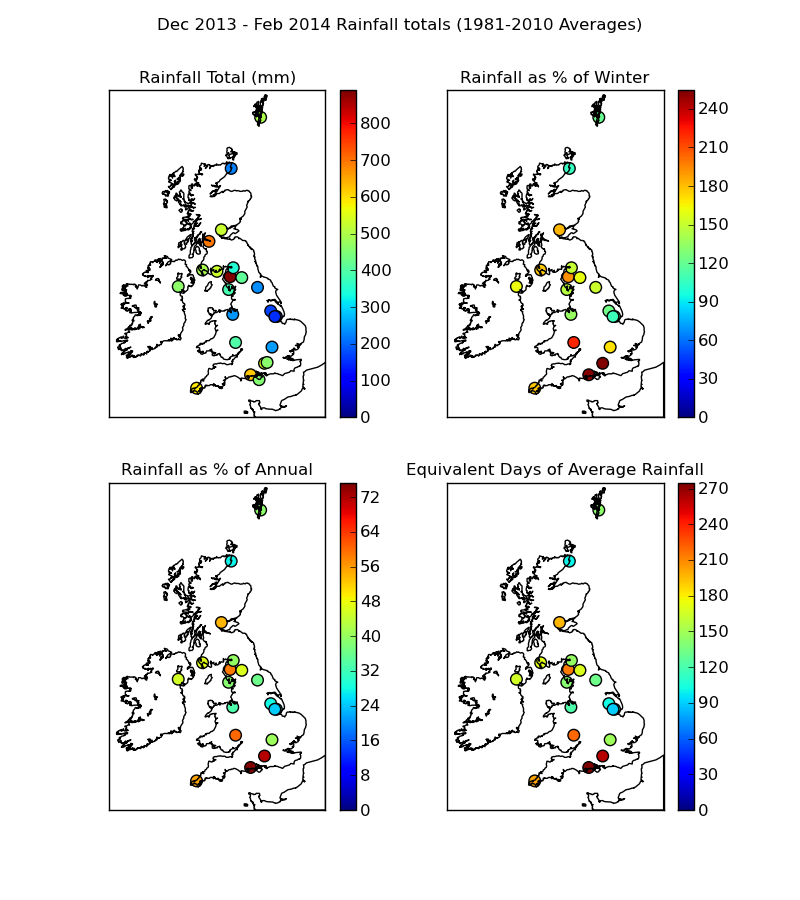 These maps are compiled from synop reports which are compiled by
Roger Brugge, the data is preliminary without rigorous quality
control at this stage, but shows the general patterns well. Top left shows the accumulated total winter
(December, January and February) rainfall for 2013/14. Top right shows the percentage of expected rainfall for
winter based on the 30 year climatology (100 would be the expected amount in an average year), red colours show
where rainfall is most exceptional. Bottom left shows the winter rain as a percentage of the expected annual
rainfall. Bottom right expresses the same figure into the number of average days through the year to achieve that
amount of rain, a normal winter would expect approximately 100 days by this measure.
These maps are compiled from synop reports which are compiled by
Roger Brugge, the data is preliminary without rigorous quality
control at this stage, but shows the general patterns well. Top left shows the accumulated total winter
(December, January and February) rainfall for 2013/14. Top right shows the percentage of expected rainfall for
winter based on the 30 year climatology (100 would be the expected amount in an average year), red colours show
where rainfall is most exceptional. Bottom left shows the winter rain as a percentage of the expected annual
rainfall. Bottom right expresses the same figure into the number of average days through the year to achieve that
amount of rain, a normal winter would expect approximately 100 days by this measure.
While Cumbria has the highest total, this is not a particularly unusual occurance, the local orography [hilly landscape] and location in the North-West leads to high rainfall totals most years compared to the much drier and flatter South-East. It can be seen that the rainfalls in the Central-South and South-East are particularly exceptional, with more than 2 average winters having fallen. These areas could remain dry until May or June and still have more than average rainfall for the year 2014. This is the principle cause of the flooding of this region, the geographic drainage systems have not developed to contain the volume of water that has fallen. What makes this particularly exceptional is that the first two weeks of December were rather dry. |
How The Rain Has Been Distributed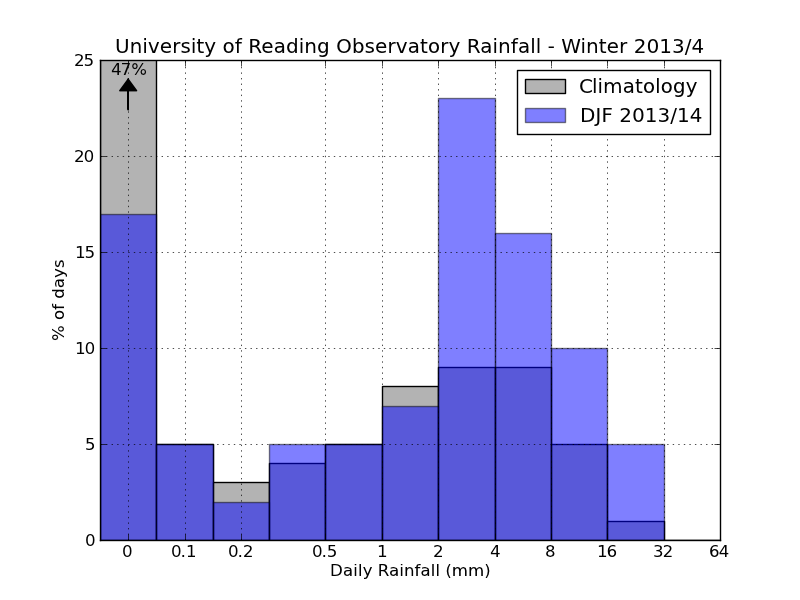 This plot shows histograms of the distribution of rainfalls for days (from 9am-9am). In grey is shown the 30 year
climatology, note to gain more detail the left bar for no rain is well passed the top of the axis, 47% of winter
days are expected to not have a measureable amount of rain. In blue is the current year.
This plot shows histograms of the distribution of rainfalls for days (from 9am-9am). In grey is shown the 30 year
climatology, note to gain more detail the left bar for no rain is well passed the top of the axis, 47% of winter
days are expected to not have a measureable amount of rain. In blue is the current year.
We can see from this that the rainfall totals by day in 2013/14 are generally a little higher than normal, though not exceptionally. There are however much fewer than normal dry days, this is the cause of the excess rainfall we have experienced. This was the result of 30 storms, 15 of which were intense, certainly making this an exceptional winter. |
|
Image missing!
| ||||||||||||||
| animate | ||||||||||||||