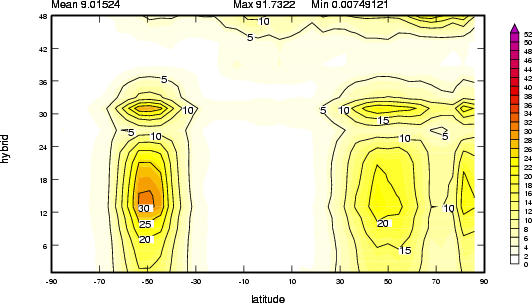
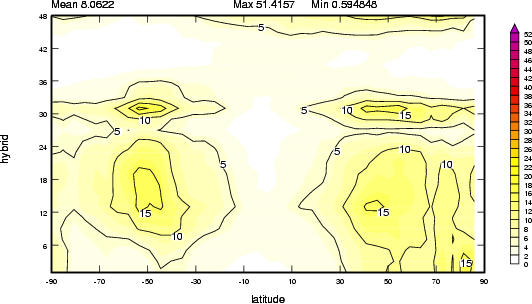
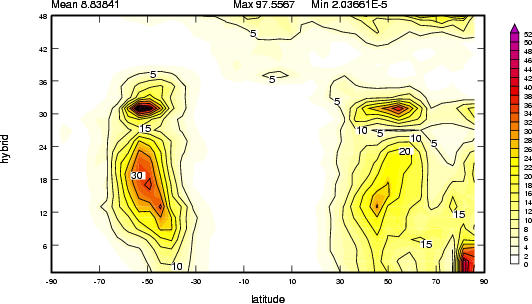
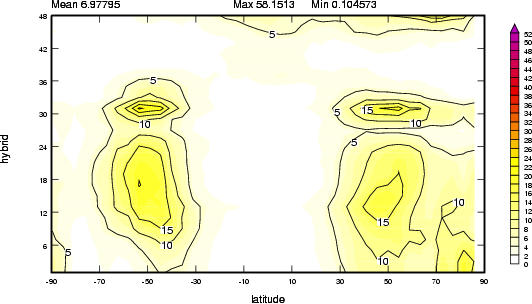
Experiment Bt: Covariance diagnostics for temperature found from the MetO scheme'
| Fig Bt.1: Latitude/height variances (MetO) |
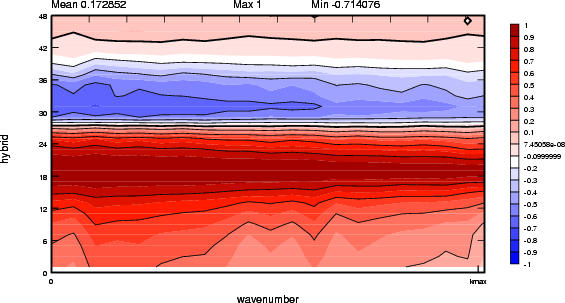
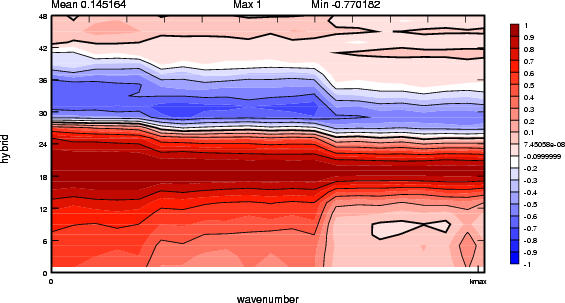
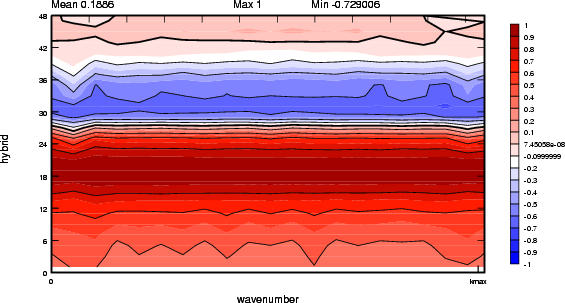
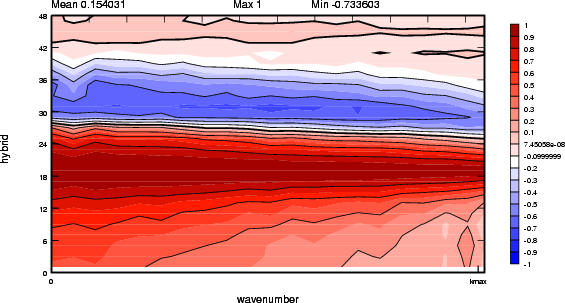
Fig Bt.2: Wavenumber/height correlations with level 21 (about 500 hPa) (MetO) |
 |
 |
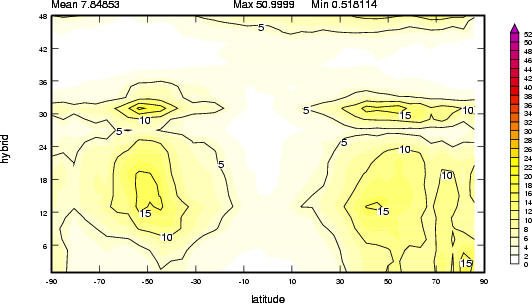
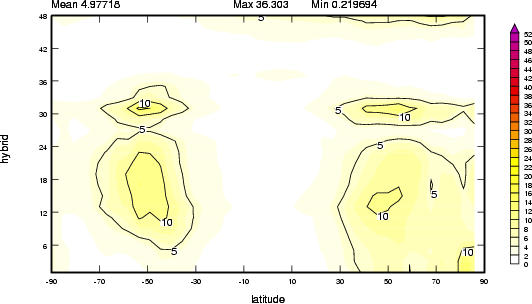
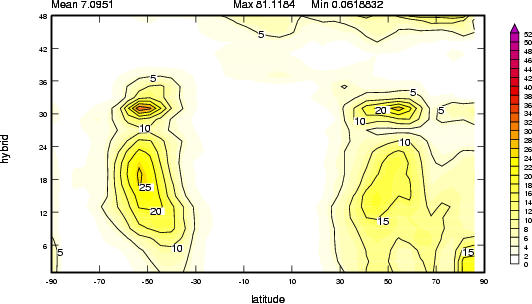
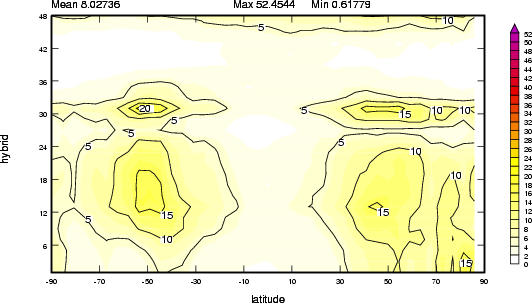
Experiment Ct: Covariance diagnostics for temperature found from the WS scheme, 4 bands (optimal) top-hat T-transform, triangular U-transform'
| Fig Ct.1: Latitude/height variances (MetO) |
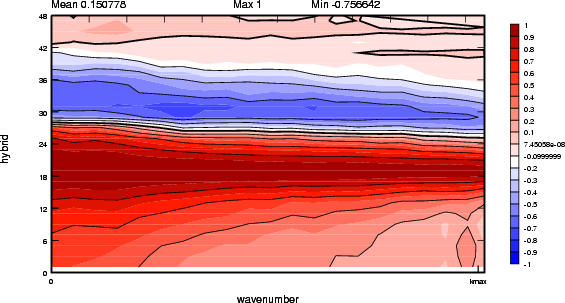
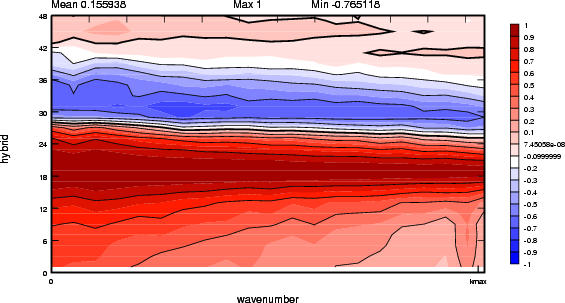
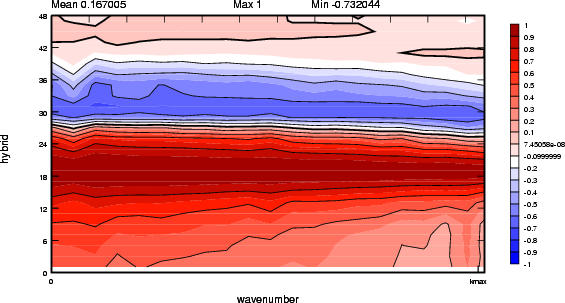
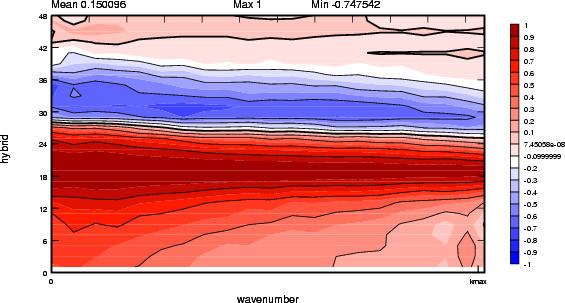
Fig Ct.2: Wavenumber/height correlations with level 21 (about 500 hPa) (WS) |
 |
 |
Experiment Dt: Covariance diagnostics for temperature found from the WS scheme, 4 bands (optimal) top-hat T-transform, top-hat U-transform'
| Fig Dt.1: Latitude/height variances (MetO) |
Fig Dt.2: Wavenumber/height correlations with level 21 (about 500 hPa) (WS) |
 |
 |
Experiment Et: Covariance diagnostics for temperature found from the WS scheme, 4 bands (optimal) triangular T-transform, triangular U-transform'
| Fig Et.1: Latitude/height variances (MetO) |
Fig Et.2: Wavenumber/height correlations with level 21 (about 500 hPa) (WS) |
 |
 |
Experiment Ft: Covariance diagnostics for temperature found from the WS scheme, 1 band top-hat T-transform, triangular U-transform'
| Fig Ft.1: Latitude/height variances (MetO) |
Fig Ft.2: Wavenumber/height correlations with level 21 (about 500 hPa) (WS) |
 |
 |
Experiment Gt: Covariance diagnostics for temperature found from the WS scheme, 2 bands top-hat T-transform, triangular U-transform'
| Fig Gt.1: Latitude/height variances (MetO) |
Fig Gt.2: Wavenumber/height correlations with level 21 (about 500 hPa) (WS) |
 |
 |
Experiment Ht: Covariance diagnostics for temperature found from the WS scheme, 3 bands top-hat T-transform, triangular U-transform'
| Fig Ht.1: Latitude/height variances (MetO) |
Fig Ht.2: Wavenumber/height correlations with level 21 (about 500 hPa) (WS) |
 |
 |
Experiment It: Covariance diagnostics for temperature found from the WS scheme, 10 bands top-hat T-transform, triangular U-transform'
| Fig It.1: Latitude/height variances (MetO) |
Fig It.2: Wavenumber/height correlations with level 21 (about 500 hPa) (WS) |
 |
 |
|