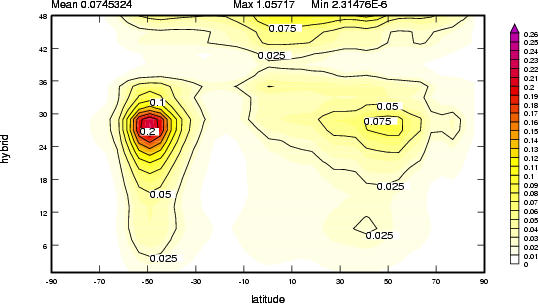
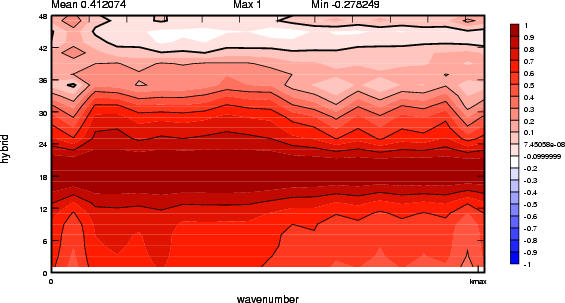
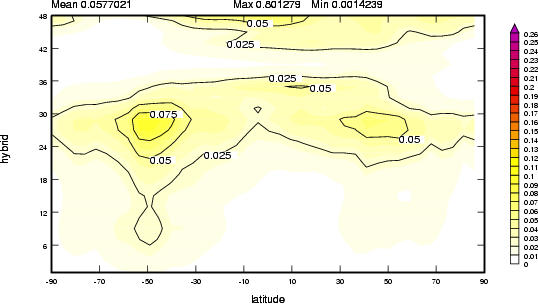
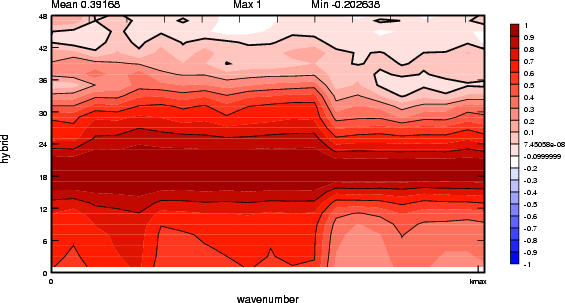
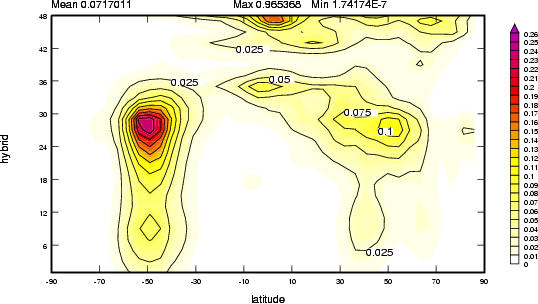
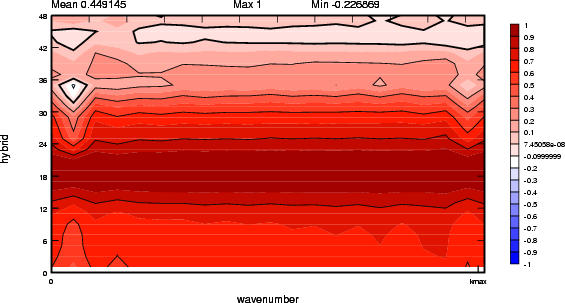
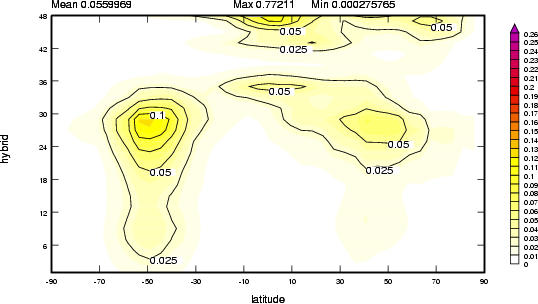
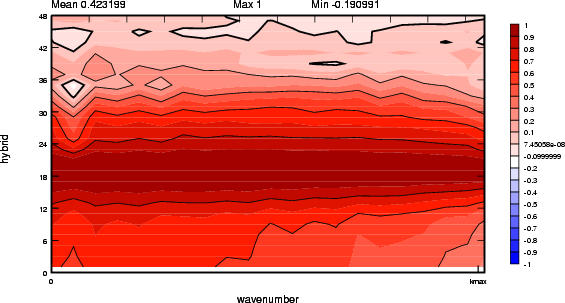
Experiment Bp: Covariance diagnostics for streamfunction found from the MetO scheme'
| Fig Bp.1: Latitude/height variances (MetO) |
Fig Bp.2: Wavenumber/height correlations with level 21 (about 500 hPa) (MetO) |
 |
 |
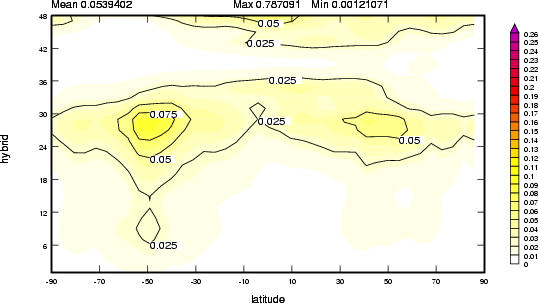
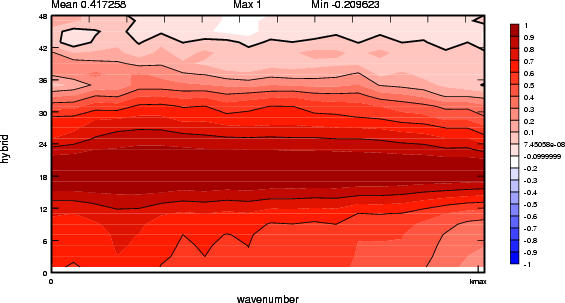
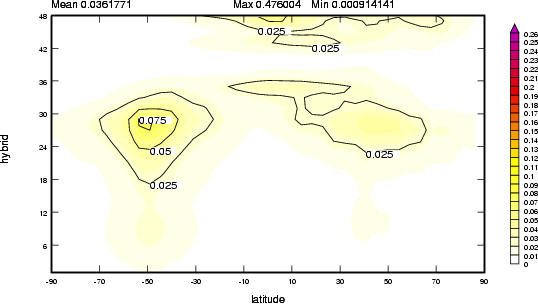
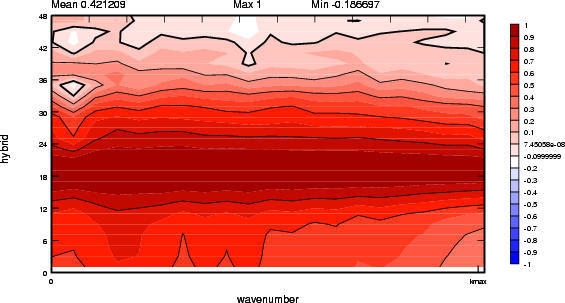
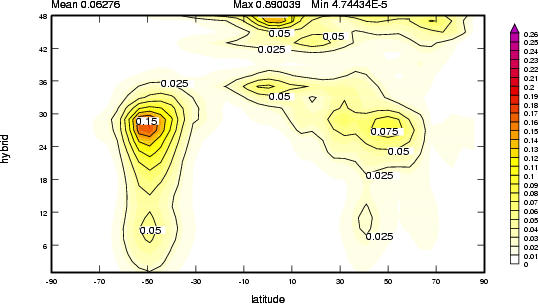
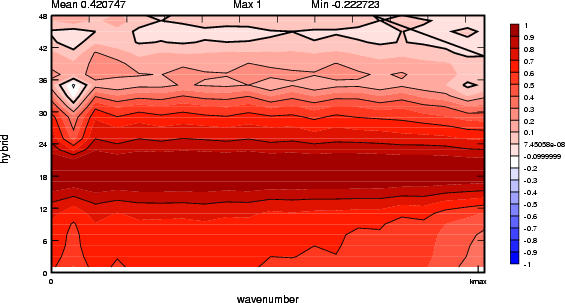
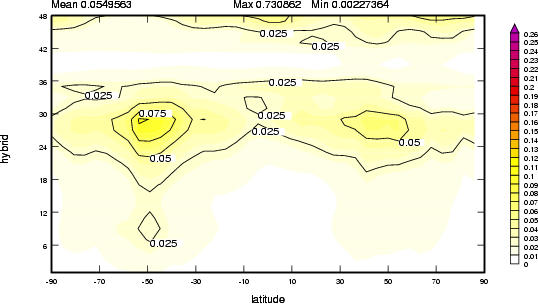
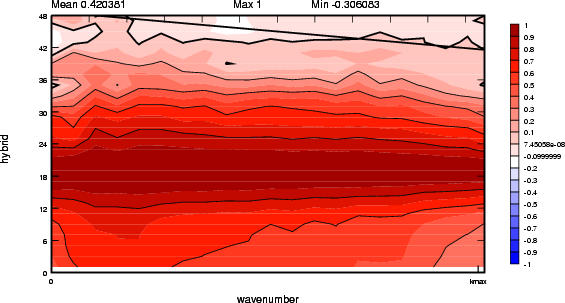
Experiment Cp: Covariance diagnostics for streamfunction found from the WS scheme, 4 bands (optimal) top-hat T-transform, triangular U-transform'
| Fig Cp.1: Latitude/height variances (MetO) |
Fig Cp.2: Wavenumber/height correlations with level 21 (about 500 hPa) (WS) |
 |
 |
Experiment Dp: Covariance diagnostics for streamfunction found from the WS scheme, 4 bands (optimal) top-hat T-transform, top-hat U-transform'
| Fig Dp.1: Latitude/height variances (MetO) |
Fig Dp.2: Wavenumber/height correlations with level 21 (about 500 hPa) (WS) |
 |
 |
Experiment Ep: Covariance diagnostics for streamfunction found from the WS scheme, 4 bands (optimal) triangular T-transform, triangular U-transform'
| Fig Ep.1: Latitude/height variances (MetO) |
Fig Ep.2: Wavenumber/height correlations with level 21 (about 500 hPa) (WS) |
 |
 |
Experiment Fp: Covariance diagnostics for streamfunction found from the WS scheme, 1 band top-hat T-transform, triangular U-transform'
| Fig Fp.1: Latitude/height variances (MetO) |
Fig Fp.2: Wavenumber/height correlations with level 21 (about 500 hPa) (WS) |
 |
 |
Experiment Gp: Covariance diagnostics for streamfunction found from the WS scheme, 2 bands top-hat T-transform, triangular U-transform'
| Fig Gp.1: Latitude/height variances (MetO) |
Fig Gp.2: Wavenumber/height correlations with level 21 (about 500 hPa) (WS) |
 |
 |
Experiment Hp: Covariance diagnostics for streamfunction found from the WS scheme, 3 bands top-hat T-transform, triangular U-transform'
| Fig Hp.1: Latitude/height variances (MetO) |
Fig Hp.2: Wavenumber/height correlations with level 21 (about 500 hPa) (WS) |
 |
 |
Experiment Ip: Covariance diagnostics for streamfunction found from the WS scheme, 10 bands top-hat T-transform, triangular U-transform'
| Fig Ip.1: Latitude/height variances (MetO) |
Fig Ip.2: Wavenumber/height correlations with level 21 (about 500 hPa) (WS) |
 |
 |
|