Characteristics of extratopical cyclones can be seen in this atlas. This includes a composite storm, which comes from an average of over 400 extratropical storms in the Southern Hemisphere between 1979 and 2021. The most intense storms - those achieving the greatest 850 hPa relative vorticity - have been selected. Data from 29 high-impact Australian East Coast Lows can also be viewed by selecting a storm from either the form or google map below.
Once a storm has been selected, various measurements and horizontal cuts of these measurements can be selected. The method used to create the atlas is described here.
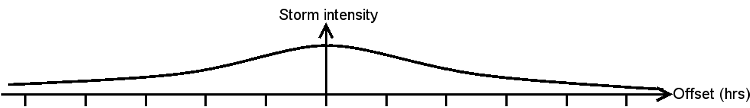
The maximum intensity for each storm (where the potential vorticity was greatest) has been used to align all the storms before averaging was done to produce the composite data in this database. The offset then refers to the number of hours before or after the maximum intensity. Hence an offset of -12 hours is the average of all storms 12 hours before they reached their maximum intensity.
To select an offset, please either click on the figure below or on the buttons on the left.
|
|||||||||||
| -60 | -48 | -36 | -24 | -12 | 0 | 12 | 24 | 36 | 48 | 60 | |
Please select the storm require either using the form below