Initial tests 9 for the GCR (balanced variable)
This page is repeated in both frames to allow comparison between figures.
Characteristics of this test:
- This is a controlled test whereby the PV on the RHS of the equation has originated from a given streamfunction (hence we know that the solution exists, and we know what the solution is). Take the raw streamfunction and filter it with 1 vertical mode, compute the PV from this. This is the RHS PV.
- The first guess is a different streamfunction (the raw streamfunction filtered with 3 vertical modes).
- No preconditioning.
- 50 iterations (restart 5).
- Mass weighted inner product for GCR coefficients.
- Data location /export/custard/disk-01/ross/PV_Results/GCR_Test/PV/RevisedTest/AnsKnown_1
Notes about the plots on this page:
- For each variable, horizontal (long/lat) and vertical (lat/eta) plots are shown.
- For PV variables the extra modes are shown in addition.
- For the horizonal plots, the level is L30 (eta=0.445).
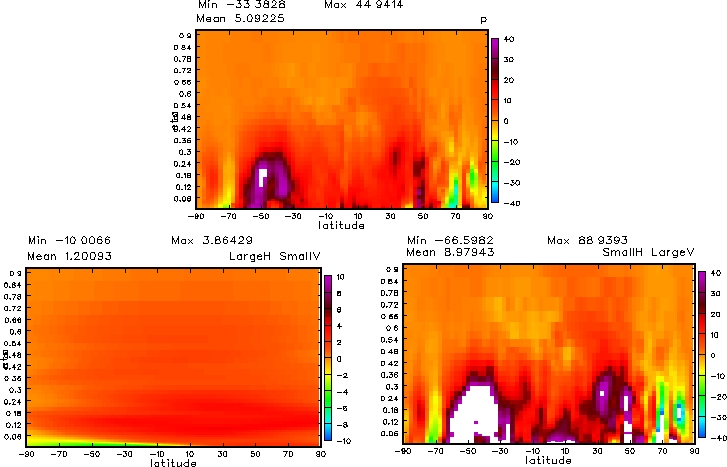
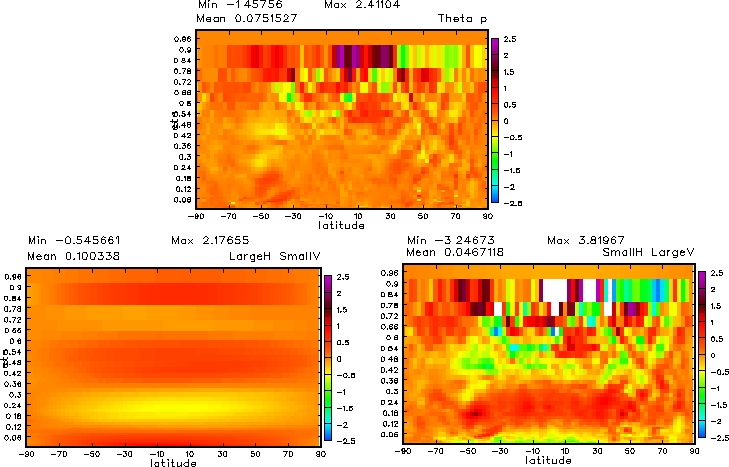
- For the vertical plots, the longitude slice is Greenwich meridian.
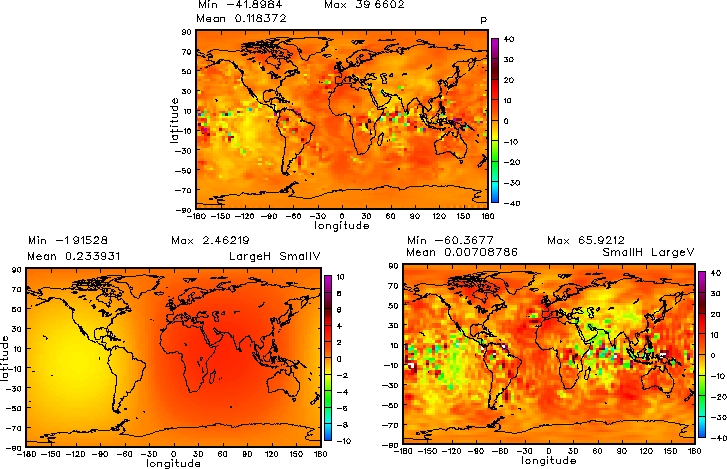
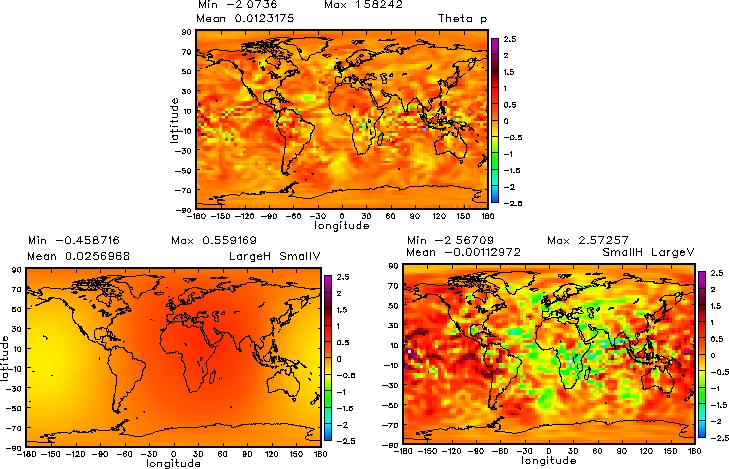
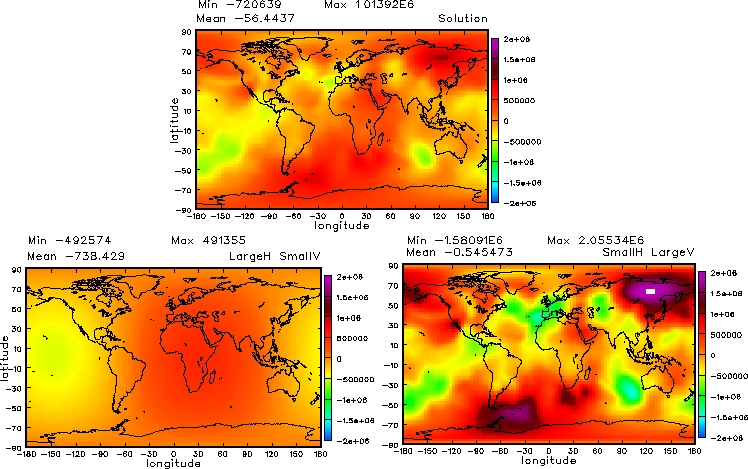
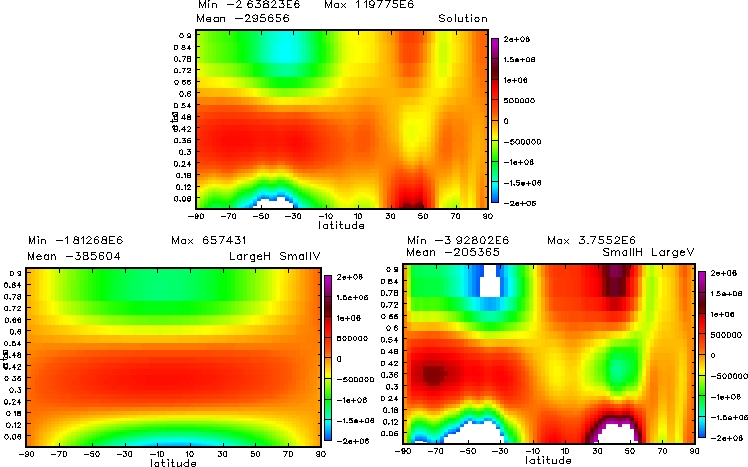
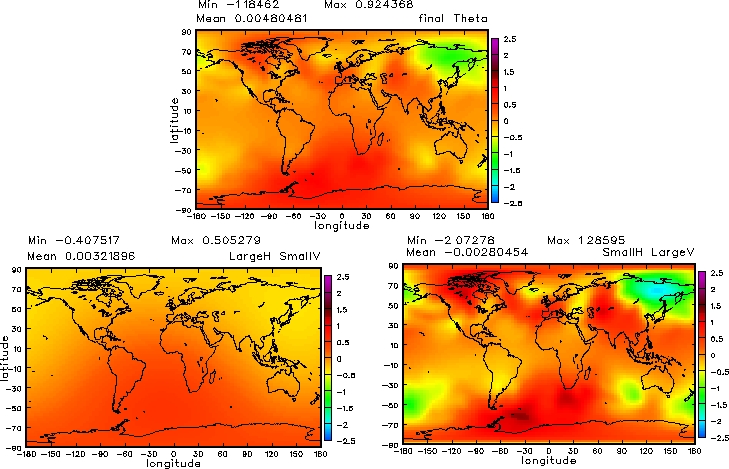
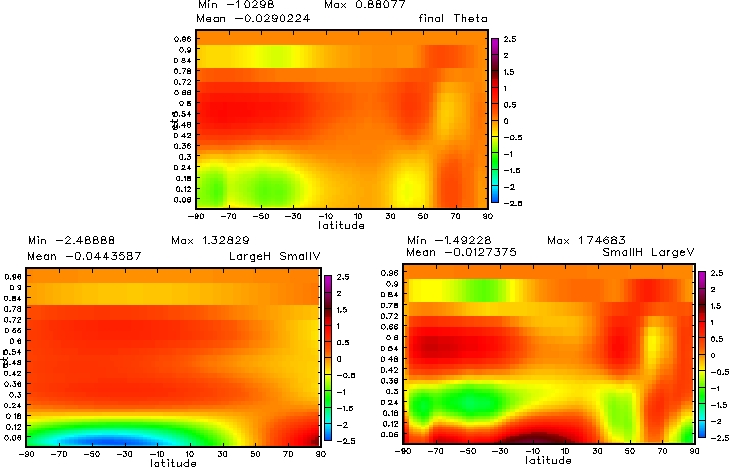
- Each field (except for the PV modes) is decomposed into large horiz/small vert (left) and small horiz/large vert (right) scales.
- The plots show the max, min, and mean (calculated by the plotter).
- Plots of balanced pressure have been shown without density scaling in the linear balance equation (to allow us to see the vertical structure). This is for diagnostic purposes only - the actual density scaled pressures are used in the calculations.
1. The raw pressure perturbation (ref: p)
Horizontal plots at L30
Vertical plots at Greenwich meridian
2. The raw theta perturbation - hydrostatic balance with 1 (ref: Theta_p)
Horizontal plots at L30
Vertical plots at Greenwich meridian
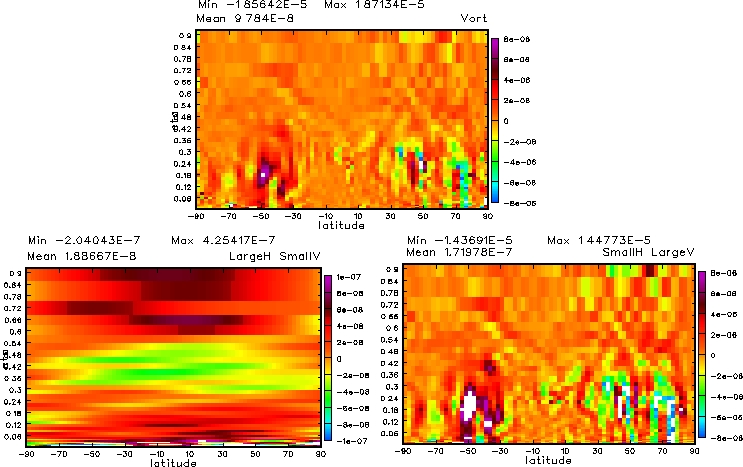
3. The raw vorticity perturbation (ref: Vort)
Horizontal plots at L30
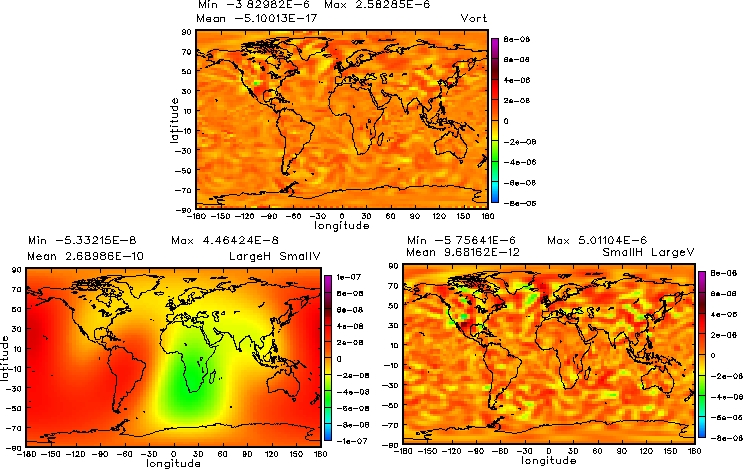
Vertical plots at Greenwich meridian
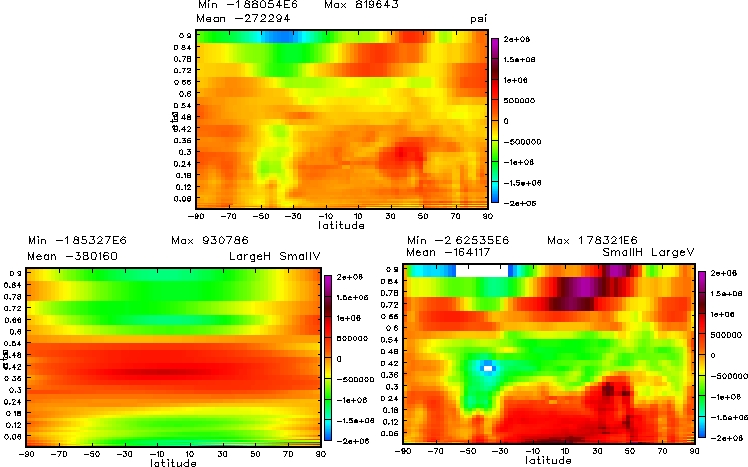
4. The raw streamfunction perturbation (ref: psi)
Horizontal plots at L30
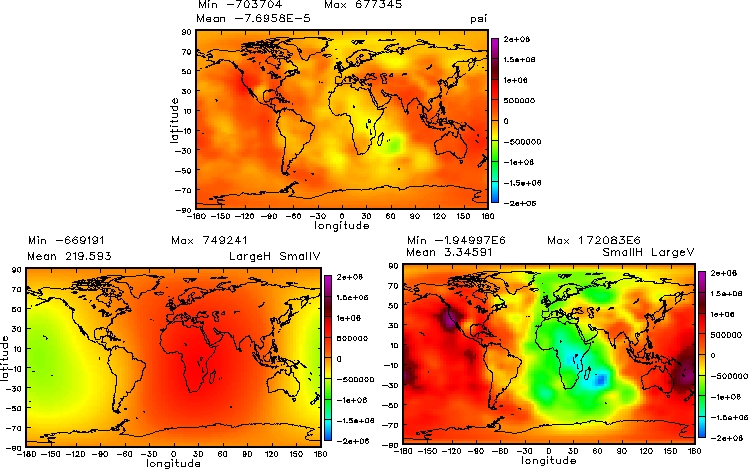
Vertical plots at Greenwich meridian
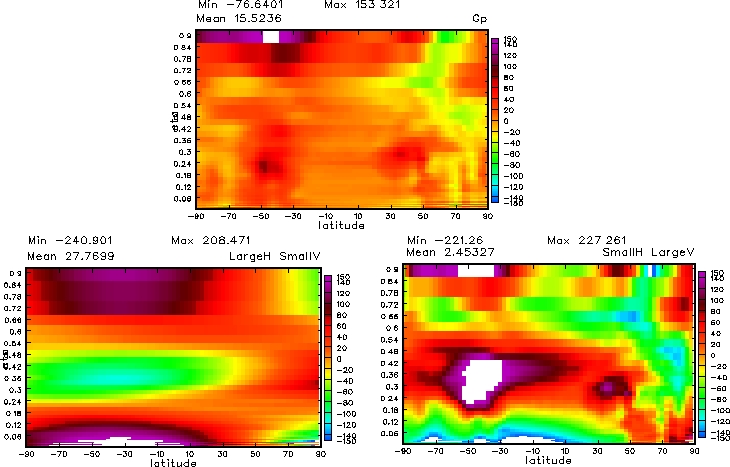
5. The pressure in balance with 4. (ref: Gp)
Horizontal plots at L30
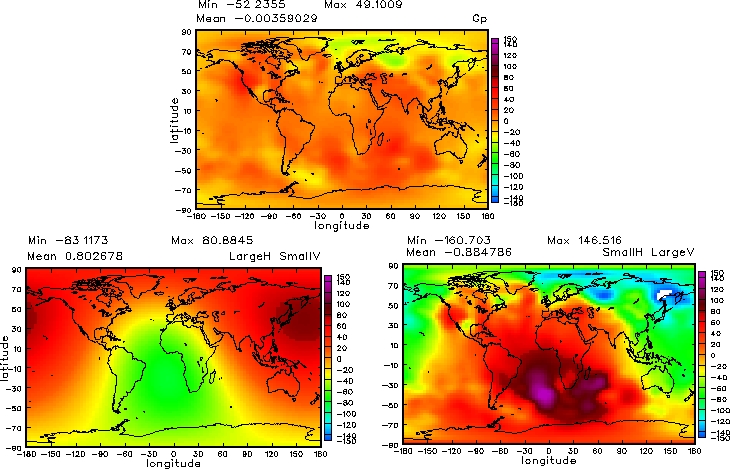
Vertical plots at Greenwich meridian
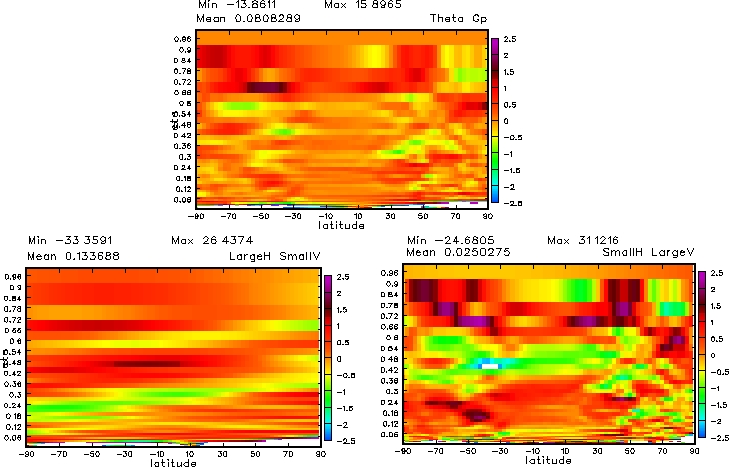
6. The theta in hydrostatic balance with 5. (ref: Theta_Gp)
Horizontal plots at L30
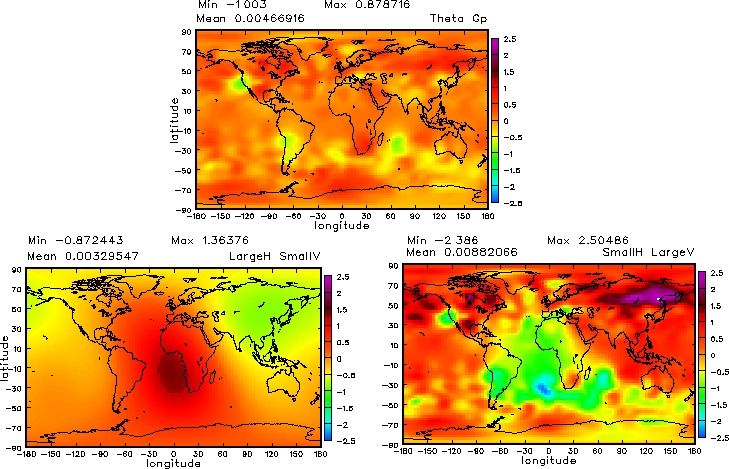
Vertical plots at Greenwich meridian
7. The PV calculated from 4. and 5. (ref: PV)
Horizontal plots at L30
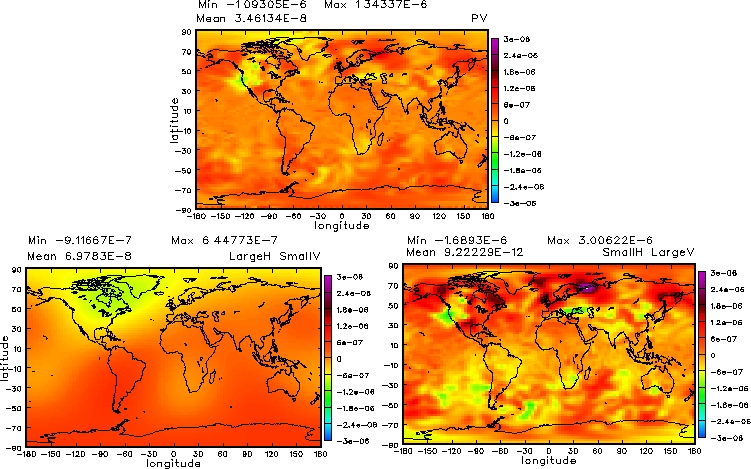
Vertical plots at Greenwich meridian
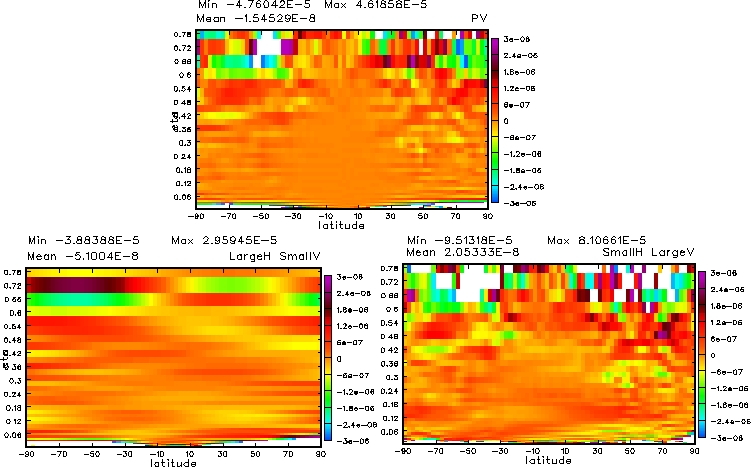
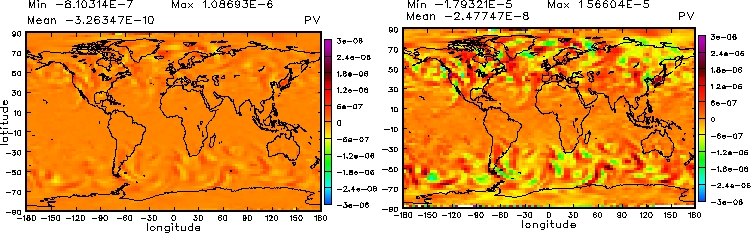
PV modes
8. The filtered streamfunction perturbation (ref: psi_filt)
Horizontal plots at L30

Vertical plots at Greenwich meridian

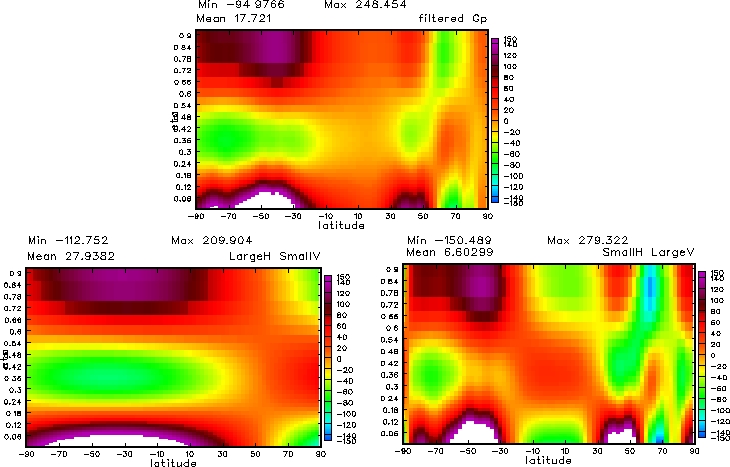
9. The pressure in balance with 8. (ref: filtered_Gp)
Horizontal plots at L30
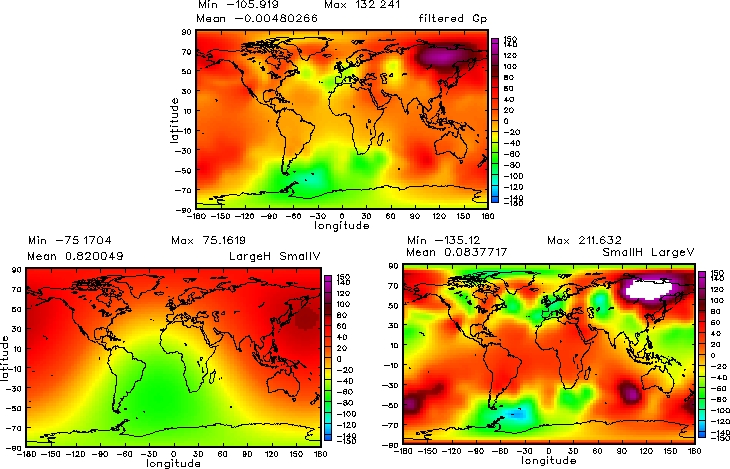
Vertical plots at Greenwich meridian
10. The theta in hydrostatic balance with 9. (ref: filtered_Theta)
Horizontal plots at L30

Vertical plots at Greenwich meridian

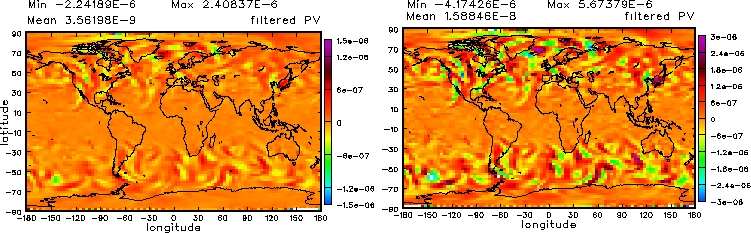
11. The PV calculated from 8. and 9. (ref: filtered_PV)
Horizontal plots at L30

Vertical plots at Greenwich meridian
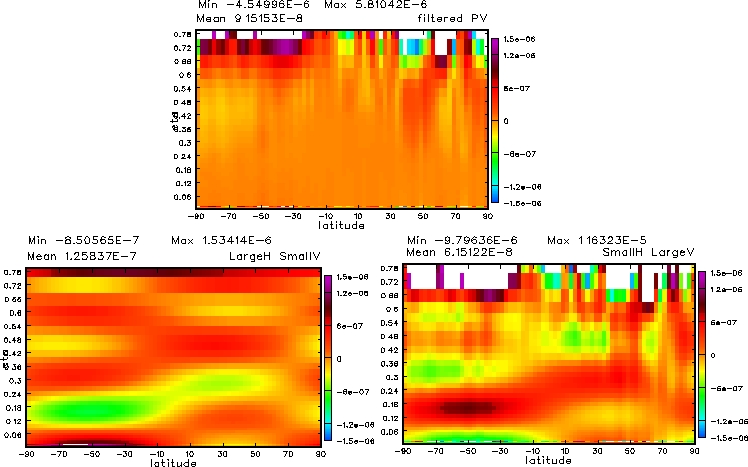
PV modes
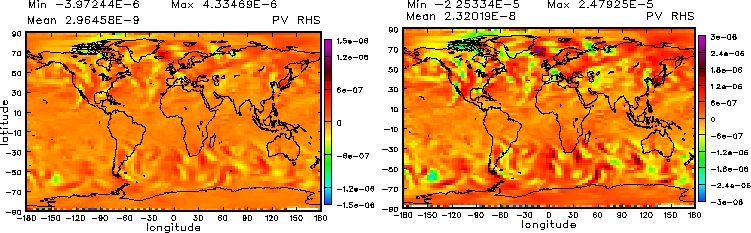
12. The PV calculated from raw data (ref: PV_RHS)
Horizontal plots at L30

Vertical plots at Greenwich meridian

PV modes
13. The 'solution' streamfunction perturbation (ref: Solution)
Horizontal plots at L30
Vertical plots at Greenwich meridian
14. The pressure in balance with 13. (ref: final_Gp)
Horizontal plots at L30

Vertical plots at Greenwich meridian

15. The pressure in balance with 14. (ref: final_Theta)
Horizontal plots at L30
Vertical plots at Greenwich meridian
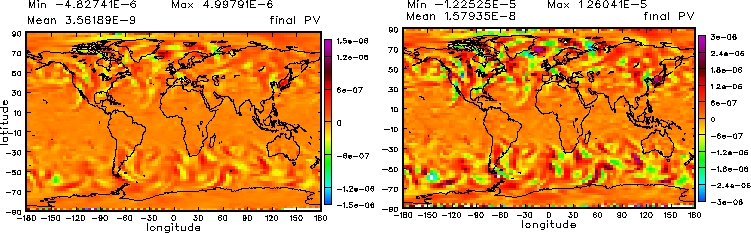
16. The PV calculated from 13. and 14. (ref: final_PV)
Horizontal plots at L30
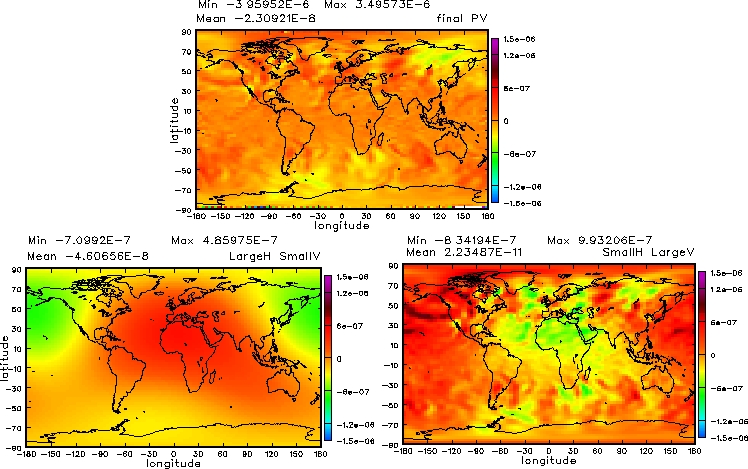
Vertical plots at Greenwich meridian
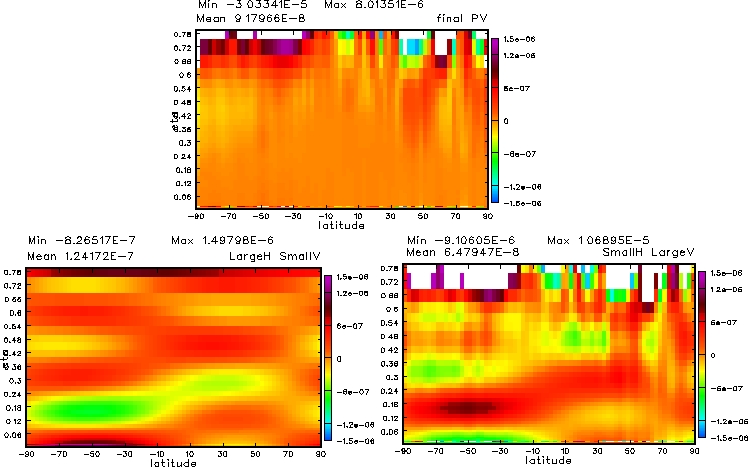
PV modes
The convergence (Error norm vs total iteration)

Back to main PV page