Initial tests 6 for the GCR (balanced variable)
This page is repeated in both frames to allow comparison between figures.
This test uses a revised system with some bugs corrected. Characteristics of this test:
- Try to invert a given PV distribution (itself calculated from data) to give the balanced streamfunction.
- The first guess of the balanced streamfunction is the streamfunction calculated from data, but filtered in the vertical to project on to the first three vertical modes only.
- No preconditioning is used.
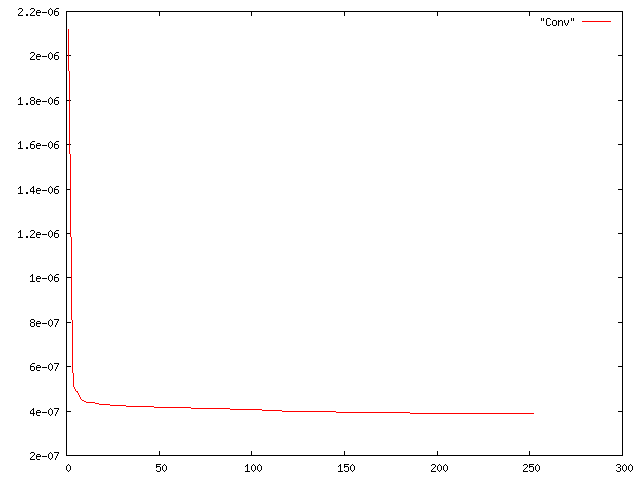
- The GCR is not taken to convergence, but after 50 iterations with k=5 restart (250 iterations in total).
The bugs found in the code are:
- The routine that calculates the inner product for the GCR coefficients was designed for the rho points. rho points include the pole and only one point was used in the inner product. The grid used in my code is the phi grid, which is staggered away from the pole (hence the extreme row is not at the pole and can be included in the inner product).
- Similarly for the routine that calculates the norm of the residual.
Notes about the plots on this page:
- For each variable, horizontal (long/lat) and vertical (lat/eta) plots are shown.
- For PV variables the extra modes are shown in addition.
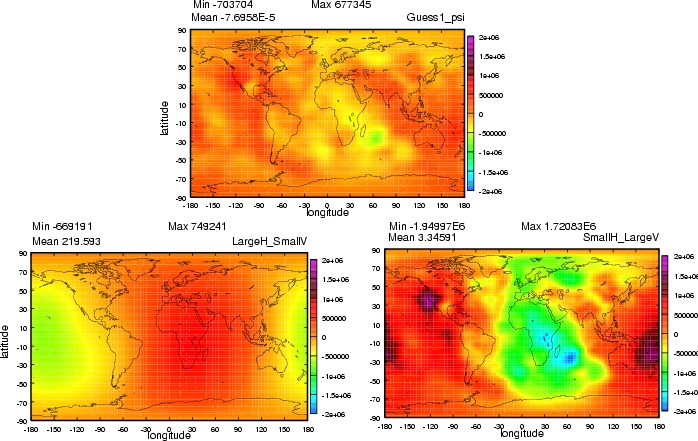
- For the horizonal plots, the level is L30 (eta=0.445).
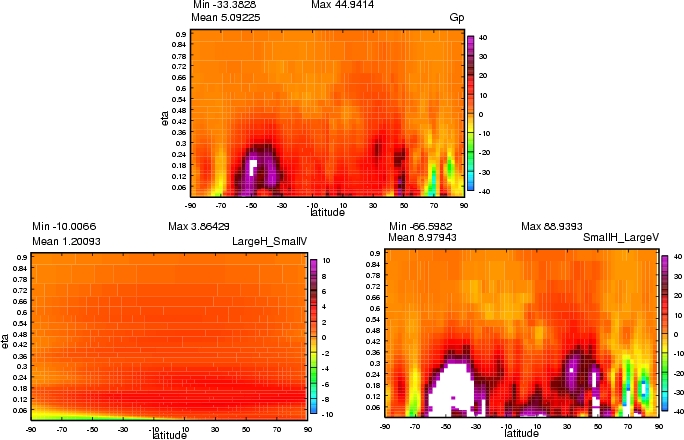
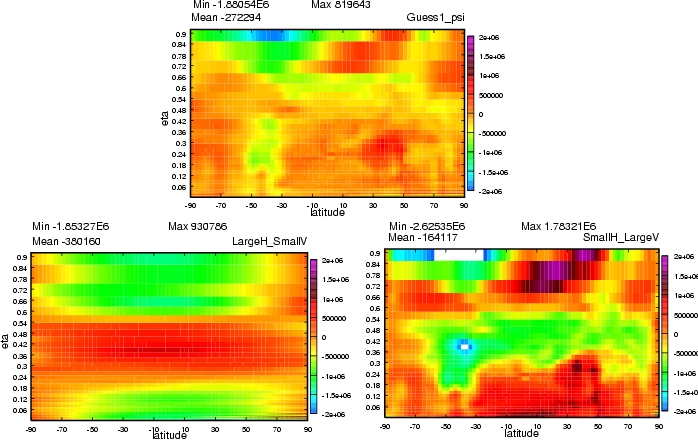
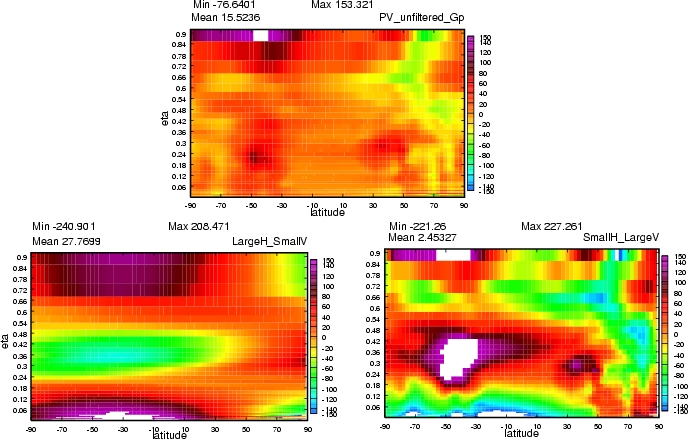
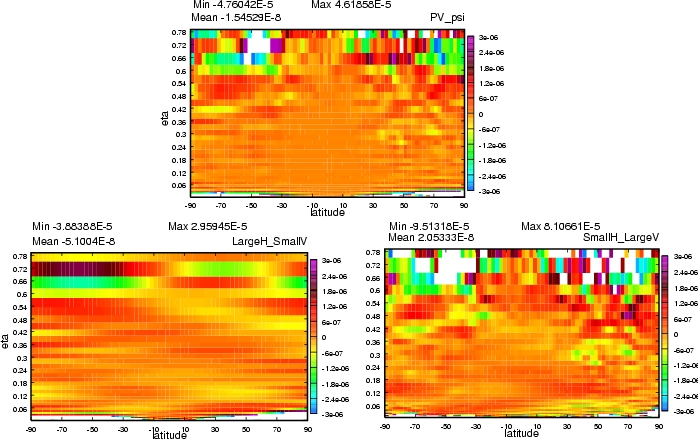
- For the vertical plots, the longitude slice is Greenwich meridian.
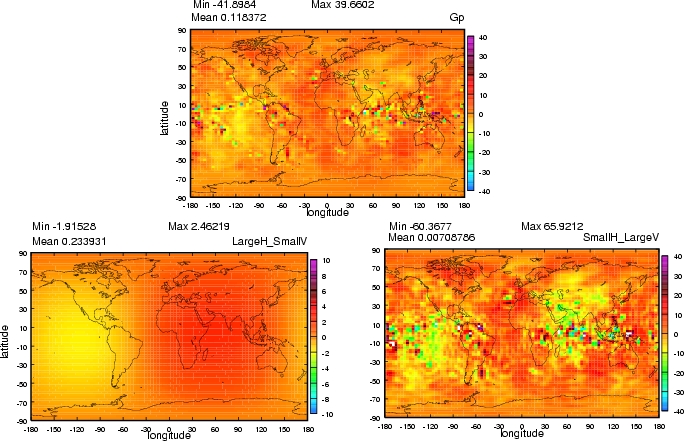
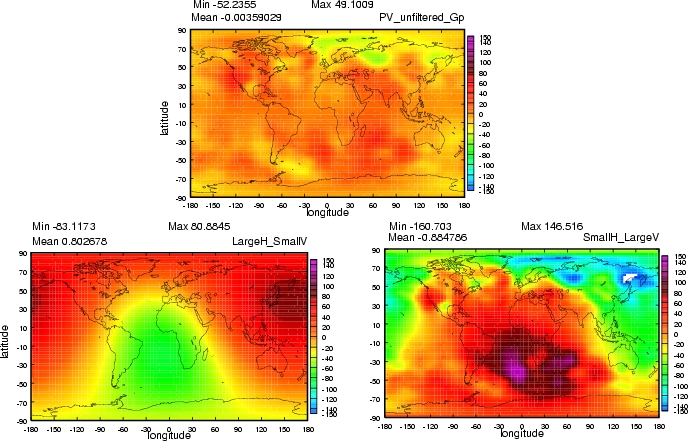
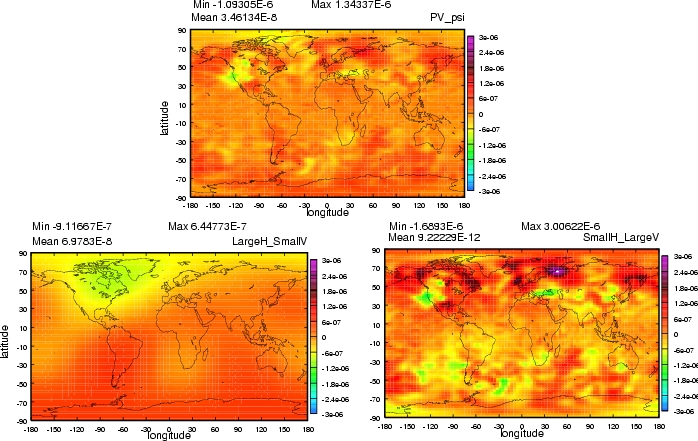
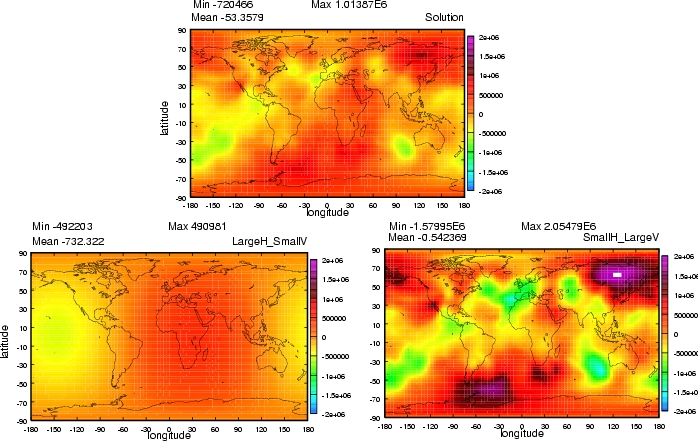
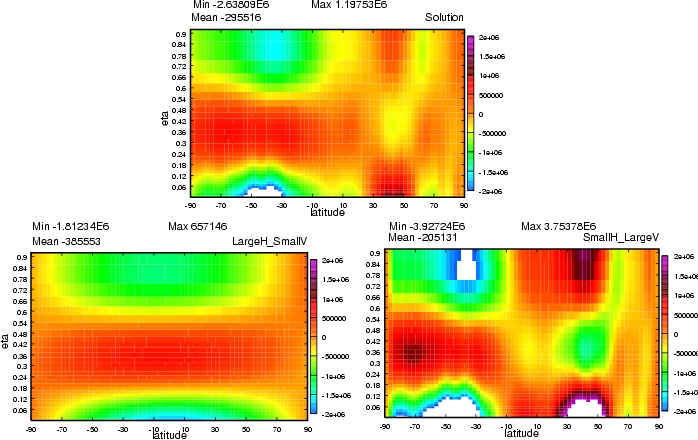
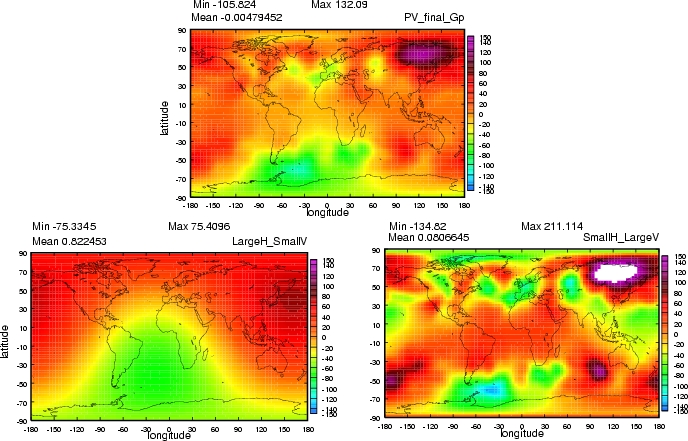
- Each field (except for the PV modes) is decomposed into large horiz/small vert (left) and small horiz/large vert (right) scales.
- The plots show the max, min, and mean (calculated by the plotter).
- Plots of balanced pressure have been shown without density scaling in the linear balance equation (to allow us to see the vertical structure). This is for diagnostic purposes only - the actual density scaled pressures are used in the calculations.
1. The raw pressure perturbation (ref: Gp)
Horizontal plots at L30
Vertical plots at Greenwich meridian
2. The raw vorticity perturbation (ref: Vort)
Horizontal plots at L30

Vertical plots at Greenwich meridian

3. The raw streamfunction perturbation (ref: Guess1_psi)
Horizontal plots at L30
Vertical plots at Greenwich meridian
4.1. The pressure in balance with 3. (ref: PV_unfiltered_Gp)
Horizontal plots at L30
Vertical plots at Greenwich meridian
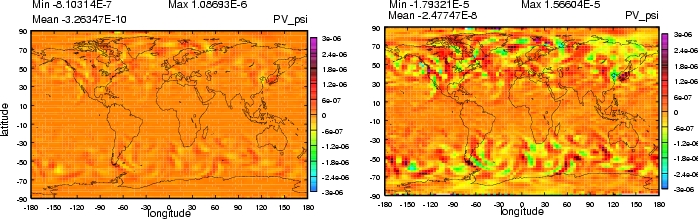
4.2. The PV calculated from 3. and 4.1. (ref: PV_unfiltered_PV)
Horizontal plots at L30
Vertical plots at Greenwich meridian
PV modes
5. The filtered streamfunction perturbation (ref: Guess1_psi_filt)
Horizontal plots at L30
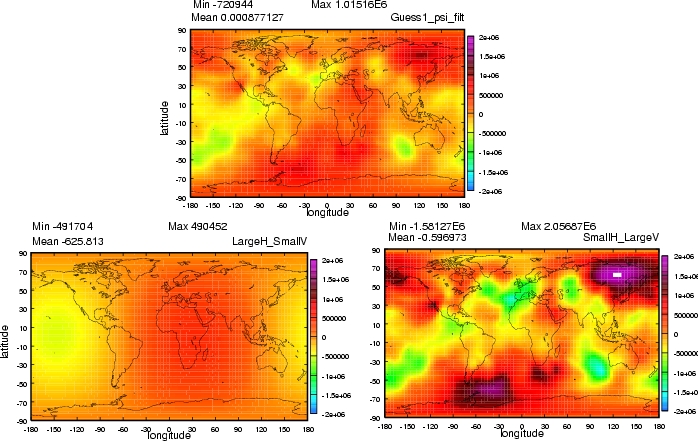
Vertical plots at Greenwich meridian

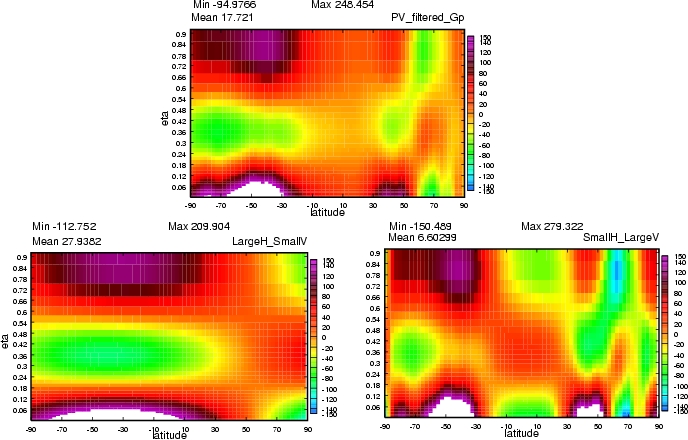
6.1. The pressure in balance with 5. (ref: PV_filtered_Gp)
Horizontal plots at L30

Vertical plots at Greenwich meridian
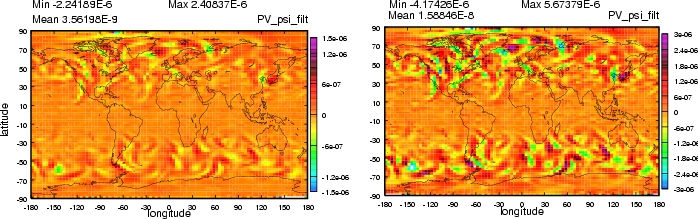
6.2. The PV calculated from 5. and 6.1. (ref: PV_filtered_PV)
Horizontal plots at L30
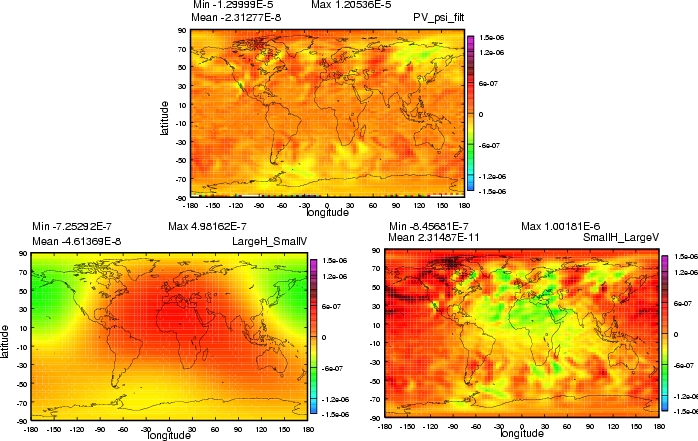
Vertical plots at Greenwich meridian
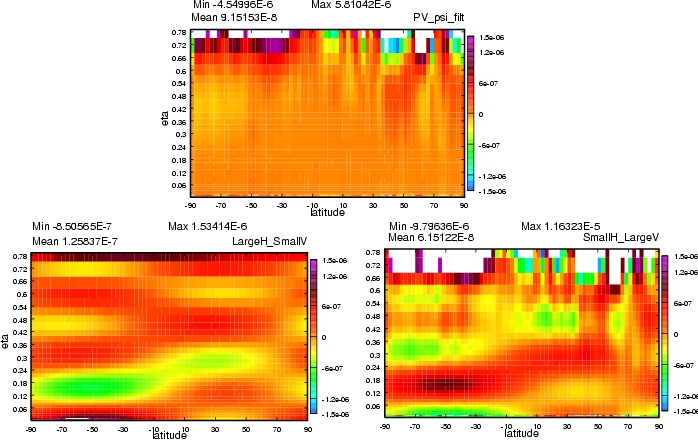
PV modes
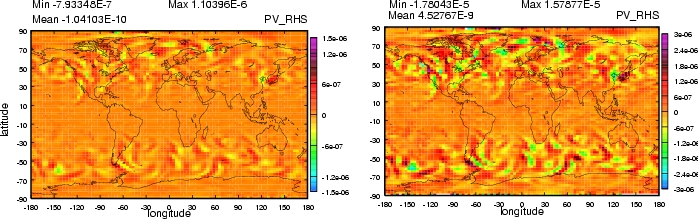
7. The PV calculated from raw data (ref: PV_RHS)
Horizontal plots at L30
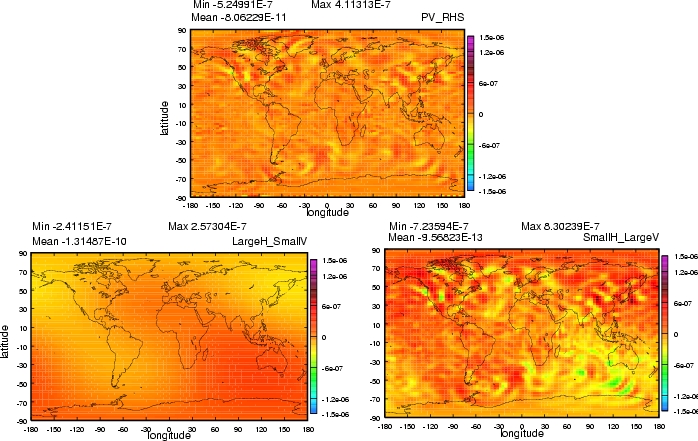
Vertical plots at Greenwich meridian
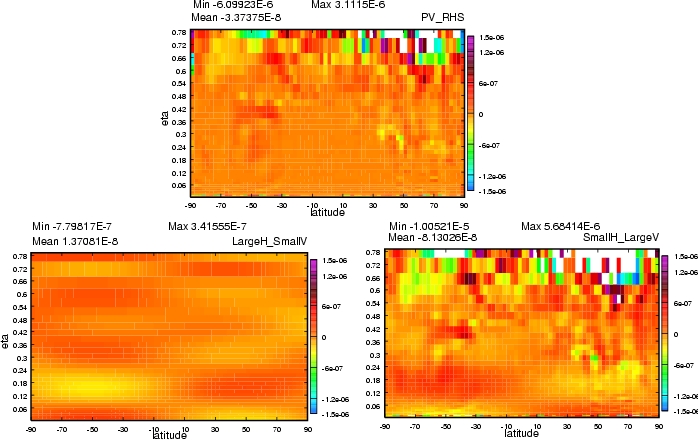
PV modes
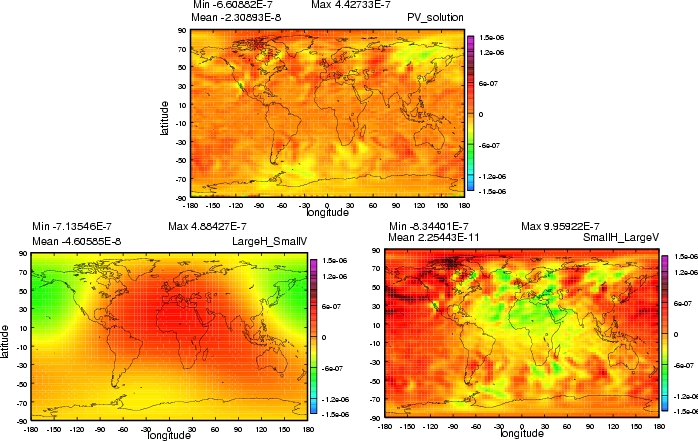
8. The 'solution' streamfunction perturbation (ref: Solution)
Horizontal plots at L30
Vertical plots at Greenwich meridian
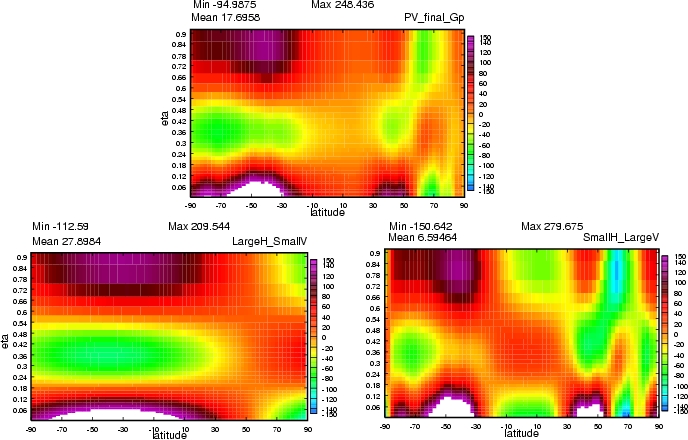
9.1. The pressure in balance with 8. (ref: PV_final_Gp)
Horizontal plots at L30
Vertical plots at Greenwich meridian
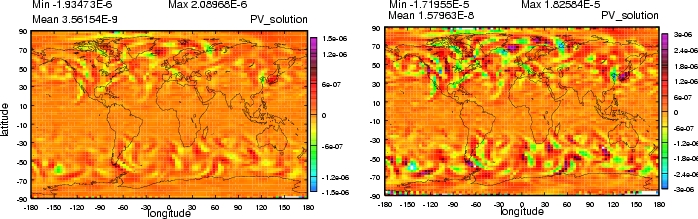
9.2. The PV calculated from 8. and 9.1. (ref: PV_solution)
Horizontal plots at L30
Vertical plots at Greenwich meridian

PV modes
The convergence (Error norm vs total iteration)
Back to main PV page