Initial tests 15 for the GCR (unbalanced variable)
This page is repeated in both frames to allow comparison between figures.
Characteristics of this test:
- RHS anti-PV is raw data.
- PV=0 transform is grid only.
- The first guess unbalanced pressure is p-Gp (p=raw pressure, Gp is balanced pressure found from GCR try 13).
- No preconditioning.
- 100 iterations (restart 5).
- Mass weighted inner product for GCR coefficients.
- Data location /export/custard/disk-01/ross/PV_Results/GCR_Test/antiPV/GridOnly_NoPrecon_100_MassWt/
Notes about the plots on this page:
- For each variable, horizontal (long/lat) and vertical (lat/eta) plots are shown.
- For the horizonal plots, the levels are "lower level" = L11 (eta=0.056) and "upper level" = L30 (eta=0.445). There are 38 levels in total.
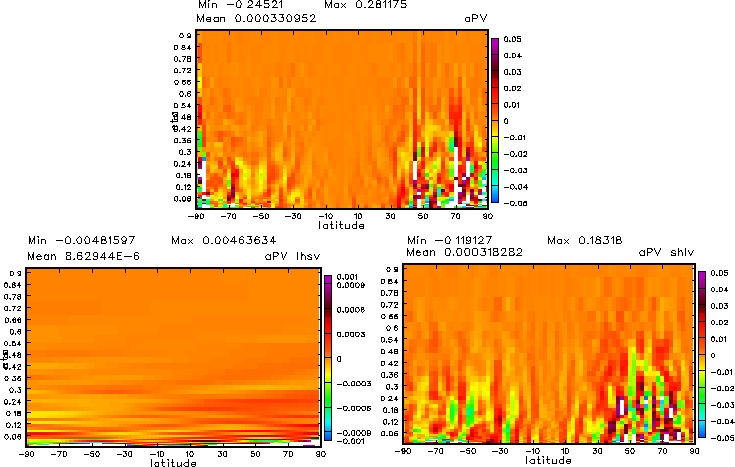
- For the vertical plots, the longitude slice is Greenwich meridian.
- Each field (except differences) is decomposed into large horiz/small vert (left) and small horiz/large vert (right) scales.
- The plots show the max, min, and mean (calculated by the plotter).
- Unbalanced pressure is also plotted as the difference between the 'solution' and the initial guess.
- Anti-PV is also plotted as the difference between the 'solution' and the RHS.
Jump to:
1(Ap_1)
2(antiPV_RHS)
3(Ap_Solution)
4(AntiPV_Solution)
Convergence
1. Initial guess unbalanced pressure perturbation (ref: Ap_1)
Horizontal plots at L30
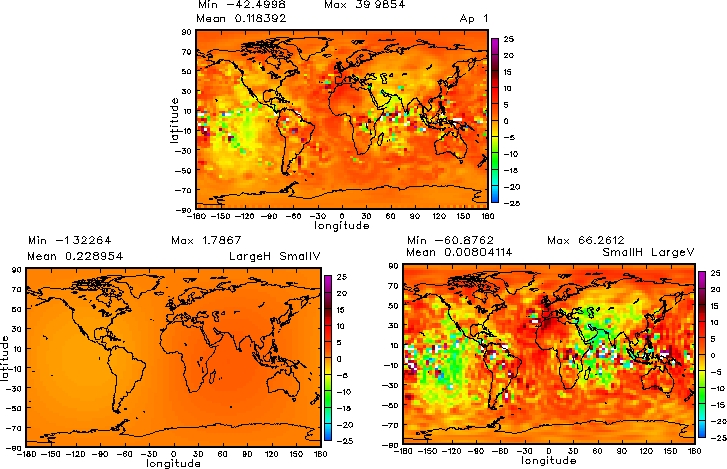
Horizontal plots at L11
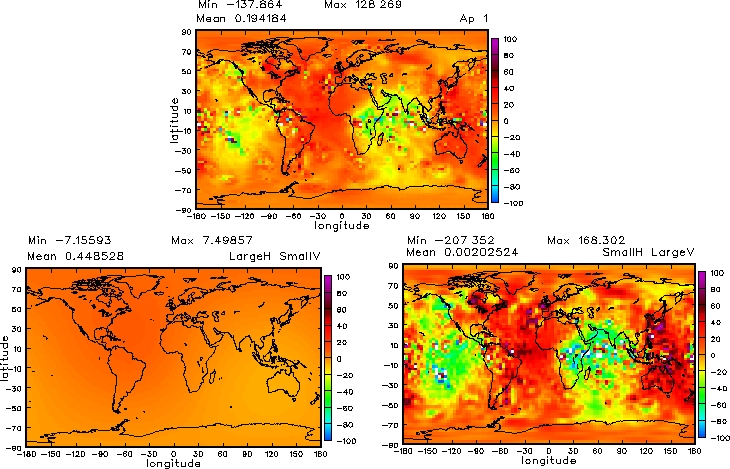
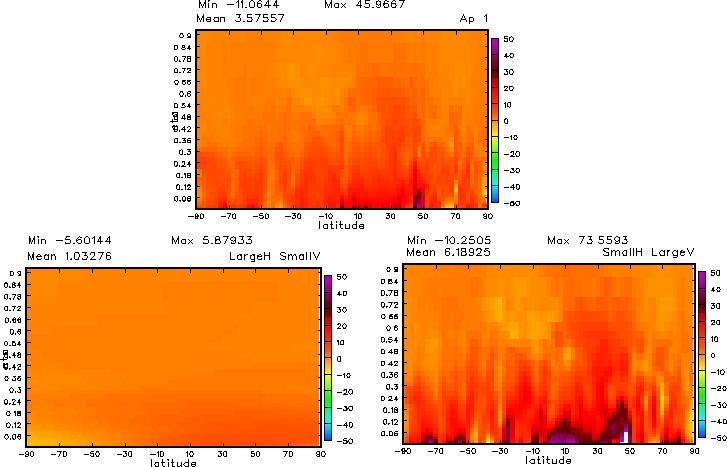
Vertical plots at Greenwich meridian
Jump to:
1(Ap_1)
2(antiPV_RHS)
3(Ap_Solution)
4(AntiPV_Solution)
Convergence
2. RHS Anti-PV (ref: antiPV_RHS)
Horizontal plots at L30
Horizontal plots at L11
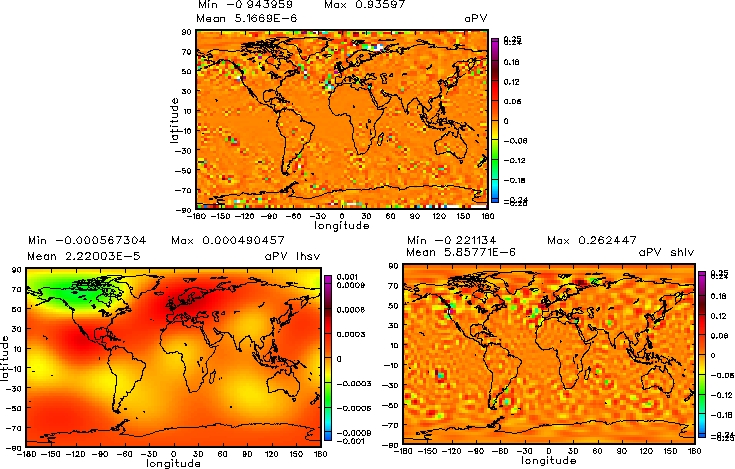
Vertical plots at Greenwich meridian
Jump to:
1(Ap_1)
2(antiPV_RHS)
3(Ap_Solution)
4(AntiPV_Solution)
Convergence
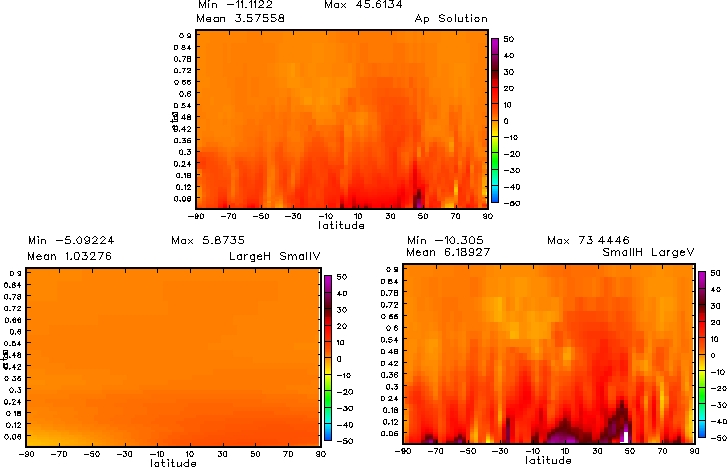
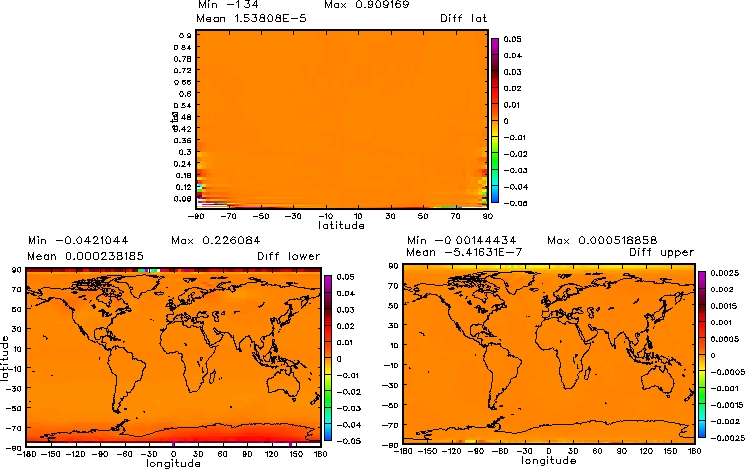
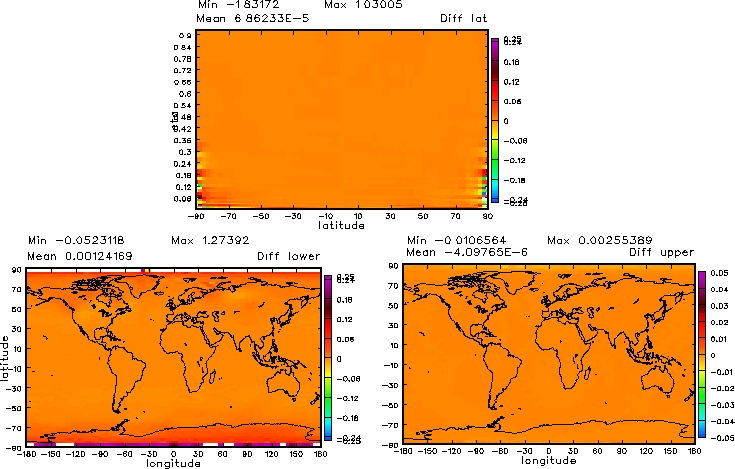
3. The solution in terms of unbalanced pressure (ref: Ap_Solution)
Horizontal plots at L30
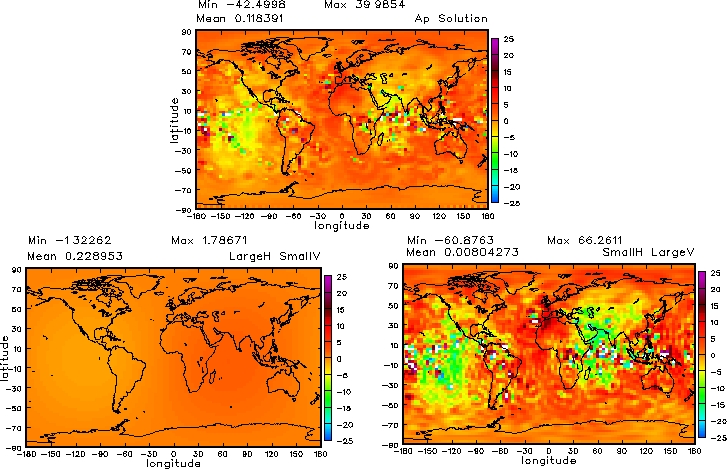
Horizontal plots at L11
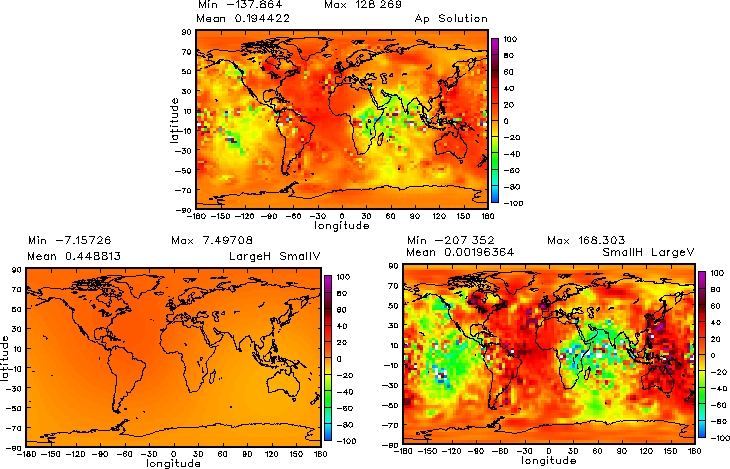
Vertical plots at Greenwich meridian
Difference plots for vertical plot, L11 and L30
Jump to:
1(Ap_1)
2(antiPV_RHS)
3(Ap_Solution)
4(AntiPV_Solution)
Convergence
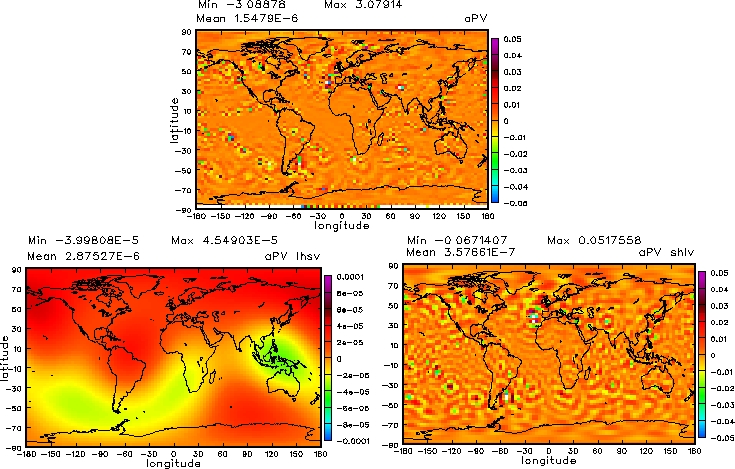
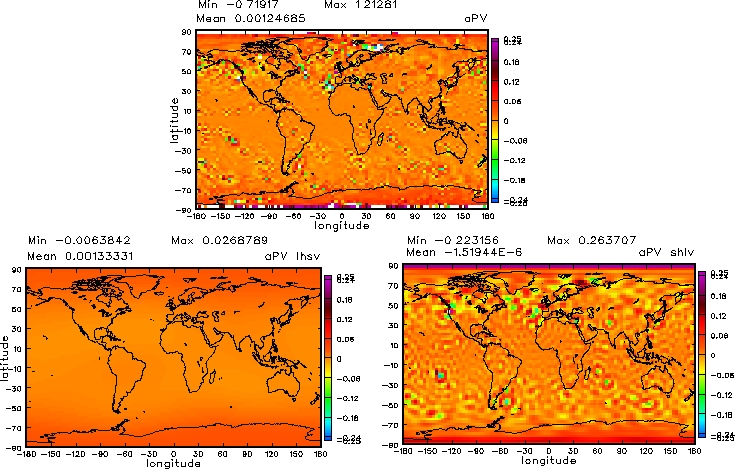
3. The solution in terms of antiPV (ref: AntiPV_Solution)
Horizontal plots at L30
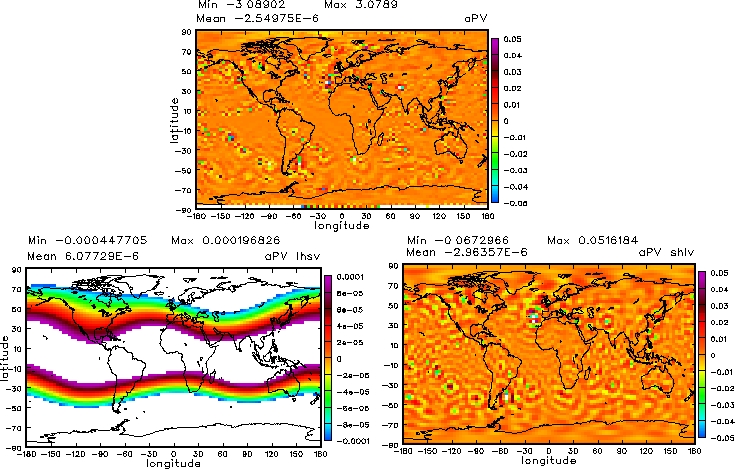
Horizontal plots at L11
Vertical plots at Greenwich meridian
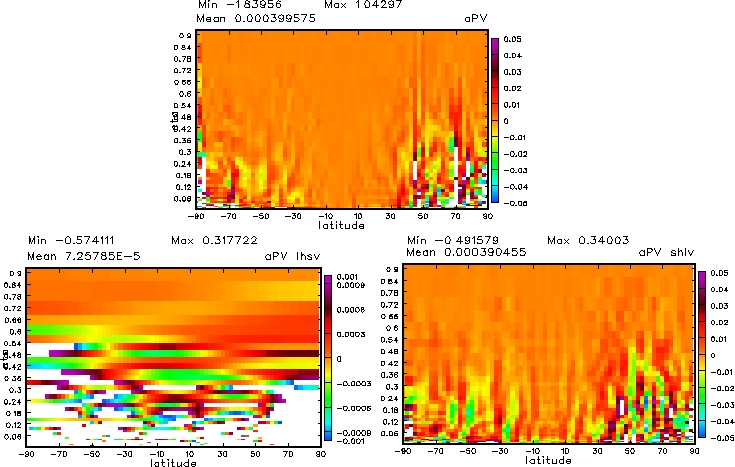
Difference plots for vertical plot, L11 and L30
Jump to:
1(Ap_1)
2(antiPV_RHS)
3(Ap_Solution)
4(AntiPV_Solution)
Convergence
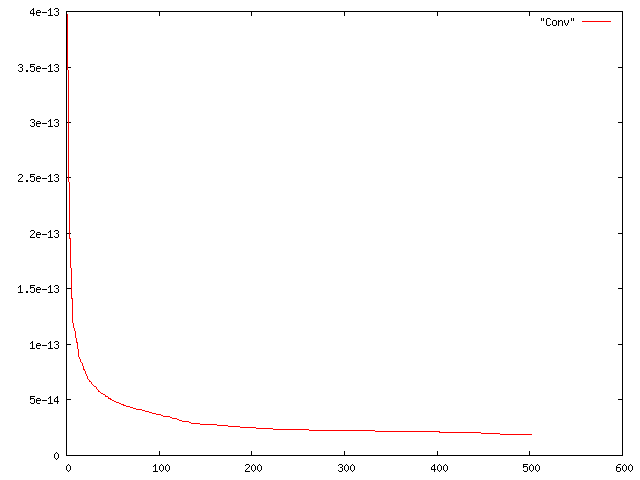
The convergence (Error norm vs total iteration)
Back to main PV page