|
Group Velocity
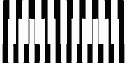
The animation shows two arrays of 10 and 12 white lines, respectively,
moving to the left at different speeds. The overlapping region contains
parts where the white lines fill the background
and parts where the background is still visible.
These become clearer if you squint your eyes; note that they move to
the right. (Click on the Reload
button of your browser if the animation stops running.)
You can associate the two arrays of lines with waves that are
periodically black and white. Where they overlap the waves
interfere: they are in phase in the darker regions (positive interference)
and out of phase in the lighter regions (negative interference).
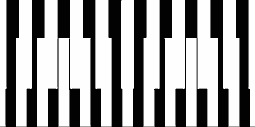
Here is a Javascript version of the group speed demo:
Press the Left or Right buttons on your computer to make it go. This Javascript
was written in p5.js
The lines move to the left. In other words, the waves have a
negative phase velocity c. However, the phase velocity is
different from the velocity of the interference pattern.
The interference pattern moves with the group
velocity cg, calculated as
cg = d(ck)/dk, with k the
horizontal wavenumber. This is the velocity of the lighter and darker
regions in the animation where the lines overlap(*).
In this example, the phase velocity c of the two waves is
c = -B/k2,
with k equal to 10 and 12, respectively, and
B some positive constant. This is the dispersion relation
(relative to the mean flow) of Rossby waves. Mid-latitude depressions
and meanders in the jet-stream are just two examples of geophysical
phenomena that can be understood as Rossby waves.
The phase velocity of Rossby waves is always negative
(westward). However, the group velocity
cg = B/k2 is always positive
(eastward). Even though Rossby waves move to the west relative to
the mean flow, localized perturbations (interference patterns of
several waves) move to the east. This is why perturbations that
originate over the
US or west-Atlantic can propagate eastward faster than the mean flow and
change weather conditions over Europe. This is called downstream
development.
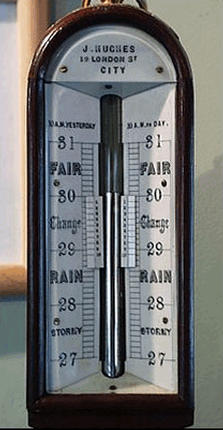 |
On the left is the display of an early Victorian marine barometer.
A Vernier scale(**) is used for accurate reading of the
air pressure. The units are in inches of mercury and the Vernier scale
allows accurate reading down to 1/100th of an inch, corresponding to
1/3rd of a millibar. The Vernier scale works on the same principle as
that of group velocity. It is a satisfying thought that the Vernier
scale enables accurate monitoring of pressure variations perhaps
associated with downstream development of Rossby waves.
|
(*) The group velocity of the discrete sum of two waves with wavenumbers
k1 and k2, with phase velocities
c1 and c2, equals
(c1k1-c2k2)/
(k1-k2), which approaches the
continuous expression when k1 approaches
k2.
(**) The Vernier scale derives its name from the
inventor, Paul Vernier (1580-1637),
a French mathematician, who described the device in
a tract on the Quadrant Nouveau de Math�matiques published in 1631.
(source: Oxford English Dictionary)
|