A simple illustration of how Doppler radar works
This animation shows the radar returns from 64 pulses from the 94GHz radar at Chilbolton in the UK. The size of the arrow tells you the amplitude of the radar return at that distance, and it's direction tells you the phase.
The arrow turns from pulse to pulse because of the Doppler effect - the particles are moving towards the radar and so the phase from their reflection keeps changing.
A plot of the phases of each of these pulses is shown here:
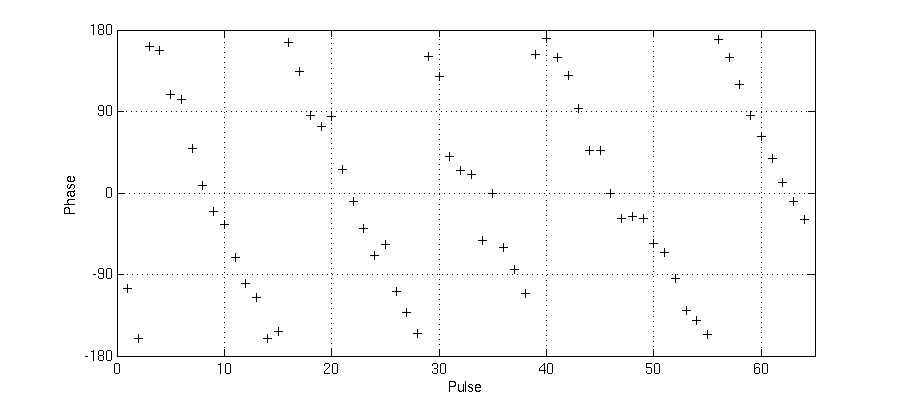
You can see the ice particles in this cloud are moving towards the radar, leading to a fairly constant (on average) rate of change of phase. The slope of the graph tells you the mean Doppler velocity. In this case it takes about 16 pulses to change phase by 360 degrees. This corresponds to the ice crystal moving half a wavelength (1.6mm for this radar) so the particles are moving 0.1mm per pulse. There are 6250 pulses per second, so the crystals are moving at a speed of 0.625m/s in this case.
The length of the arrow tells you the size of the electric field at the antenna, which is the sum of all of the echoes from the particles which you are sampling. The amplitude fluctuates because the particles are in random positions relative to each other in the volume. As the particles fall at different speeds, or are jiggled around by turbulence, their relative positions change by a fraction of a wavelength, and so the reflections from different particles interfere constructively or destructively at the antenna. The rate of rotation is not constant for the same reason.
This is why we need to take many samples (many pulses) to measure clouds and precipitation using radar, so we can estimate the average rate of change to get the Doppler velocity, and measure the average length of the arrow to get the overall radar reflectivity - a single pulse gives you no useful information.
Doing this analysis for every range gate, and recalculating the velocity continuously, we can then make plots like this:
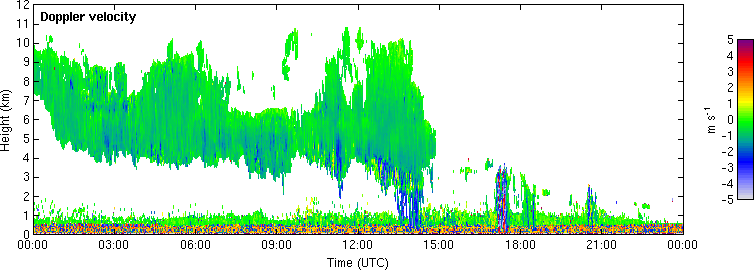
The data in the animation was a subset of 64 pulses collected at 0600 UTC at 5km height on this plot. This radar points vertically, and the deep cloud between 4-9km is a cirro/alto-stratus layer, with ice particles falling at velocities of 0.5-1m/s typically. You can also see a light rain shower extending below this at around 1400 UTC, and some shallower showers later on: raindrops fall much faster than ice particles, in this case around 3-5m/s. The radar is also picking up flying insects in the boundary layer (<1km) - these approximately trace the vertical air motion, and have a mean velocity of around zero here.