Thursday 05/10/2017
Heat redistribution and the warming slowdown
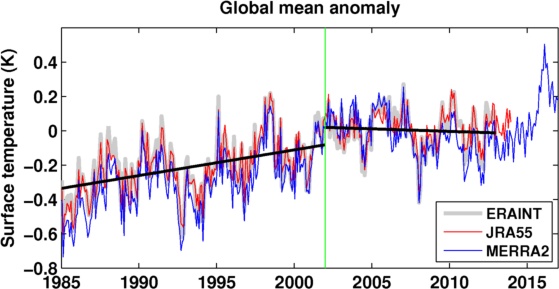
Fig. 1: Deseasonalized global area mean surface temperature (Ts) anomaly time series. Data reference period is from 2001-2008.
Two periods are defined:
- Ts rising period 1985-2001.
- Ts slowdown (decrease) period 2002-2012.
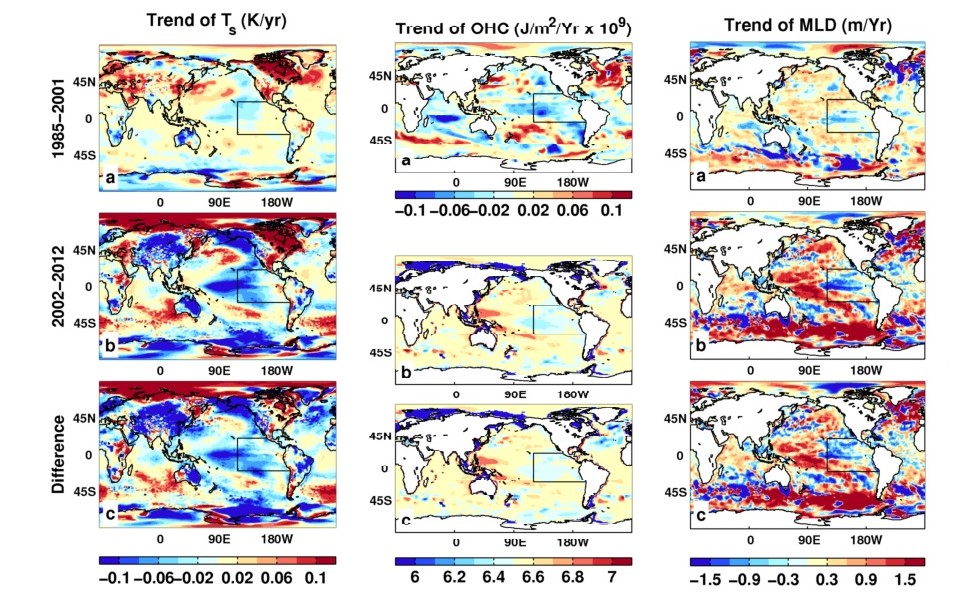
Fig. 2: Trend over two periods (1985-2001 and 2002-2012) and their differences (2002-2012 minus 1985-2001) for Ts, ocean hean content (OHC) and mixing layer depth (MLD)
- The trends are significantly different between two periods
- Ts is from ERAINT, and OHC and MLD from ECMWF ocean reanalysis ORAS4.
- Ts trend increases from south to north in second period, but OHC and MLD show increase in opposite direction.
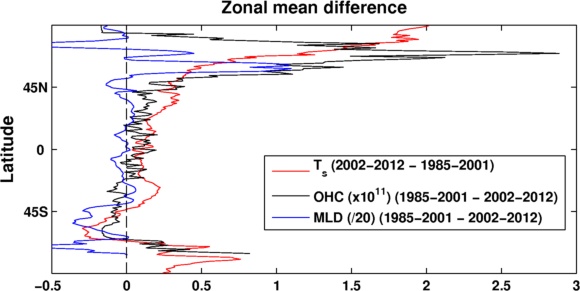
Fig. 3: Differences of zonal means from two periods for Ts, OHC and MLD
- Ts increases from south to north, with substantial increases at high latitudes of northern hemisphere
- Note: the differences for OHC and MLD are 1985-2001 minus 2002-2012 for comparison.
- Three curves are more or less consistent, implying the relationship between them.
The following mechanism may be proposed
- When there is more OHC at 50oS over 2002-2012, means more heat into the ocean, implying the MLD will be deeper, so cooling Ts
- When there is less OHC at the high latitudes of northern hemisphere over 2002-2012, means more heat stayed near the surface, implying the MLD will be shallow, so warming the surface.

Fig. 4: Zonal mean net surface heat flux (FT and Fs) differences (2002-2012 minus 1985-2001).
- Less heat to the tropical area in the second period, more heat into the ocean at other latitudes.
- Less heat to the tropical area, more heat into the ocean at other latitudes.
- This distribution cannot explain the Ts
distribution.
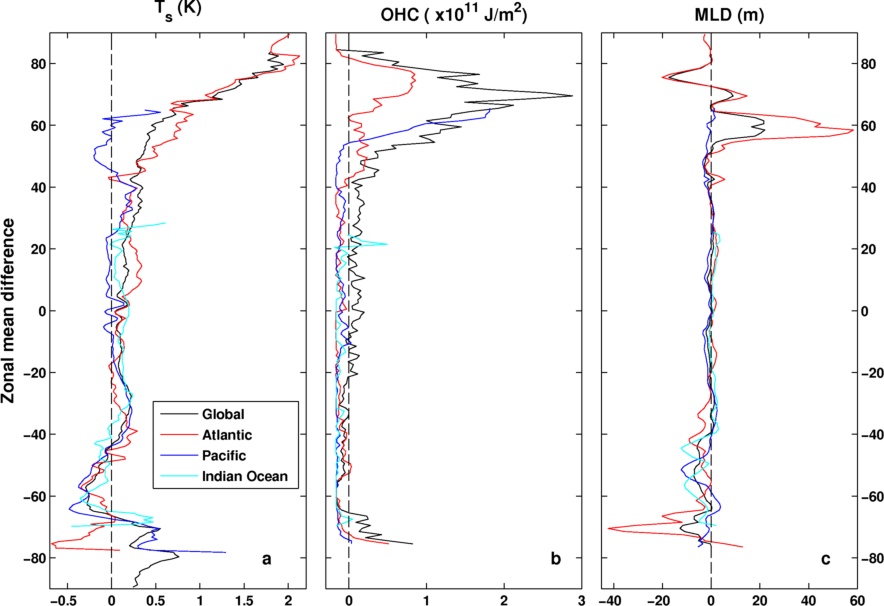
Fig. 5: Basin contributions to the zonal mean differences of Ts, OHC and MLD.
- Please note: the differences for OHC and MLD are 1985-2001 minus 2002-2012 for comparison.
- As expected, the Atlantic change dominates the meridional variability.
- It may be true the ocean reanalysis near the pole is not reliable.
Summary
It looks like the air-sea interaction is responsible for the Ts variability. Heat spatial redistribution in the ocean mixing layer may be the key for the warming slowdown, rather than what happened in the atmosphere.