The download provided here is a basic demo of the calculated return period plots. It's a ZIP containing an MS Windows exec that will also run under Linux/Wine.
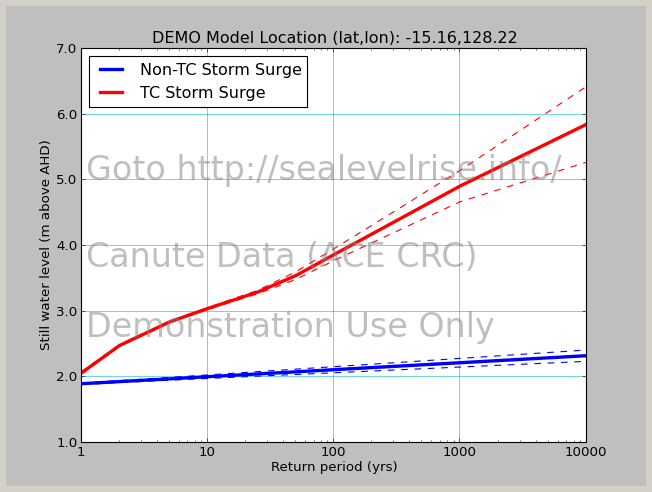
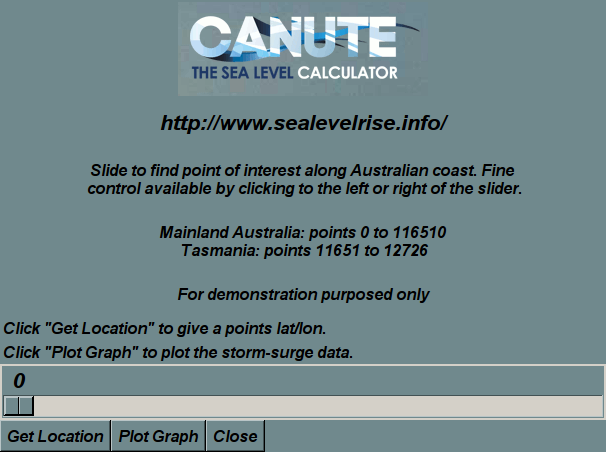
On start up you will be presented with the following interface. Move the slider, then click on Get Location to return the assocated lat/lon (I know, a bit clunky). Then click on Plot Graph. This will provide a plot (example below) of two return-period calculations for that location (Non tropical-cyclone relatesd storm surge, and tropical cyclone (TC) related events)
An example from northern WA (Google Maps) showing a location dominated by TCs.