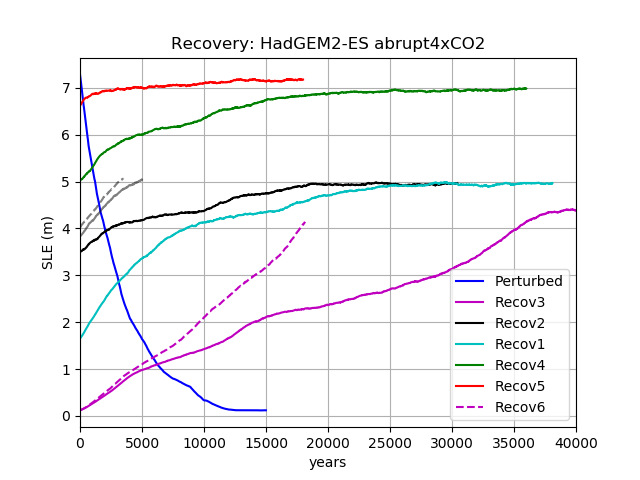
Abrupt4xCO2 recovery:
Simulations are still running. Dotted magenta is recovery with highest albedo option. This seems to be accelerating, suggesting it will pass the intermediate stage and fully recover (see below).
The grey lines are sensitivity studies. Dotted variant has already passed intermediate mass. Solid grey is ongoing; perhaps will stabilise. Either way, the black line is indicative of the limits to recovery (in this albedo regime).
Recovery 4 (green) has been continued on further, but shows no sign of fully recovering. This is essentially the southern dome; red recovers because it wasn't gone in the start dump.
So, this is a third-ish stable state; large ice-sheet, covering most of Greenland, but without the saddle/dome structure in the south (I guess it may recover after a long time).
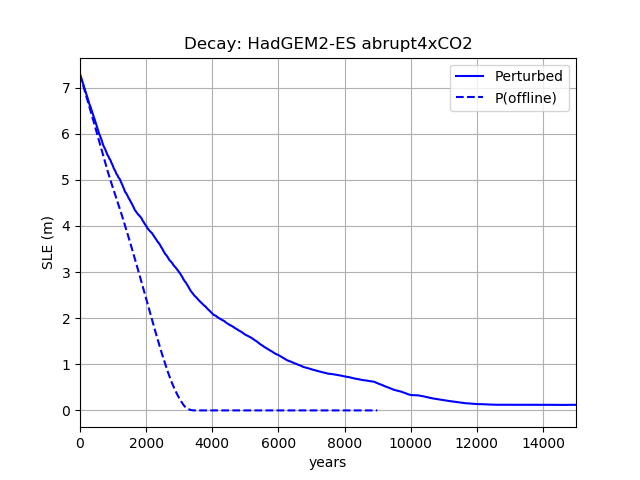
Abrupt4xCO2 recovery from minimal state.
The smooth overlay curve is an offline (ice-sheet) simulation, with present day forcing (i.e., SMB forcing from present day forcing with full ice-sheet). This did not recover fully.
The offline run needs to be repeated with the higher albedo scenario.
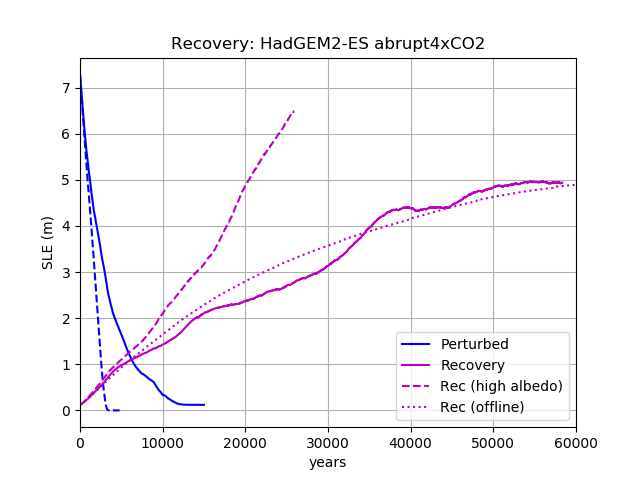
The dotted blue line is the offline 4xCO2 run. Same model setup as JMG original (no inland sea param). Zoom in here:
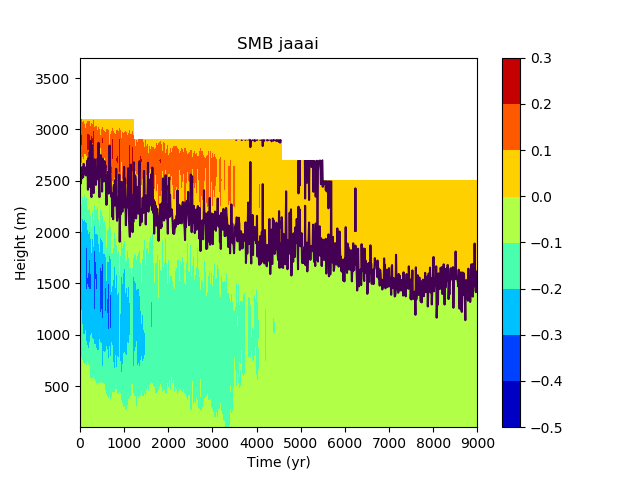
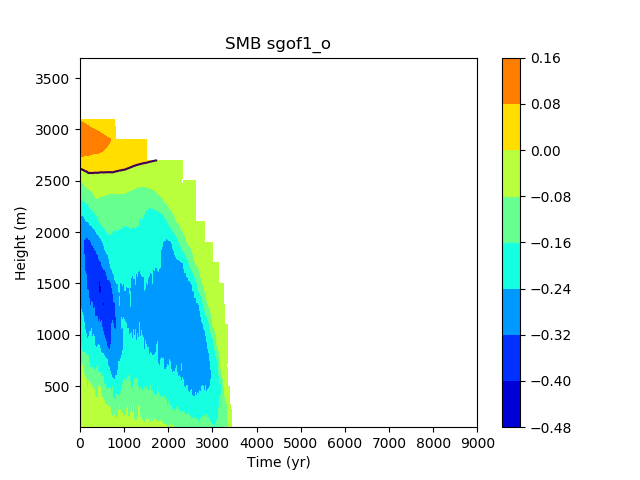
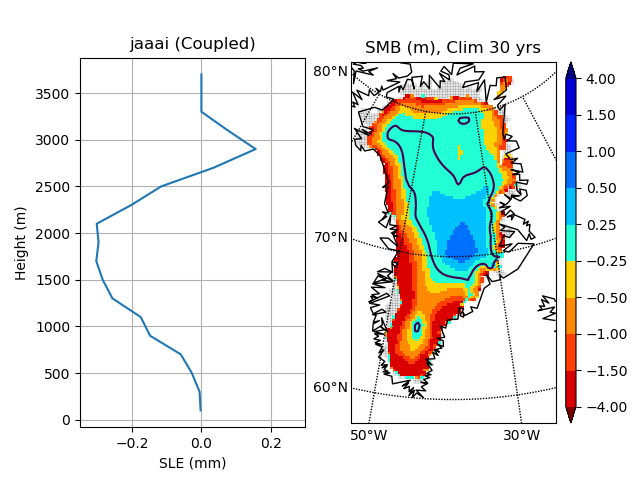
SMB with time (clim:300)

A 100(0) years later:
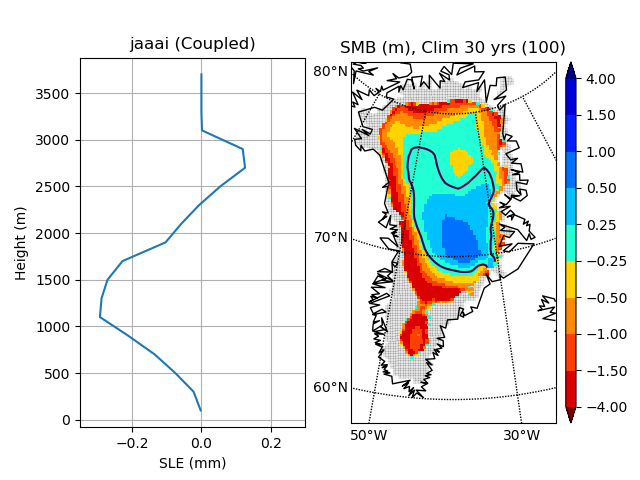
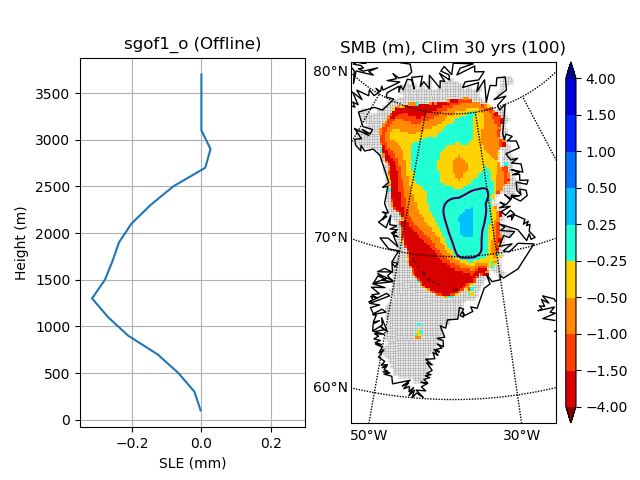
Hovmöller type plots of SMB evolution. With feedback, the positive SMB level drops to lower elevations.