
Click here for model configuration details.
Click here for coverage and difference plots.
Click here for freshwater/salinity adjustment.
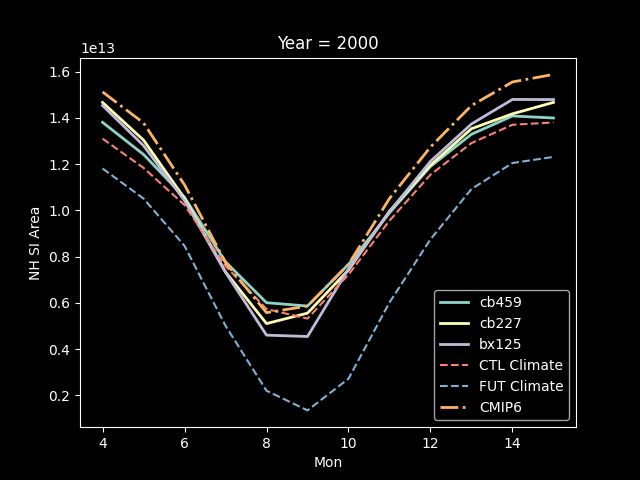
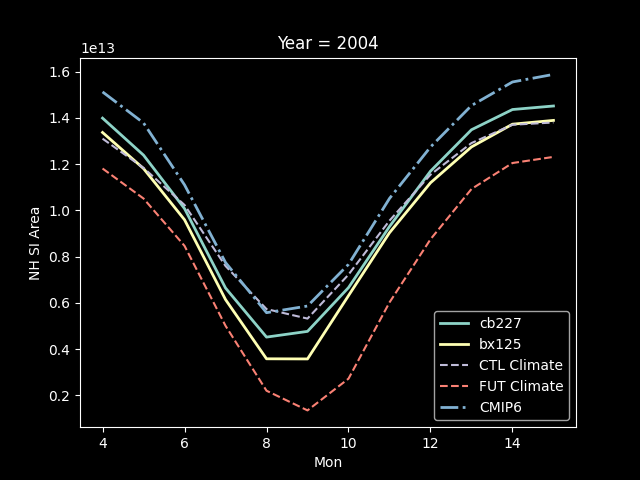
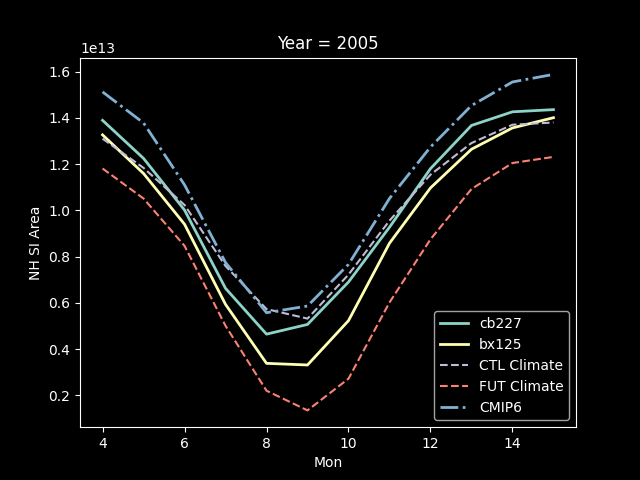
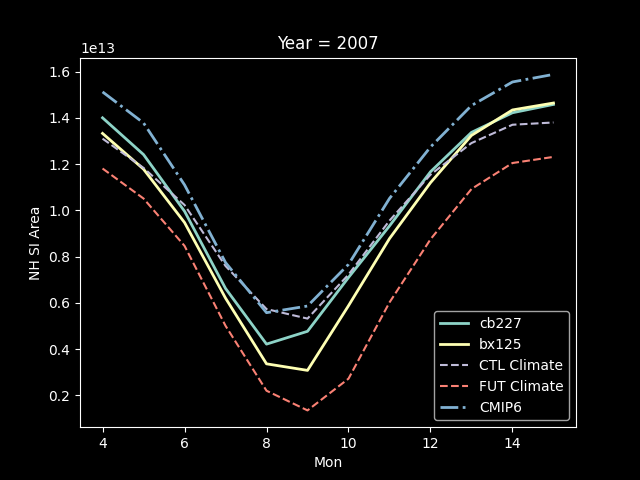
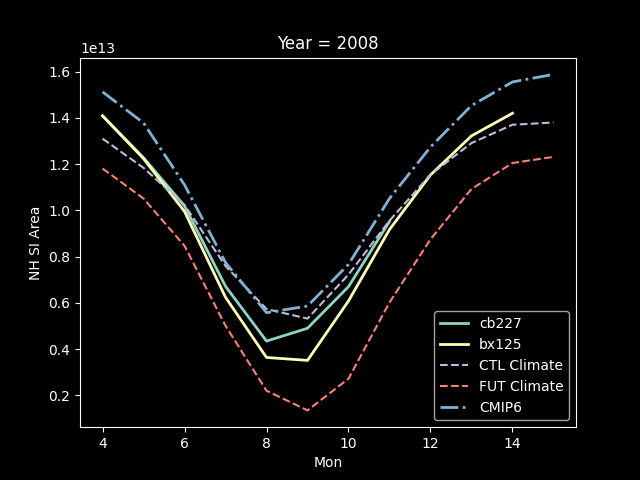
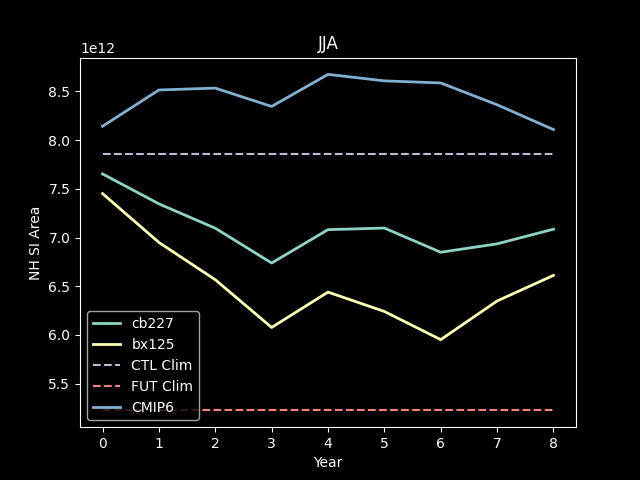
The model seems a tad too relaxed with its relaxation. As per Smith et al, 2019, the ice relaxes back towards climatology with a timescale of two months. The year 2000 plot (below) includes data from cb459 (which has a 24-hour relaxation). As would be expected, this agrees with the climatology a lot better.
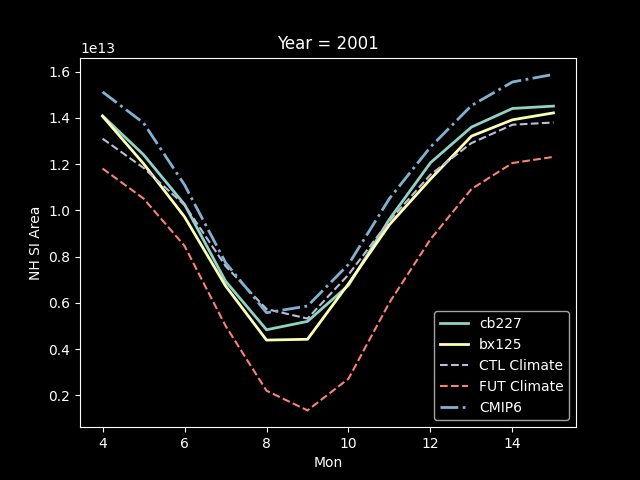
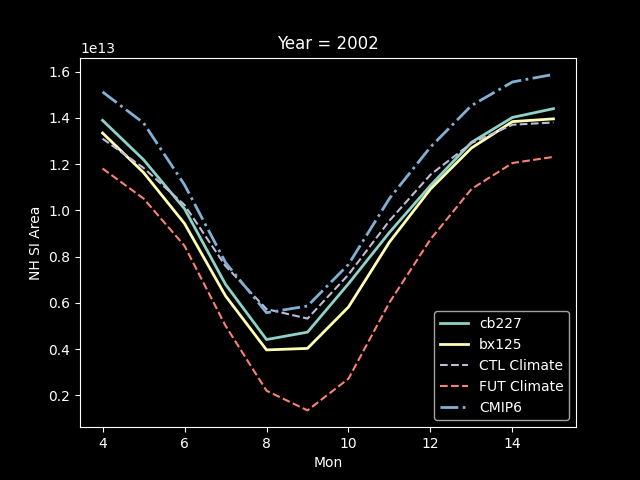
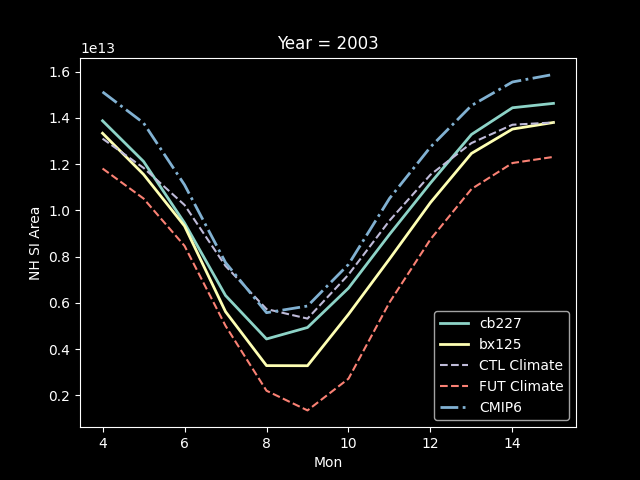
NOTE: The relaxation climatologies are monthly.
| Year | Plot | Year | Plot | Year | Plot |
|---|---|---|---|---|---|
| 2000 | |
2001 | |
2002 | |
| 2003 | |
2004 | |
2005 | |
| 2006 | |
2007 | |
2008 | |
 Steve George | s.e.george@reading.ac.u
k | steve.george@ncas.ac.uk
Steve George | s.e.george@reading.ac.u
k | steve.george@ncas.ac.uk