Colour Tephigram
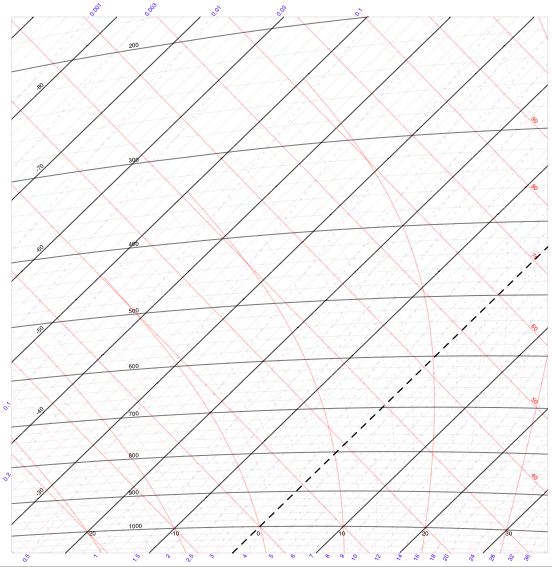
See Chapter 6 and Appendix C in Thermal Physics of the Atmosphere if you want to know more about the construction and use of tephigrams and skewT-logp diagrams.
Feel free to use this colour tephigram. Click on the image to download the
pdf file (62K). At the bottom of this webpage you can
find monochrome black and green versions as well. The calculations for the pseuso-adiabats in this tephigram are based on
Bolton, Mon. Wea. Rev., 108, 1046-1053 (1980).
Update: I have now also produced a tephigram more suitable for the lower atmosphere as well as a tephigram with a higher resolution in the vertical. For both new versions, see the download list below.
Any suggestions to improve the tephigram are gratefully received. Note that the purpose
here is to give a tephigram that can be printed on an A4 printer
with enough range to be useful in both the tropics and the
midlatitudes.
With some additional effort I can construct the analogous skewT-logp diagrams. Send me an email to express your interest; if I get enough votes I'll do that as well.
These tephigrams were made
with gnuplot.
 |
|
|
|
|
| colour | black | green | Lower troposphere | High res. |