EOF analysis in meteorology
For a review on the (mis-)use of EOFs in atmospheric science see: Monahan, A. H., J. C. Fyfe, M. H. P. Ambaum, D. B. Stephenson, and G. R. North, 2009: Empirical Orthogonal Functions: the medium is the message. J. Clim., 22, 6501-6514 (reprint available here).
The short note below contains a worked out recipe if you
want to perform an EOF analysis on your data. Special attention
is paid to the normalization of EOFs and their time-series. I
have not included a discussion on the use and interpretation of
EOFs. This can be a confusing matter and a real snakepit if you
get deeper into it (our 2001 paper in the Journal of Climate
discusses some of the issues). So use the recipe below at your peril. It
contains all the maths you need to do the analysis but does not
cover all the details in the interest of brevity.
 Note on EOF analysis (83K)
Do send me comments or questions if you think I have skipped
something essential or if you spotted an error. Thanks!
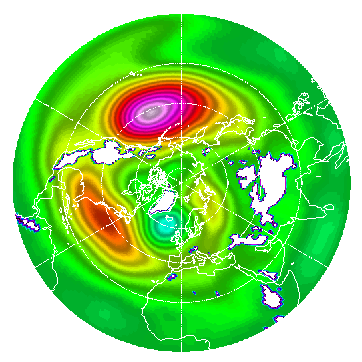
First EOF of monthly mean winter (DJFM) streamfunction at
850hPa. It is dominated by a PNA shaped pattern but the
variance produced by the North Atlantic storm-track is also
visible as part of this EOF. This is a common feature of EOFs:
they show the gravest possible patterns consistent with the
variance in the field. (From Ambaum, M. H. P., B. J. Hoskins,
and D. B. Stephenson, 2001: Arctic Oscillation or North Atlantic
Oscillation? J. Clim., 14, 3495-3507, reprint available here)