Storm
Offset
Variable
Cut
Slice
Component
Plot 1
Composite
Storm 1
Storm 2
Storm 3
Storm 4
Storm 5
Storm 6
Storm 7
Storm 8
Storm 9
Storm 10
Storm 11
Storm 12
Storm 13
Storm 14
Storm 15
Storm 16
Storm 17
Storm 18
Storm 19
Storm 20
Storm 21
Storm 22
Storm 23
Storm 24
Storm 25
Storm 26
Storm 27
Storm 28
Storm 29
Storm 30
Storm 31
Storm 32
Storm 33
Storm 34
Storm 35
Storm 36
Storm 37
Storm 38
Storm 39
Storm 40
Storm 41
Storm 42
Storm 43
Storm 44
Storm 45
Storm 46
Storm 47
Storm 48
Storm 49
Storm 50
Storm 51
Storm 52
Storm 53
Storm 54
Storm 55
Storm 56
Storm 57
Storm 58
Storm 59
Storm 60
Storm 61
Storm 62
Storm 63
Storm 64
Storm 65
Storm 66
Storm 67
Storm 68
Storm 69
Storm 70
Storm 71
Storm 72
Storm 73
Storm 74
Storm 75
Storm 76
Storm 77
Storm 78
Storm 79
Storm 80
Storm 81
Storm 82
Storm 83
Storm 84
Storm 85
Storm 86
Storm 87
Storm 88
Storm 89
Storm 90
Storm 91
Storm 92
Storm 93
Storm 94
Storm 95
Storm 96
Storm 97
Storm 98
Storm 99
Storm 100
Storm 101
Storm 102
Storm 103
Storm 104
Storm 105
Storm 106
Storm 107
Storm 108
Storm 109
Storm 110
Storm 111
Storm 112
Storm 113
Storm 114
Storm 115
Storm 116
Storm 117
Storm 118
Storm 119
Storm 120
Storm 121
Storm 122
Storm 123
Storm 124
Storm 125
Storm 126
Storm 127
Storm 128
Storm 129
Storm 130
Storm 131
Storm 132
Storm 133
Storm 134
Storm 135
Storm 136
Storm 137
Storm 138
Storm 139
Storm 140
Storm 141
Storm 142
Storm 143
Storm 144
Storm 145
Storm 146
Storm 147
Storm 148
Storm 149
Storm 150
Storm 151
Storm 152
Storm 153
Storm 154
Storm 155
Storm 156
Storm 157
Storm 158
Storm 159
Storm 160
Storm 161
Storm 162
Storm 163
Storm 164
Storm 165
Storm 166
Storm 167
Storm 168
Storm 169
Storm 170
Storm 171
Storm 172
Storm 173
Storm 174
Storm 175
Storm 176
Storm 177
Storm 178
Storm 179
Storm 180
Storm 181
Storm 182
Storm 183
Storm 184
Storm 185
Storm 186
Storm 187
Storm 188
Storm 189
Storm 190
Storm 191
Storm 192
Storm 193
Storm 194
Storm 195
Storm 196
Storm 197
Storm 198
Storm 199
Storm 200
-72hrs
-60hrs
-48hrs
-36hrs
-24hrs
-12hrs
0hrs
+12hrs
+24hrs
+36hrs
+48hrs
Cloud cover
Divergence
Geopotential
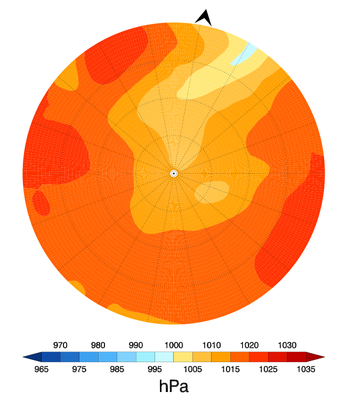
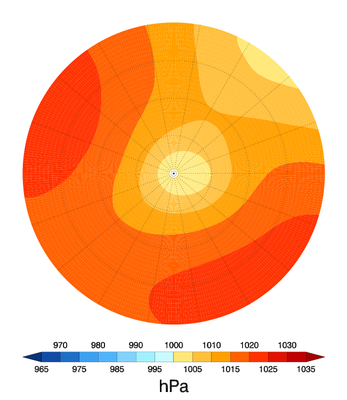
MSLP
Pressure
Relative humidity
Rel' vort'
Temperature
Θe
Vertical velocity
Absolute wind
SR wind
Chart
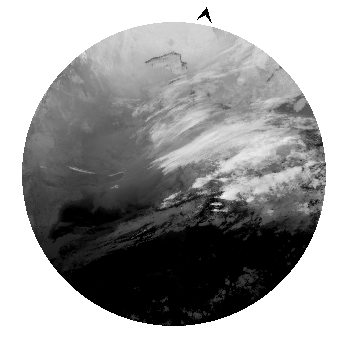
Satellite
Track map
horiz' P
vert'
High
Middle
Low
200hPa
300hPa
400hPa
500hPa
600hPa
700hPa
850hPa
925hPa
395K
350K
330k
315k
300k
285k
275k
265k
CCB
Back-front
Fronts
Dry slot
Left-right
WCB
Speed
u
v
Plot 2
Composite
Storm 1
Storm 2
Storm 3
Storm 4
Storm 5
Storm 6
Storm 7
Storm 8
Storm 9
Storm 10
Storm 11
Storm 12
Storm 13
Storm 14
Storm 15
Storm 16
Storm 17
Storm 18
Storm 19
Storm 20
Storm 21
Storm 22
Storm 23
Storm 24
Storm 25
Storm 26
Storm 27
Storm 28
Storm 29
Storm 30
Storm 31
Storm 32
Storm 33
Storm 34
Storm 35
Storm 36
Storm 37
Storm 38
Storm 39
Storm 40
Storm 41
Storm 42
Storm 43
Storm 44
Storm 45
Storm 46
Storm 47
Storm 48
Storm 49
Storm 50
Storm 51
Storm 52
Storm 53
Storm 54
Storm 55
Storm 56
Storm 57
Storm 58
Storm 59
Storm 60
Storm 61
Storm 62
Storm 63
Storm 64
Storm 65
Storm 66
Storm 67
Storm 68
Storm 69
Storm 70
Storm 71
Storm 72
Storm 73
Storm 74
Storm 75
Storm 76
Storm 77
Storm 78
Storm 79
Storm 80
Storm 81
Storm 82
Storm 83
Storm 84
Storm 85
Storm 86
Storm 87
Storm 88
Storm 89
Storm 90
Storm 91
Storm 92
Storm 93
Storm 94
Storm 95
Storm 96
Storm 97
Storm 98
Storm 99
Storm 100
Storm 101
Storm 102
Storm 103
Storm 104
Storm 105
Storm 106
Storm 107
Storm 108
Storm 109
Storm 110
Storm 111
Storm 112
Storm 113
Storm 114
Storm 115
Storm 116
Storm 117
Storm 118
Storm 119
Storm 120
Storm 121
Storm 122
Storm 123
Storm 124
Storm 125
Storm 126
Storm 127
Storm 128
Storm 129
Storm 130
Storm 131
Storm 132
Storm 133
Storm 134
Storm 135
Storm 136
Storm 137
Storm 138
Storm 139
Storm 140
Storm 141
Storm 142
Storm 143
Storm 144
Storm 145
Storm 146
Storm 147
Storm 148
Storm 149
Storm 150
Storm 151
Storm 152
Storm 153
Storm 154
Storm 155
Storm 156
Storm 157
Storm 158
Storm 159
Storm 160
Storm 161
Storm 162
Storm 163
Storm 164
Storm 165
Storm 166
Storm 167
Storm 168
Storm 169
Storm 170
Storm 171
Storm 172
Storm 173
Storm 174
Storm 175
Storm 176
Storm 177
Storm 178
Storm 179
Storm 180
Storm 181
Storm 182
Storm 183
Storm 184
Storm 185
Storm 186
Storm 187
Storm 188
Storm 189
Storm 190
Storm 191
Storm 192
Storm 193
Storm 194
Storm 195
Storm 196
Storm 197
Storm 198
Storm 199
Storm 200
-72hrs
-60hrs
-48hrs
-36hrs
-24hrs
-12hrs
0hrs
+12hrs
+24hrs
+36hrs
+48hrs
Cloud cover
Divergence
Geopotential
MSLP
Pressure
Relative humidity
Rel' vort'
Temperature
Θe
Vertical velocity
Absolute wind
SR wind
Chart
Satellite
Track map
horiz' P
vert'
High
Middle
Low
200hPa
300hPa
400hPa
500hPa
600hPa
700hPa
850hPa
925hPa
395K
350K
330k
315k
300k
285k
275k
265k
CCB
Back-front
Fronts
Dry slot
Left-right
WCB
Speed
u
v
Plot 3
Composite
Storm 1
Storm 2
Storm 3
Storm 4
Storm 5
Storm 6
Storm 7
Storm 8
Storm 9
Storm 10
Storm 11
Storm 12
Storm 13
Storm 14
Storm 15
Storm 16
Storm 17
Storm 18
Storm 19
Storm 20
Storm 21
Storm 22
Storm 23
Storm 24
Storm 25
Storm 26
Storm 27
Storm 28
Storm 29
Storm 30
Storm 31
Storm 32
Storm 33
Storm 34
Storm 35
Storm 36
Storm 37
Storm 38
Storm 39
Storm 40
Storm 41
Storm 42
Storm 43
Storm 44
Storm 45
Storm 46
Storm 47
Storm 48
Storm 49
Storm 50
Storm 51
Storm 52
Storm 53
Storm 54
Storm 55
Storm 56
Storm 57
Storm 58
Storm 59
Storm 60
Storm 61
Storm 62
Storm 63
Storm 64
Storm 65
Storm 66
Storm 67
Storm 68
Storm 69
Storm 70
Storm 71
Storm 72
Storm 73
Storm 74
Storm 75
Storm 76
Storm 77
Storm 78
Storm 79
Storm 80
Storm 81
Storm 82
Storm 83
Storm 84
Storm 85
Storm 86
Storm 87
Storm 88
Storm 89
Storm 90
Storm 91
Storm 92
Storm 93
Storm 94
Storm 95
Storm 96
Storm 97
Storm 98
Storm 99
Storm 100
Storm 101
Storm 102
Storm 103
Storm 104
Storm 105
Storm 106
Storm 107
Storm 108
Storm 109
Storm 110
Storm 111
Storm 112
Storm 113
Storm 114
Storm 115
Storm 116
Storm 117
Storm 118
Storm 119
Storm 120
Storm 121
Storm 122
Storm 123
Storm 124
Storm 125
Storm 126
Storm 127
Storm 128
Storm 129
Storm 130
Storm 131
Storm 132
Storm 133
Storm 134
Storm 135
Storm 136
Storm 137
Storm 138
Storm 139
Storm 140
Storm 141
Storm 142
Storm 143
Storm 144
Storm 145
Storm 146
Storm 147
Storm 148
Storm 149
Storm 150
Storm 151
Storm 152
Storm 153
Storm 154
Storm 155
Storm 156
Storm 157
Storm 158
Storm 159
Storm 160
Storm 161
Storm 162
Storm 163
Storm 164
Storm 165
Storm 166
Storm 167
Storm 168
Storm 169
Storm 170
Storm 171
Storm 172
Storm 173
Storm 174
Storm 175
Storm 176
Storm 177
Storm 178
Storm 179
Storm 180
Storm 181
Storm 182
Storm 183
Storm 184
Storm 185
Storm 186
Storm 187
Storm 188
Storm 189
Storm 190
Storm 191
Storm 192
Storm 193
Storm 194
Storm 195
Storm 196
Storm 197
Storm 198
Storm 199
Storm 200
-72hrs
-60hrs
-48hrs
-36hrs
-24hrs
-12hrs
0hrs
+12hrs
+24hrs
+36hrs
+48hrs
Cloud cover
Divergence
Geopotential
MSLP
Pressure
Relative humidity
Rel' vort'
Temperature
Θe
Vertical velocity
Absolute wind
SR wind
Chart
Satellite
Track map
horiz' P
vert'
High
Middle
Low
200hPa
300hPa
400hPa
500hPa
600hPa
700hPa
850hPa
925hPa
395K
350K
330k
315k
300k
285k
275k
265k
CCB
Back-front
Fronts
Dry slot
Left-right
WCB
Speed
u
v
Plot 4
Composite
Storm 1
Storm 2
Storm 3
Storm 4
Storm 5
Storm 6
Storm 7
Storm 8
Storm 9
Storm 10
Storm 11
Storm 12
Storm 13
Storm 14
Storm 15
Storm 16
Storm 17
Storm 18
Storm 19
Storm 20
Storm 21
Storm 22
Storm 23
Storm 24
Storm 25
Storm 26
Storm 27
Storm 28
Storm 29
Storm 30
Storm 31
Storm 32
Storm 33
Storm 34
Storm 35
Storm 36
Storm 37
Storm 38
Storm 39
Storm 40
Storm 41
Storm 42
Storm 43
Storm 44
Storm 45
Storm 46
Storm 47
Storm 48
Storm 49
Storm 50
Storm 51
Storm 52
Storm 53
Storm 54
Storm 55
Storm 56
Storm 57
Storm 58
Storm 59
Storm 60
Storm 61
Storm 62
Storm 63
Storm 64
Storm 65
Storm 66
Storm 67
Storm 68
Storm 69
Storm 70
Storm 71
Storm 72
Storm 73
Storm 74
Storm 75
Storm 76
Storm 77
Storm 78
Storm 79
Storm 80
Storm 81
Storm 82
Storm 83
Storm 84
Storm 85
Storm 86
Storm 87
Storm 88
Storm 89
Storm 90
Storm 91
Storm 92
Storm 93
Storm 94
Storm 95
Storm 96
Storm 97
Storm 98
Storm 99
Storm 100
Storm 101
Storm 102
Storm 103
Storm 104
Storm 105
Storm 106
Storm 107
Storm 108
Storm 109
Storm 110
Storm 111
Storm 112
Storm 113
Storm 114
Storm 115
Storm 116
Storm 117
Storm 118
Storm 119
Storm 120
Storm 121
Storm 122
Storm 123
Storm 124
Storm 125
Storm 126
Storm 127
Storm 128
Storm 129
Storm 130
Storm 131
Storm 132
Storm 133
Storm 134
Storm 135
Storm 136
Storm 137
Storm 138
Storm 139
Storm 140
Storm 141
Storm 142
Storm 143
Storm 144
Storm 145
Storm 146
Storm 147
Storm 148
Storm 149
Storm 150
Storm 151
Storm 152
Storm 153
Storm 154
Storm 155
Storm 156
Storm 157
Storm 158
Storm 159
Storm 160
Storm 161
Storm 162
Storm 163
Storm 164
Storm 165
Storm 166
Storm 167
Storm 168
Storm 169
Storm 170
Storm 171
Storm 172
Storm 173
Storm 174
Storm 175
Storm 176
Storm 177
Storm 178
Storm 179
Storm 180
Storm 181
Storm 182
Storm 183
Storm 184
Storm 185
Storm 186
Storm 187
Storm 188
Storm 189
Storm 190
Storm 191
Storm 192
Storm 193
Storm 194
Storm 195
Storm 196
Storm 197
Storm 198
Storm 199
Storm 200
-72hrs
-60hrs
-48hrs
-36hrs
-24hrs
-12hrs
0hrs
+12hrs
+24hrs
+36hrs
+48hrs
Cloud cover
Divergence
Geopotential
MSLP
Pressure
Relative humidity
Rel' vort'
Temperature
Θe
Vertical velocity
Absolute wind
SR wind
Chart
Satellite
Track map
horiz' P
vert'
High
Middle
Low
200hPa
300hPa
400hPa
500hPa
600hPa
700hPa
850hPa
925hPa
395K
350K
330k
315k
300k
285k
275k
265k
CCB
Back-front
Fronts
Dry slot
Left-right
WCB
Speed
u
v
Plot 5
Composite
Storm 1
Storm 2
Storm 3
Storm 4
Storm 5
Storm 6
Storm 7
Storm 8
Storm 9
Storm 10
Storm 11
Storm 12
Storm 13
Storm 14
Storm 15
Storm 16
Storm 17
Storm 18
Storm 19
Storm 20
Storm 21
Storm 22
Storm 23
Storm 24
Storm 25
Storm 26
Storm 27
Storm 28
Storm 29
Storm 30
Storm 31
Storm 32
Storm 33
Storm 34
Storm 35
Storm 36
Storm 37
Storm 38
Storm 39
Storm 40
Storm 41
Storm 42
Storm 43
Storm 44
Storm 45
Storm 46
Storm 47
Storm 48
Storm 49
Storm 50
Storm 51
Storm 52
Storm 53
Storm 54
Storm 55
Storm 56
Storm 57
Storm 58
Storm 59
Storm 60
Storm 61
Storm 62
Storm 63
Storm 64
Storm 65
Storm 66
Storm 67
Storm 68
Storm 69
Storm 70
Storm 71
Storm 72
Storm 73
Storm 74
Storm 75
Storm 76
Storm 77
Storm 78
Storm 79
Storm 80
Storm 81
Storm 82
Storm 83
Storm 84
Storm 85
Storm 86
Storm 87
Storm 88
Storm 89
Storm 90
Storm 91
Storm 92
Storm 93
Storm 94
Storm 95
Storm 96
Storm 97
Storm 98
Storm 99
Storm 100
Storm 101
Storm 102
Storm 103
Storm 104
Storm 105
Storm 106
Storm 107
Storm 108
Storm 109
Storm 110
Storm 111
Storm 112
Storm 113
Storm 114
Storm 115
Storm 116
Storm 117
Storm 118
Storm 119
Storm 120
Storm 121
Storm 122
Storm 123
Storm 124
Storm 125
Storm 126
Storm 127
Storm 128
Storm 129
Storm 130
Storm 131
Storm 132
Storm 133
Storm 134
Storm 135
Storm 136
Storm 137
Storm 138
Storm 139
Storm 140
Storm 141
Storm 142
Storm 143
Storm 144
Storm 145
Storm 146
Storm 147
Storm 148
Storm 149
Storm 150
Storm 151
Storm 152
Storm 153
Storm 154
Storm 155
Storm 156
Storm 157
Storm 158
Storm 159
Storm 160
Storm 161
Storm 162
Storm 163
Storm 164
Storm 165
Storm 166
Storm 167
Storm 168
Storm 169
Storm 170
Storm 171
Storm 172
Storm 173
Storm 174
Storm 175
Storm 176
Storm 177
Storm 178
Storm 179
Storm 180
Storm 181
Storm 182
Storm 183
Storm 184
Storm 185
Storm 186
Storm 187
Storm 188
Storm 189
Storm 190
Storm 191
Storm 192
Storm 193
Storm 194
Storm 195
Storm 196
Storm 197
Storm 198
Storm 199
Storm 200
-72hrs
-60hrs
-48hrs
-36hrs
-24hrs
-12hrs
0hrs
+12hrs
+24hrs
+36hrs
+48hrs
Cloud cover
Divergence
Geopotential
MSLP
Pressure
Relative humidity
Rel' vort'
Temperature
Θe
Vertical velocity
Absolute wind
SR wind
Chart
Satellite
Track map
horiz' P
vert'
High
Middle
Low
200hPa
300hPa
400hPa
500hPa
600hPa
700hPa
850hPa
925hPa
395K
350K
330k
315k
300k
285k
275k
265k
CCB
Back-front
Fronts
Dry slot
Left-right
WCB
Speed
u
v
Plot 6
Composite
Storm 1
Storm 2
Storm 3
Storm 4
Storm 5
Storm 6
Storm 7
Storm 8
Storm 9
Storm 10
Storm 11
Storm 12
Storm 13
Storm 14
Storm 15
Storm 16
Storm 17
Storm 18
Storm 19
Storm 20
Storm 21
Storm 22
Storm 23
Storm 24
Storm 25
Storm 26
Storm 27
Storm 28
Storm 29
Storm 30
Storm 31
Storm 32
Storm 33
Storm 34
Storm 35
Storm 36
Storm 37
Storm 38
Storm 39
Storm 40
Storm 41
Storm 42
Storm 43
Storm 44
Storm 45
Storm 46
Storm 47
Storm 48
Storm 49
Storm 50
Storm 51
Storm 52
Storm 53
Storm 54
Storm 55
Storm 56
Storm 57
Storm 58
Storm 59
Storm 60
Storm 61
Storm 62
Storm 63
Storm 64
Storm 65
Storm 66
Storm 67
Storm 68
Storm 69
Storm 70
Storm 71
Storm 72
Storm 73
Storm 74
Storm 75
Storm 76
Storm 77
Storm 78
Storm 79
Storm 80
Storm 81
Storm 82
Storm 83
Storm 84
Storm 85
Storm 86
Storm 87
Storm 88
Storm 89
Storm 90
Storm 91
Storm 92
Storm 93
Storm 94
Storm 95
Storm 96
Storm 97
Storm 98
Storm 99
Storm 100
Storm 101
Storm 102
Storm 103
Storm 104
Storm 105
Storm 106
Storm 107
Storm 108
Storm 109
Storm 110
Storm 111
Storm 112
Storm 113
Storm 114
Storm 115
Storm 116
Storm 117
Storm 118
Storm 119
Storm 120
Storm 121
Storm 122
Storm 123
Storm 124
Storm 125
Storm 126
Storm 127
Storm 128
Storm 129
Storm 130
Storm 131
Storm 132
Storm 133
Storm 134
Storm 135
Storm 136
Storm 137
Storm 138
Storm 139
Storm 140
Storm 141
Storm 142
Storm 143
Storm 144
Storm 145
Storm 146
Storm 147
Storm 148
Storm 149
Storm 150
Storm 151
Storm 152
Storm 153
Storm 154
Storm 155
Storm 156
Storm 157
Storm 158
Storm 159
Storm 160
Storm 161
Storm 162
Storm 163
Storm 164
Storm 165
Storm 166
Storm 167
Storm 168
Storm 169
Storm 170
Storm 171
Storm 172
Storm 173
Storm 174
Storm 175
Storm 176
Storm 177
Storm 178
Storm 179
Storm 180
Storm 181
Storm 182
Storm 183
Storm 184
Storm 185
Storm 186
Storm 187
Storm 188
Storm 189
Storm 190
Storm 191
Storm 192
Storm 193
Storm 194
Storm 195
Storm 196
Storm 197
Storm 198
Storm 199
Storm 200
-72hrs
-60hrs
-48hrs
-36hrs
-24hrs
-12hrs
0hrs
+12hrs
+24hrs
+36hrs
+48hrs
Cloud cover
Divergence
Geopotential
MSLP
Pressure
Relative humidity
Rel' vort'
Temperature
Θe
Vertical velocity
Absolute wind
SR wind
Chart
Satellite
Track map
horiz' P
vert'
High
Middle
Low
200hPa
300hPa
400hPa
500hPa
600hPa
700hPa
850hPa
925hPa
395K
350K
330k
315k
300k
285k
275k
265k
CCB
Back-front
Fronts
Dry slot
Left-right
WCB
Speed
u
v
 , shows which direction is North.